|
Oracle Database 12c: EM Express Active ReportsOracle Enterprise Manager Database Express, also referred to as EM Express, provides support for Composite Active Reports, a significant enhancement to the Active Report technology introduced in Oracle Database 11g. An Active Report is an offline interactive report with full interactive UI capabilities, powered by EM Express UI technology hosted on OTN. A Composite Active Report is a single HTML file that embeds a set of correlated active reports, allowing the user to navigate from one active report to another without requiring a connection to the database. An example of a composite active report is the Performance Hub. In this report EM Express saves all the data in all the tabs, as well as data for the ADDM, SQL Details and SQL Monitor Details pages. Users can now open the report and navigate to the different tabs and pages in much the same way they would if they were connected to a live EM Express instance. 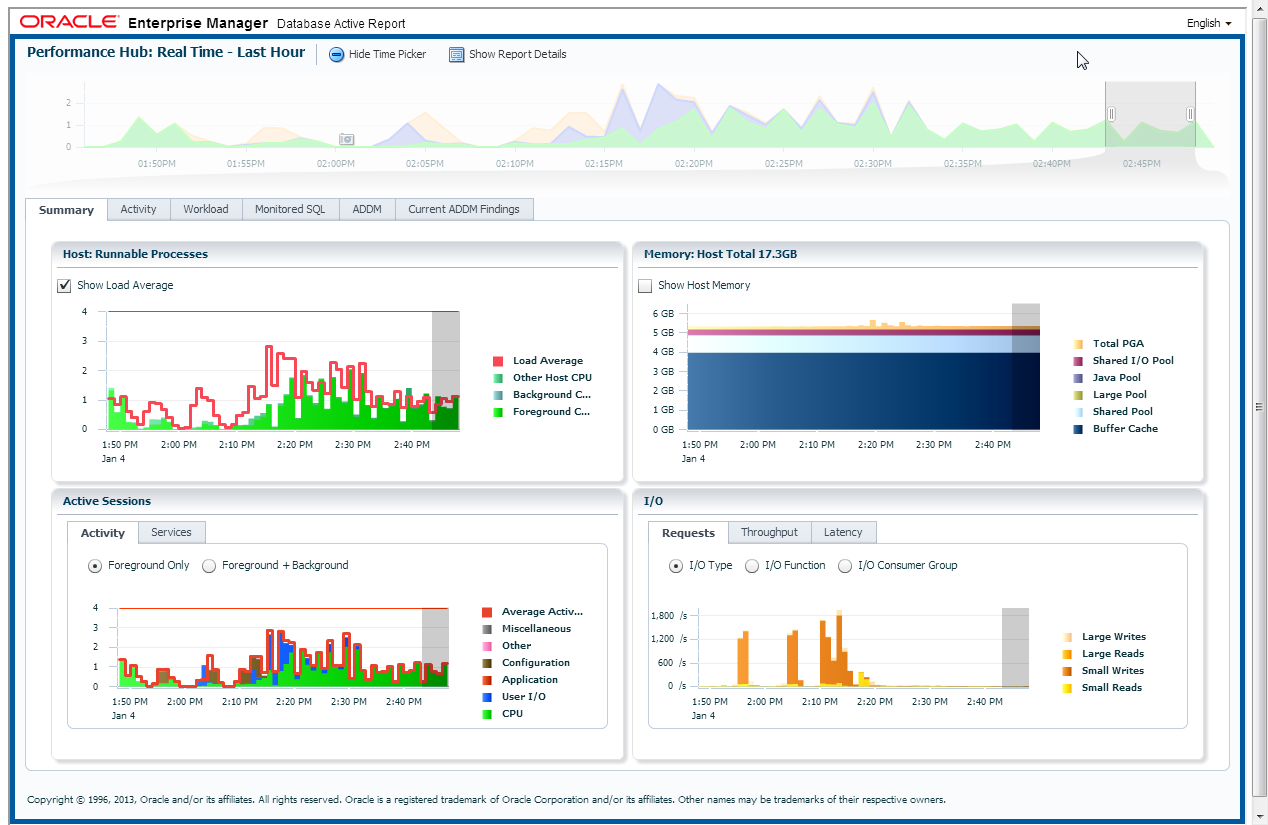 |
Active Report Examples
|
|
|

Frequently Asked Questions
- How can I generate Performance Hub active report?
- What other composite active reports are
available?
- Why does the Performance Hub active
report not include the Automatic Real Time ADDM
report?
- Given a Composite Active Report, how can
I determine the database from which it was saved?
- What is the difference between 'basic',
'typical' and 'all' when saving an active report?
- How large is a Composite Active Report?
- Does DB12 introduce any new active
reports?
- Can I email an active report?
- Do I need any licenses or packs to use
active reports?
- Can I change the time selection when
viewing an active report?
Answers
How can I generate Performance Hub active report?
Performance Hub active reports can be generated directly from the EM Express live UI. Just navigate to the Performance Hub and click the Save button at the top of the page; this will issue a request to the database. Once the data has been retrieved, the user will be prompted for a location and filename; the user can now click OK and save the report locally.
Alternatively, an active report can be generated by
directly invoking the PL/SQL procedure dbms_perf.report_perfhub_xml()
using "active" as the report type. For example, the
following SQL*Plus script shows you how to generate a
realtime PerfHub active report:
set pages 0 linesize 32767 trimspool on trim on long 1000000 longchunksize 10000000
spool perfhub_active.html
select dbms_perf.report_perfhub(is_realtime=>1,type=>'active') from dual;
spool off
The resulting file perfhub_active.html should
be edited to remove the header (first line in the file)
and the last line (spool off). The HTML file can now be
viewed in any browser, provided the browser can connect to
OTN to load the UI code needed to render the active
report.
What other composite active reports are available?
EM Express allows users to save composite active reports
for SQL Details, Session Details and SQL Monitor List.
The SQL Details active report has been significantly
revamped in DB12. Like the Performance Hub active
report, it can be generated by clicking the Save button
from the UI, or from SQL*Plus using the dbms_perf.report_sql()
function.
The Session Details active report can also be generated
from the UI, or from SQL*Plus using the dbms_perf.report_session()
function.
The SQL Monitor List is already part of the Performance
Hub. To generate a standalone SQL Monitor list
active report, use the dbms_sqltune.report_sql_monitor_list()
function.
Why does the Performance Hub active report not include the Automatic Real Time ADDM active report?
The Automatic Real Time ADDM report is essentially a
PerfHub active report that was saved automatically by the
database in response to changes in system activity.
Although it is not retrieved and included in a Performance
Hub active report, the ADDM tab in the PerfHub active
report indicates if any Automatic Real-Time ADDM reports
were seen in the selected time range. For an
example, click here.
An Automatic Real Time ADDM report can be viewed and
saved on its own. However, since it is essentially a
PerfHub active report, the report, when opened, will
display "Performance Hub" in its title instead of
Automatic Real Time ADDM.
To see an
Automatic Real Time ADDM Active Report, click here.
Given a Composite Active Report, how can I determine the database from which it was saved?
Click on the "Show Report Details" button at the top of
the active report. This will show additional
information about the report such as database name,
instance name, host name and the time frame for the
report.
What is the difference between 'basic', 'typical', and 'all' when saving an active report?
These levels control the amount of data saved in an active
report. For example, in 'basic' mode, only the
information in each tab is saved, but in 'typical' mode,
EM Express also saves the SQL Details and SQL Monitor
Details for the high load SQL statements. With
'all', all the SQL Details and SQL Monitor Details are
saved. In general, active reports that contain more data
take longer to generate.
How large is a Composite Active
Report?
Although the Composite Active Report contains large
amounts of data, the actual size of the report is fairly
small; a typical active report of the Performance Hub is
usually in the 300KB-400KB range. The small size of
the active reports is achieved using data compression.
Does DB12 introduce any new active reports?
In addition to the composite active reports -- Performance Hub, SQL Details, Session Details, SQL Monitor List -- there is now also an active report for SQL Tuning.The SPA and SQL Monitor Details active reports, which were introduced in 11g, have also been enhanced.
Can I email an active report?
Yes, but not from EM Express; there is no Mail
button. However, you can save the active report
locally, and then email the HTML file as an attachment.
Do I need any licenses or packs to use active reports?
You can only save active reports for features that are
already covered by the Diagnostics and Tuning packs.
Can I change the time selection when viewing an active report?
No, you cannot change the time selection when viewing an active report because you are no longer connected to the database.If you want to save the active report for a given time range, use the timepicker to select a time range before saving the active report. Now when the active report is generated, it will save data for the selected time range.