Dashboard Administration is concerned with the configuration of Dashboard Elements. Each Dashboard Element has a Status, which is derived from the results of the Element.
A Dashboard Element is a line item of data quality information that a user can monitor on the Dashboard. There are four types of Dashboard Element:
So, Indexes, Summaries and Real Time Aggregations are three different ways of aggregating Rule Results, which may be generated either in Batch or Real Time.
An index is a type of dashboard element with a single numeric value, representing the aggregated results of a number of measures of data quality (Rule Results). The contributing measures are weighted to form an index across all chosen measures. Indexes are used for trend analysis in data quality, in order to track the data quality in one or many systems over a period of time.
Indexes aggregate Rule Results, though it is also possible to aggregate indexes hierarchically to create an index of indexes. For example, a data quality index could be constructed for each of a number of source systems, or each of a number of types of data (customer, product etc.). An overall data quality index could then be constructed as an aggregation of these indexes.
Indexes are always configured in Dashboard Administration.
The index value means little in isolation. However, as the score is calculated from the results of a number of executions of a process or processes (over time), trend analysis will allow the business user to monitor whether the index has gone up or down. This is analogous to monitoring the FTSE100 index.
A higher index value represents a higher data quality score. By default, a ‘perfect’ DQ index score is 1000.
Index of Rule Results
Where an index is made up of a number of Rule Results, it is calculated as a weighted average across the contributing results.
For example, a Customer Data DQ index may be made up of the following Rule Results and Weightings:
|
Contributing Rule |
Weighting |
|---|---|
|
Validate email address |
12.5% |
|
Validate address |
25% |
|
Title/gender mismatches |
37.5% |
|
Validate name |
25% |
In this configuration, the Validate address and Validate name rules have the default weighting of 25% (a quarter of the overall weight across four rules), but the administrator has specified different weightings for the other rules – the Validate email address rule is interpreted as less important, and the Title/Gender mismatch as more important.
The actual index score is then calculated as a weighted average across internally calculated index scores for each contributing rule.
For each rule, an index score out of 1000 (or the configured base perfect score) is calculated as follows, where 10 points are awarded for a pass, 5 points for a warning, and no points are awarded for an alert:
(((# of passes * 10) + (# of warnings * 5)) / (# of checks *10)) * 1000
For example, if the results of the contributing rules are as follows...
|
Rule |
Checks |
Passes |
Warnings |
Alerts |
|---|---|---|---|---|
|
Validate email address |
1000 |
800 (80.0%) |
100 (10.0%) |
100 (10.0%) |
|
Validate address |
1000 |
800 (80.0%) |
0 (0%) |
200 (20.0%) |
|
Title/gender mismatches |
1000 |
800 (80.0%) |
0 (0%) |
200 (20.0%) |
|
Validate name |
1000 |
800 (80.0%) |
0 (0%) |
200 (20.0%) |
…then the index scores of each contributing rule will be as shown below:
|
Rule |
Index Score Calculation |
Index Score |
|---|---|---|
|
Validate email address |
800 passes * 10 points = 8000 + 100 warnings * 5 points = 500 Total = 8500 1000 checks * 10 = 10000 8500/10000 = 0.85 * 1000 = 850 |
850 |
|
Validate address |
800 passes * 10 points = 8000+ 0 warnings * 5 points = 0 Total = 8000 1000 checks * 10 = 10000 8000/10000 = 0.8 * 1000 = 800 |
800 |
|
Title/gender mismatches |
800 passes * 10 points = 8000+ 0 warnings * 5 points = 0 Total = 8000 1000 checks * 10 = 10000 8000/10000 = 0.8 * 1000 = 800 |
800 |
|
Validate name |
800 passes * 10 points = 8000+ 0 warnings * 5 points = 0 Total = 8000 1000 checks * 10 = 10000 8000/10000 = 0.8 * 1000 = 800 |
800 |
The overall index score is then calculated using the weightings, as follows:
Validate email address score (850) * Validate email address weight (0.125) = 106.25 +
Validate address score (800) * Validate address weight (0.25) = 200 +
Title/gender mismatch score (800) * Title/gender mismatch weight (0.375) = 300 +
Validate name score (800) * Validate name weight (0.25) = 200
So the total Customer Data DQ index score is 806.25. This is rounded up to 806.3 for display purposes.
Index of Indexes
If an index is created to aggregate other indexes, the index is calculated simply as a weighted average of the contributing indexes. For example, the user might set up an index across a number of other indexes as follows:
|
Contributing Index |
Weighting |
|---|---|
|
Customer data index |
50% |
|
Contact data index |
25% |
|
Order data index |
25% |
So, if the index values of each indexes are as follows…
|
Contributing Index |
Index Score |
|---|---|
|
Customer data index |
825.0 |
|
Contact data index |
756.8 |
|
Order data index |
928.2 |
…the index would be calculated as follows:
Customer data index (825) * Customer data index weight (0.50) = 412.5 +
Contact data index (756.8) * Contact data index weight (0.25) = 189.2 +
Order data index (928.2) * Order data index weight (0.25) = 232.5
So the overall data quality index would have a value of 834.2.
Indexes of staggered audit results
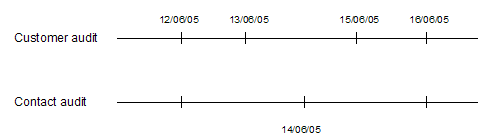
Indexes may aggregate results from a number of processes. Normally, it is expected that this form of aggregation will be used when the processes are executed at the same intervals. However, this cannot be guaranteed. In some cases, the processes contributing to an index will be out of step. For example, 2 data quality audit processes are executed as follows:
If an index is configured to aggregate rule results from both processes, results for the index history will be published as follows:
|
Date |
Using results from Customer audit process run on |
Using results from Contact audit process run on |
|---|---|---|
|
12/06/05 |
12/06/05 |
12/06/05 |
|
13/06/05 |
13/06/05 |
12/06/05 |
|
14/06/05 |
13/06/05 |
14/06/05 |
|
15/06/05 |
15/06/05 |
14/06/05 |
|
16/06/05 |
16/06/05 |
16/06/05 |
This works by recalculating the results for the index every time one of its contributing processes is run. The results from the last run of each process are then used, and any previously calculated index results for a distinct date (day) are overwritten.
A Summary is a type of dashboard element that aggregates a number of Rule Results into a summarized view showing the number of rules of each status (Red, Amber and Green).
Summary dashboard elements are created directly whenever publishing rule results from an OEDQ process (where a summary is created summarizing all the rule results that are published from the process), or they may be configured manually by a dashboard administrator. Where configured by an administrator, the Summary may aggregate results from a number of different processes, and if required, across a number of different projects.
Note that unlike all other types of dashboard element, Summaries do not support trend analysis. This is because the Rule Results that comprise the summaries may be changed over time, and may be published at different times.
A Real Time Aggregation is a type of dashboard element that aggregates a single Real Time Rule Result dashboard element into a set of results for a different (normally longer) time period. Real Time Rule Results are published by processes that run in interval mode - normally continuously running processes. Intervals may be written on a regular basis so that OEDQ users can see results on a regular basis - for example every hour, or every 100 records. However, it may be that Executives or other users may want to monitor results on a daily or weekly basis. This can be achieved by configuring a Real Time Aggregation and making this element available to users rather than the underlying Real Time Rule Results.
Rule Results are dashboard elements that directly reflect the results of an OEDQ processor that is configured to publish its results to the Dashboard. Rule Results are therefore the most granular (lowest level) type of dashboard element.
Rule Results may be either Periodic (published from batch processes), or Real Time (published from real time processes that run in interval mode). The following icons are used to represent the different types of Rule Results in the Dashboard Elements pane:
![]() Periodic Rule Results
Periodic Rule Results
![]() Real Time Rule Results
Real Time Rule Results
Oracle ® Enterprise Data Quality Help version 9.0
Copyright ©
2006,2012, Oracle and/or its affiliates. All rights reserved.