The Graph Results Wizard is designed to allow you to generate a graph from your current view of results.
There are 3 main areas of the wizard:
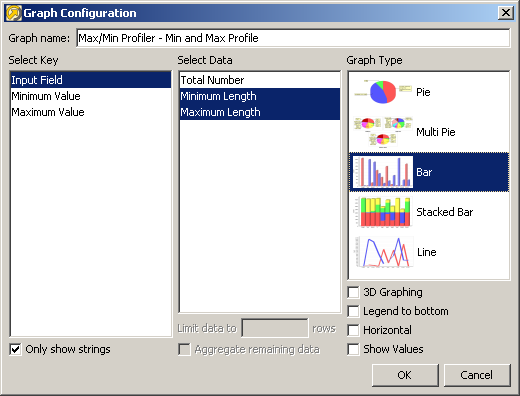
Select the key or keys to be used from the list provided. The key is the column to be plotted.
For instance for the Max/Min Profiler, there are 3 potential keys: Input Field, Minimum Value, Maximum Value. The most common (and default) key to plot is Input Field, that is, the attributes selected in the processor.
In a small number of cases, it may make sense to use multiple columns as keys - this then creates a single key based on the combination of values in the selected key columns. For example, this is useful when plotting the results of a Parse processor that processes several attributes.
|
Note:For the results from audit processors, the key is always known, so this is not provided as an option for configuring graphs from these processors. |
Select the data values to be plotted for the key.
For instance for the Max/Min Profiler there are 3 potential data items which may be graphed: Total Value, Minimum Length, Maximum length. Total Value is simply the number of records processed, so is not interesting to graph. The interesting data items are Minimum Length and Maximum Length.
There are 5 potential types of graph which may be plotted:
|
|
|
|
|
|
|
|
|
|
|
|
|
|
Select the type of graph which best represents your data.
The data shown may be limited to a defined number of rows. For instance where the majority of data occurs in the top 10 records, and there are many records of a very low frequency, you may wish to limit the data to be graphed to the top 10 rows. Where the limit data option is used, a further option is enabled: 'Aggregate remaining data'. For instance, if data is limited to 10 rows, a further row can be added which is the aggregate of all other data. This can help the user to visualize the spread of data.
Oracle ® Enterprise Data Quality Help version 9.0
Copyright ©
2006,2011 Oracle and/or its affiliates. All rights reserved.
