Creating Data Models and Publishing Report Templates in Embedded Reporting
Purpose
This tutorial covers how to get started with Oracle BI Publisher, the underlying techology in Embedded Reporting, to create simple reports. It teaches you how to create a data model, and a report layout using the Microsoft BI Publisher plug-in.
Time to Complete
Approximately 1 hour.
Overview
This tutorial is intended for users who want to create reports using Oracle BI Publisher in the Taleo Recruiting Embedded Reporting feature. The tutorial covers the regular features of the Oracle BI Publisher, such as creating simple reports from various data sources, creating layouts, scheduling reports, and managing them.
This tutorial is intended for users who already have an understanding of the principles of writing SQL, and/or who have previous experience with Oracle BI Publisher.
Requirements
Taleo Enterprise 14B or later is required to complete this training.
- The Oracle Business Intelligence Reporting product and the Recruiting Embedded Reporting feature must be enabled on your zone.
Prerequisites
Before starting this tutorial, you should have the proper user type permissions. The Author Content (BI Developer) and the Access Embedded Reports permissions are recommended. The Access Subject Area - Recruiting and Access Embedded Reporting Management permissions are also required.
Oracle BI Publisher MS Word plug-in is required. The plug-in can be downloaded at the Oracle BI Publisher download page (http://www.oracle.com/technetwork/middleware/bi-publisher/downloads/index.html ).
Note From the Author
The field values available, and the rows returned will vary as you are reporting on the information from your zone.
General Navigation
In this topic, you will learn how to access Embedded Reporting to create a report.
Logging In
This topic will cover the general navigation to start with the analytic process.
. |
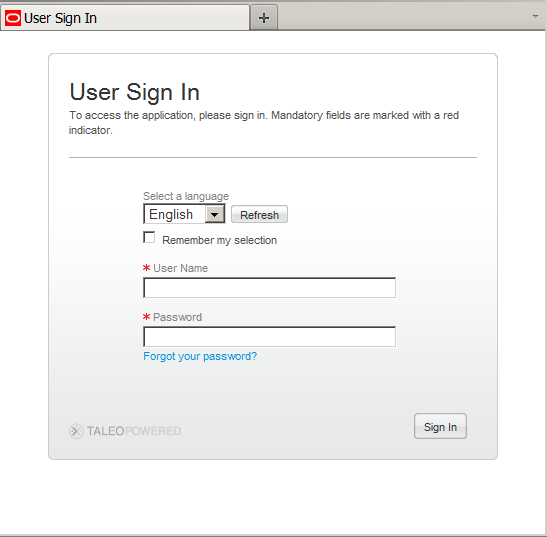
Navigate to the Oracle Taleo Enterprise User Sign In page. Enter your User ID and Password and click Sign In.
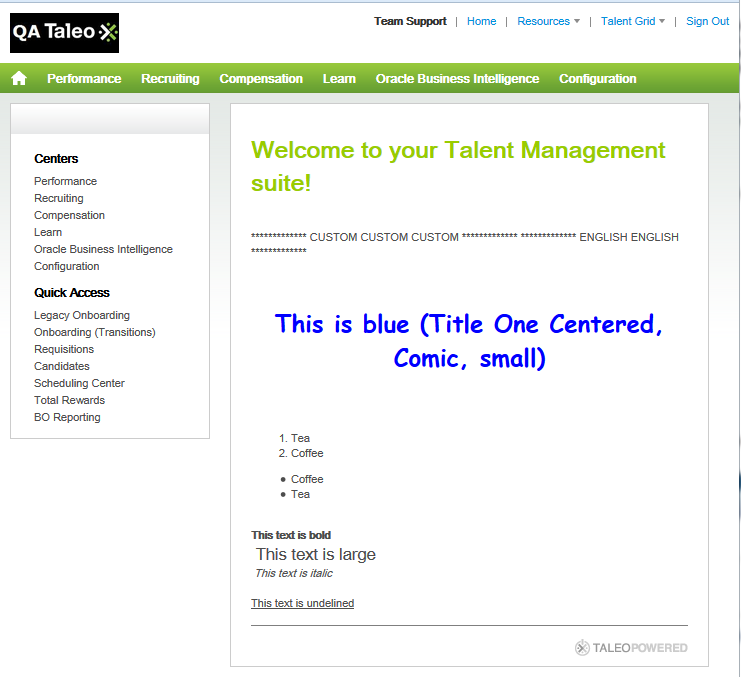
Once you have signed in, the Welcome Center is displayed. |
|---|---|
. |
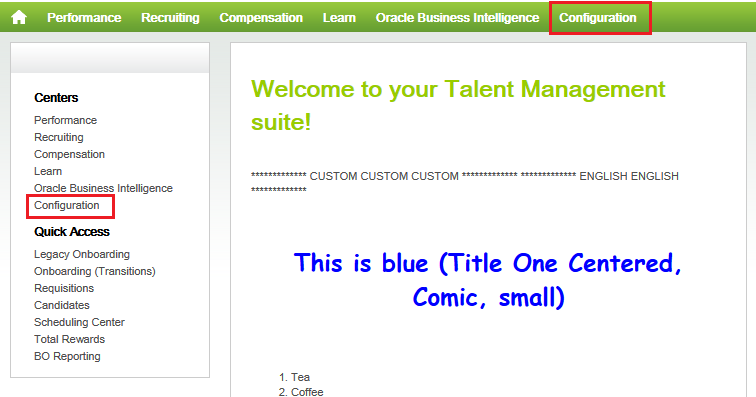
The Welcome Center is the landing page where you can choose which Oracle Taleo Enterprise Cloud Service module you would like to access.
|
Accessing and Running Published Reports in Recruiting
Published reports can be accessed in the Recruiting module.
You can access and run all reports you have access to through Recruiting.
. |
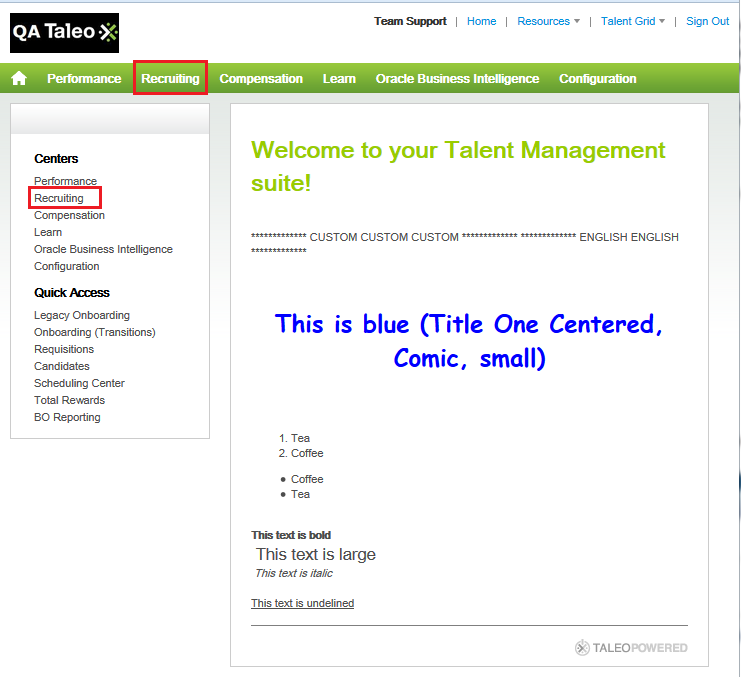
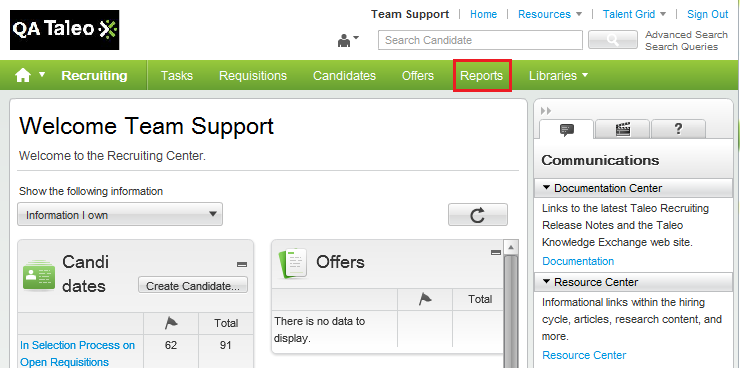
Access the Recruiting Center by clicking Recruiting in the top navigation bar or in the Centers located in the left panel.
The Recruiting Center is now open.
|
|---|---|
. |
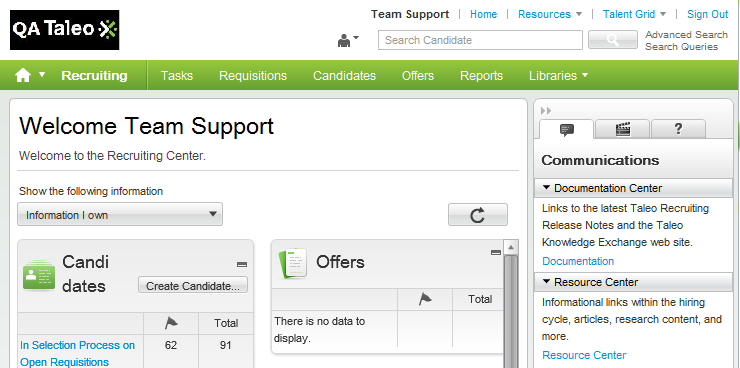
Access embedded reports by clicking Reports from the top navigation bar.
The reports panel is displayed. |
. |
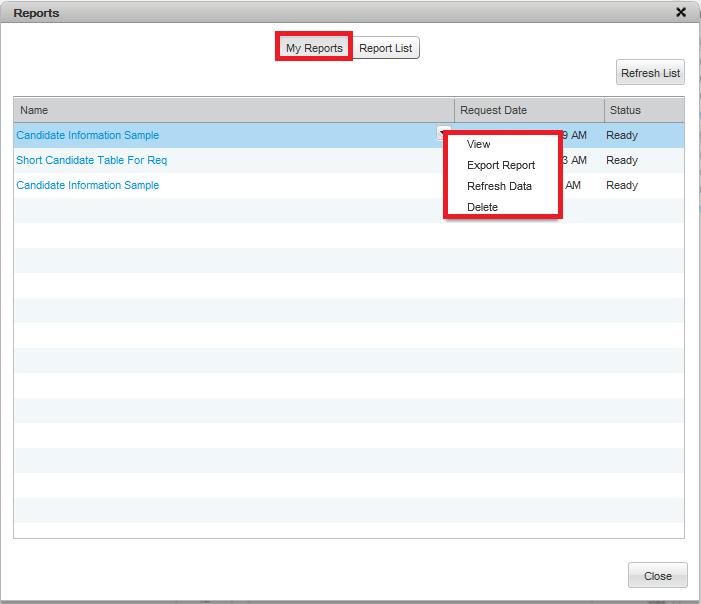
In the My Reports pane you can view a list of all reports you have previously run. The following actions can be run on a report:
|
. |
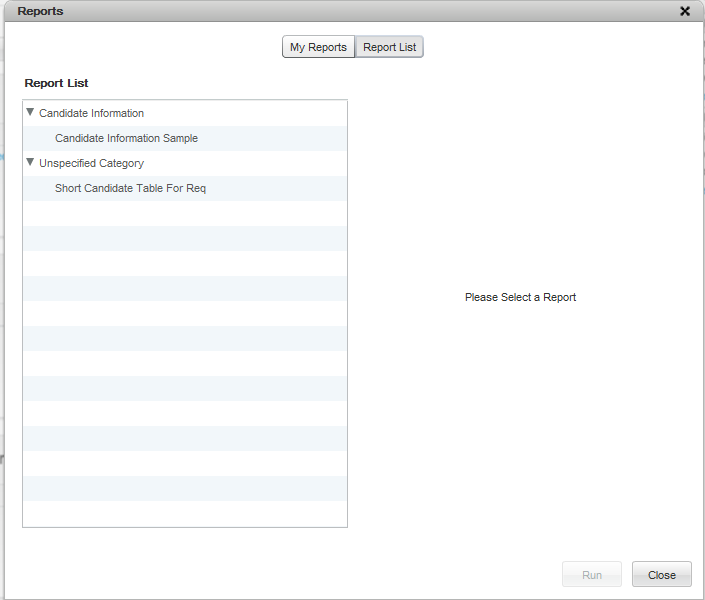
Click the Report List button to view a list of reports that are available for you to run. The reports are available in the report list pane categorized in groups created by the report creator.
|
. |
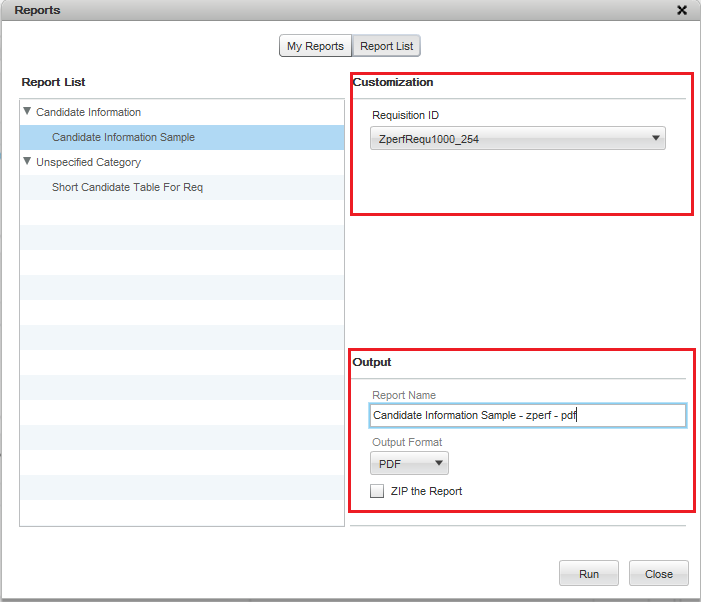
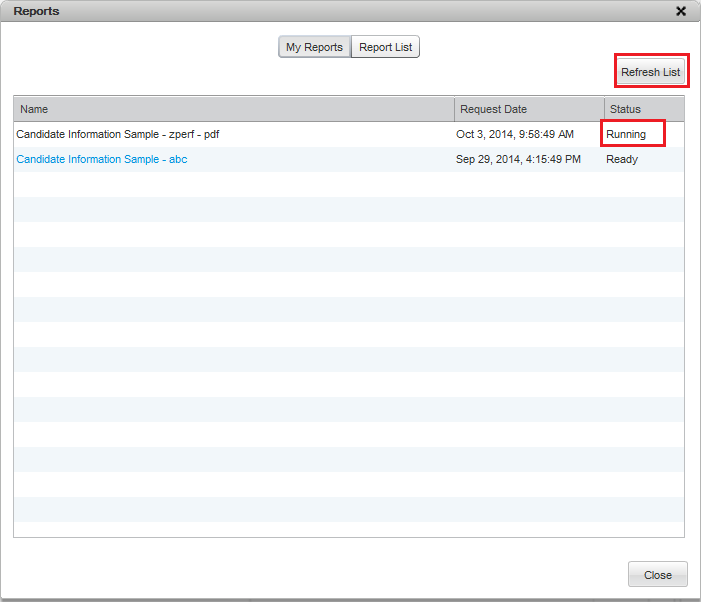
Select a report to run. In the customization area you can select values for any parameters created by the report writer. In the output section you can choose a report name that will be the report label in My Reports . You will also specify the output format based on a list of formats the report writer has made available. You may also choose to receive your output as a zip file in this section.
After you run the report the output will be displayed as running in the My Reports panel.
Click the Refresh List button until your report has a status of Ready
|

Accessing Embedded Reporting Authoring Center
This topic covers the steps to navigate to the Embedded Reporting authoring center.
. |
a. From the Welcome Center click Configuration.
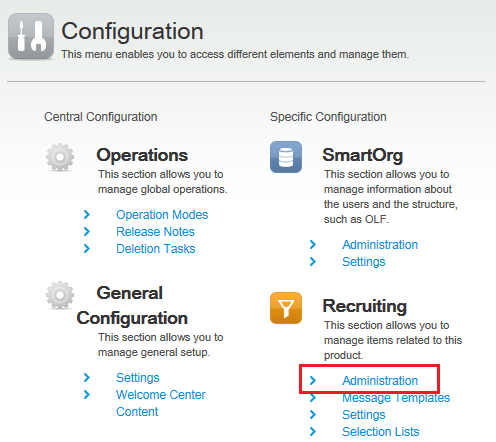
b. Click Administration under Recruiting.
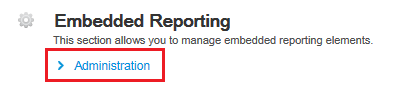
c. Click Administration under Embedded Reporting.
You are now in the Embedded Reporting administration section.
|
|---|
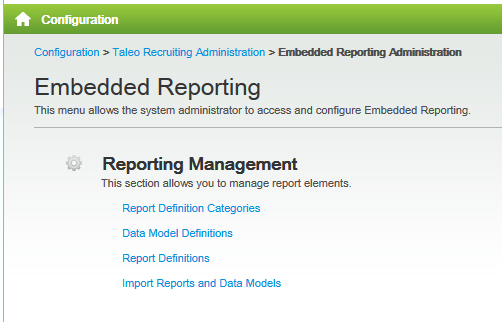
Creating a Data Model Definition
Naming a Data Model Definition
This topic covers the first steps to creating a data model.
. |
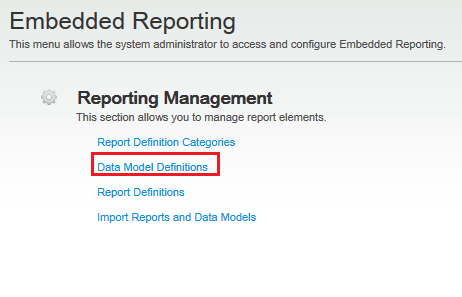
From Embedded Reporting click Data Model Definitions.
|
|---|---|
. |
The list of data model definitions appears. Click Create to create a new data model definition.
|
. |
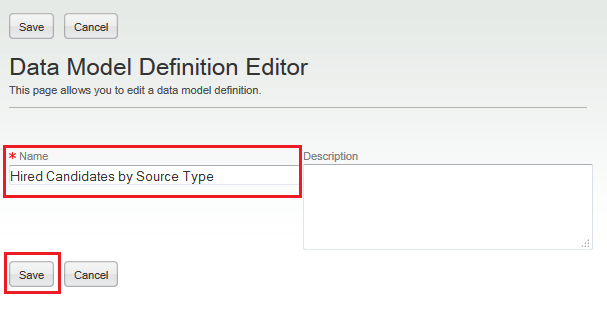
In the Data Model Definition Editor, name the data model definition Hired Candidates by Source Type and click Save
You can now add content to your data model definition. |


Creating a List of Values
This topic demonstrates how to create a dynamic list of values to use in a parameter for data filtering. This step is optional and is only necessary if you are going to make a menu available for a parameter.
There are two types of lists of values you can create in the system, one is a dynamic list based on a SQL Query, and one is a fixed data list where you may specify a list of name/value pairs. In this exercise we will create a dynamic list based on a SQL Query.
|
. |
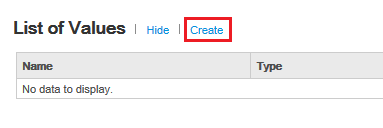
In the Data Model Definition Editor - List of Values section, click Create to create a list of values.
|
|---|---|
|
. |
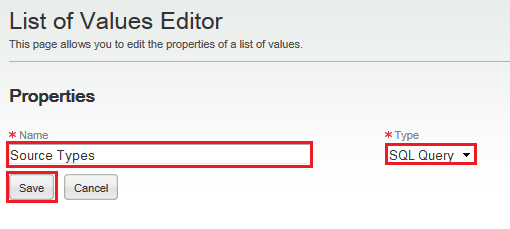
In the List of Values Editor name the list of values Source Types and select SQL Query as type. Click Save.
|
|
. |
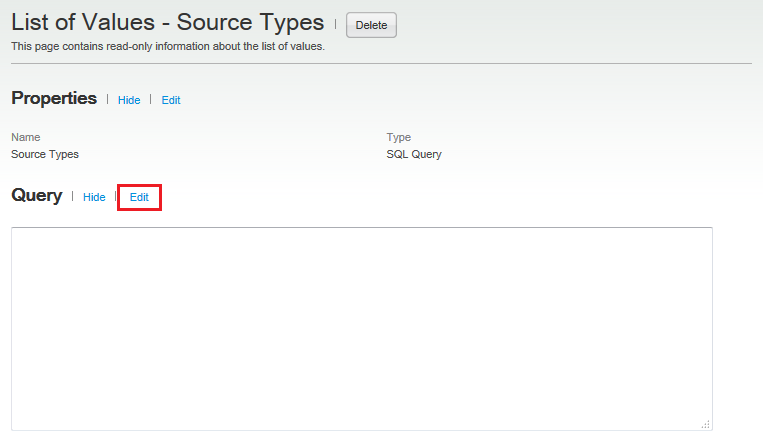
In the List of Values editor - Query section click Edit.
|
|
. |
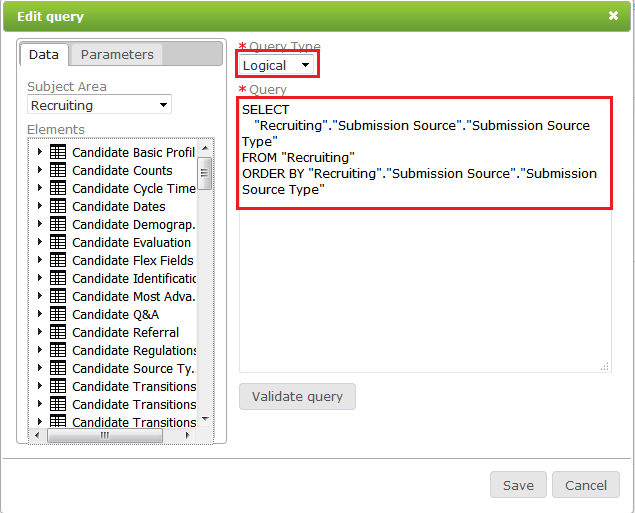
The query editor is displayed. Select Logical as the Query Type. Insert the following SQL Statement SELECT
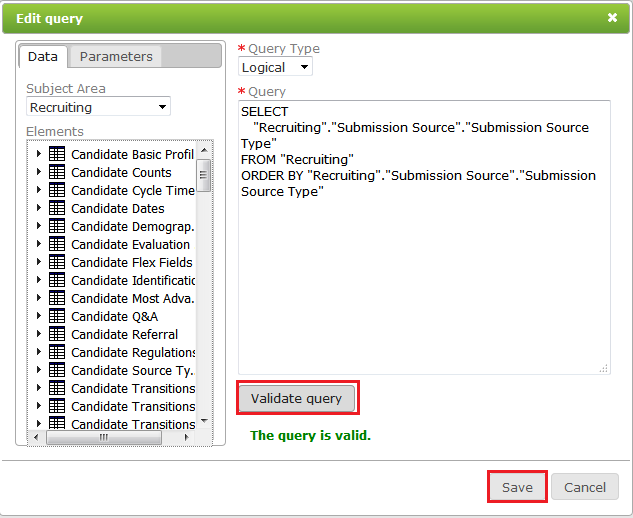
Note: Logical SQL statements can be viewed in the Advanced tab of analyses in OBI if you are unsure about syntax. Data objects and parameters can be added to SQL statments from the left channel. We will be adding SQL statements in this manner when we create the data definition. Validate the query and save the filter. If you do not get the message "They query is valid." you have made a mistake when inputting the SQL statement. Check your syntax and try again.
|
|
. |
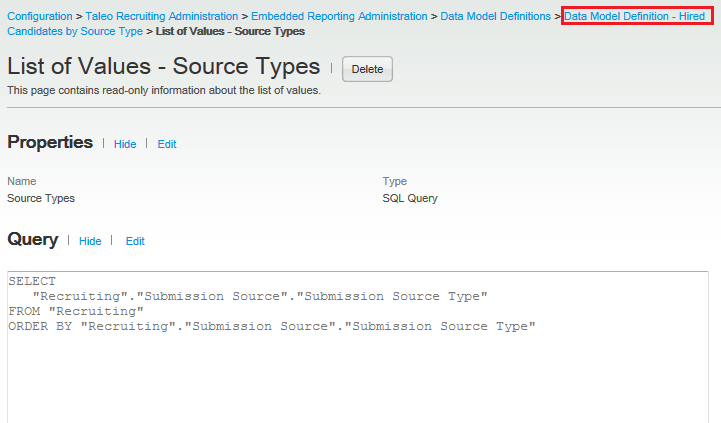
Use the breadcrumbs to return to the data model definition.
|
Creating Parameters
This topic covers how to add a parameter to the data model. Parameters can be used to limit the amount of data that is returned in a report.
. |
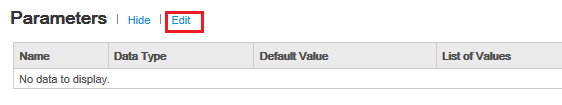
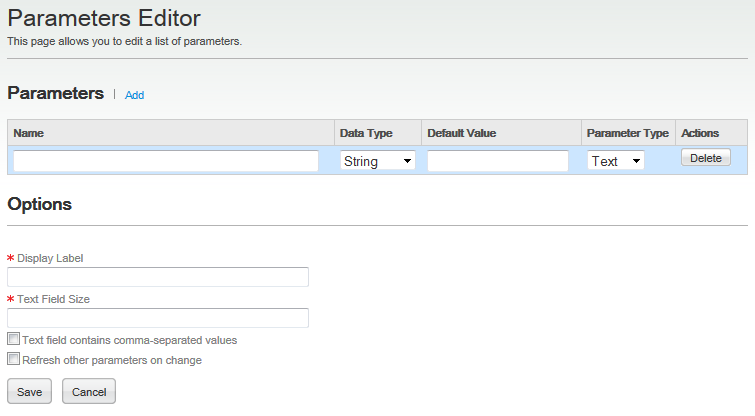
Click Edit in the Parameters section of the Data Model Editor.
The Parameters Editor opens.
|
|---|---|
. |
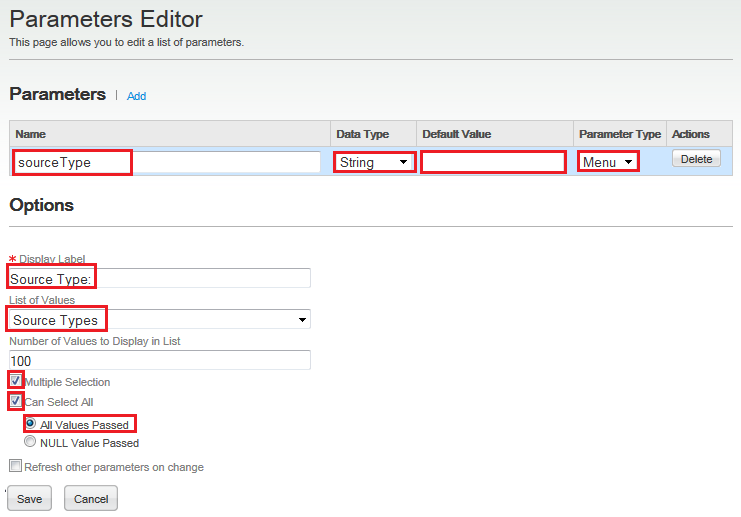
To create the first parameter: a. Name the parameter sourceType. b. Set the Data Type to String. c. Do not set a default value. d. Set the Parameter Type to Menu. e. Set the display label to Source Type:. f. Set the list of values to Source Types. g. Select Multiple Selection. h. Select Can Select ALL. i. Select All Values Passed. Note: The Refresh other parameters on change option can be used if a parameter is set in the list of values SQL.
|
|
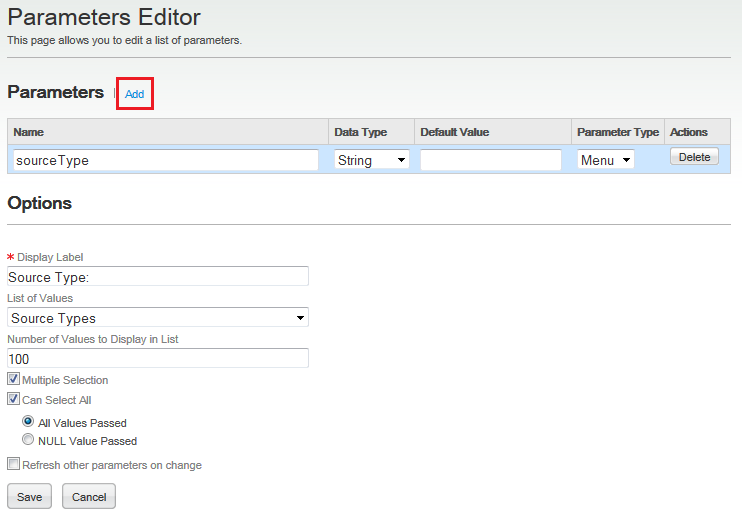
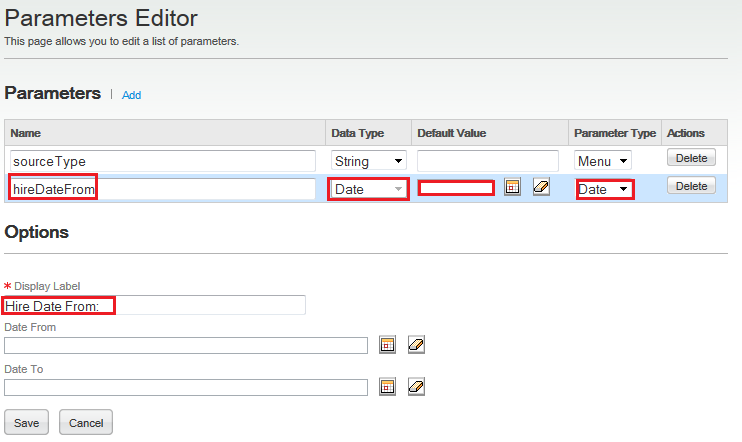
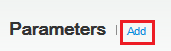
Click Add to add another parameter.
Set the following attributes: a. Name the parameter hireDateFrom. b. Set the Data Type to Date. c. Do not set a default value. d. Set the Parameter Type to Date. e. Set the display label to Hire Date From:. Note: The Date From and Date To fields limit the date range in the date selector prompt.
|
. |
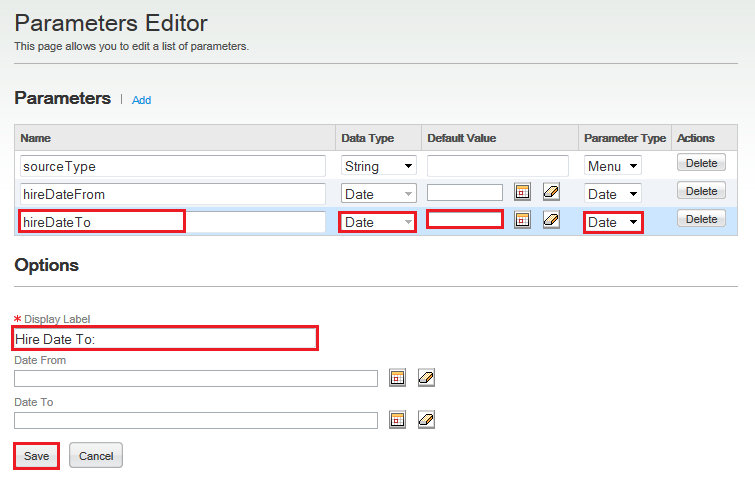
Click Add to add another parameter.
Set the following attributes: a. Name the parameter hireDateTo. b. Set the Data Type to Date. c. Do not set a default value. d. Set the Parameter Type to Date. e. Set the display label to Hire Date To:. Note: The Date From and Date To fields limit the date range in the date selector prompt.
Save the parameters by clicking Save. |
Creating a Data Set
A data set contains a SQL query which represents the logic to retrieve data from a data source. The data set can use parameters in its logic.
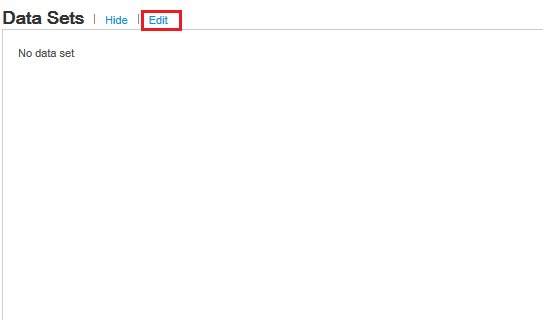
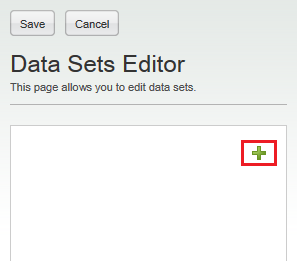
. |
Click Edit to create/modify the data set.
|
|---|---|
. |
Click the green plus sign to add a dataset.
The data set editor is now available.
|
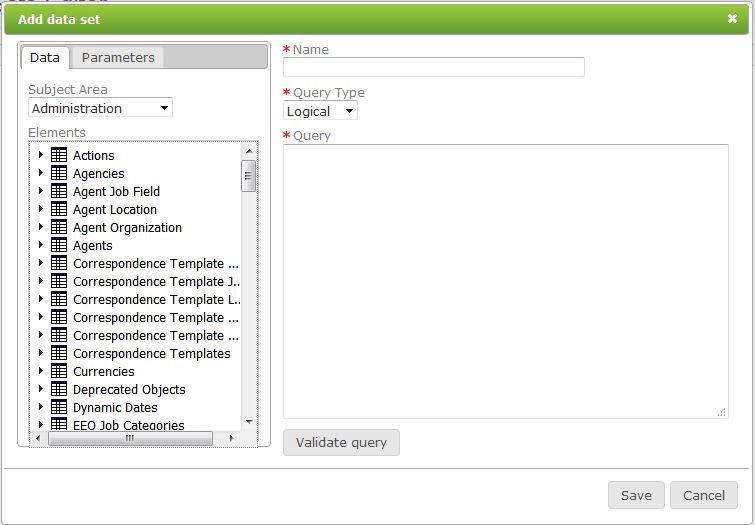
. |
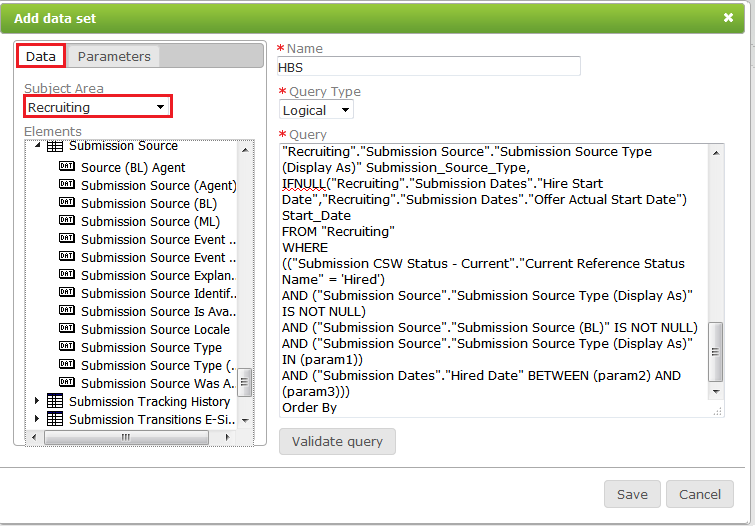
Name your data set HBS and insert the following syntax into the query Editor: SELECT
|
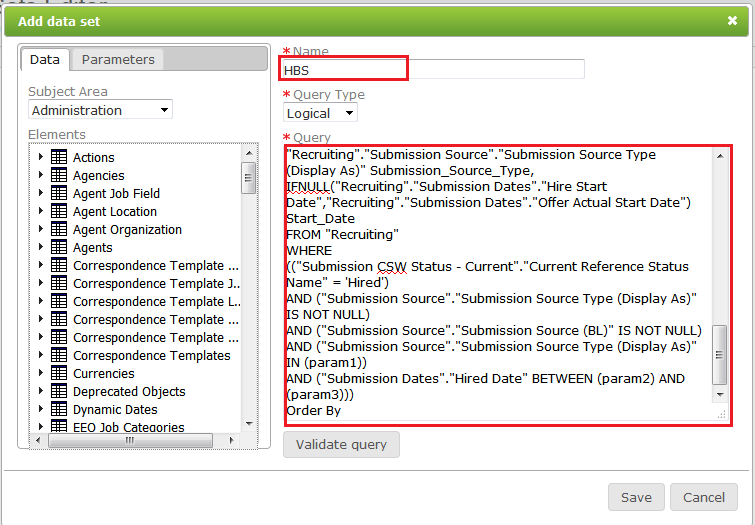
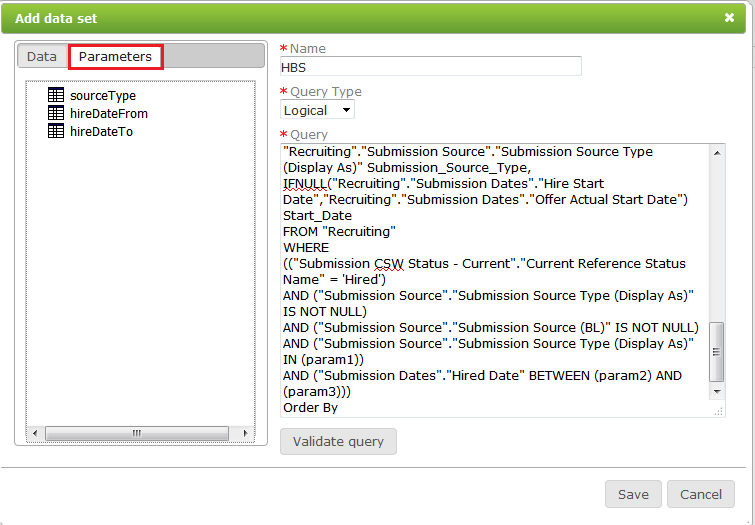
. |
Now you will add parameters to the query condition. a. In the data set editor - objects panel, select the Parameters tab.
b. In the data set editor - query editor replace param1 with the parameter sourceType by deleting param1 and clicking sourceType in the objects panel. Your query should look like this.
c. Repeat steps a and b to replace param2 with hireDateFrom and param3 with hireDateTo. They syntax of your where clause should be as follows. WHERE |
. |
Next we will add an element from the recruiting subject area in the objects panel. a. Select the subject area Recruiting from the Data tab.
b. Put your cursor after the Order By statement in the query editor and click the element Submission Source (BL) from the Submission Source Table in the elements pane.
Your query should now have the following syntax. If you are unable to validate the query in the next step check your syntax. SELECT |
. |
Validate and save the query. If you do not get the message that the query is valid re-check your syntax.
|
. |
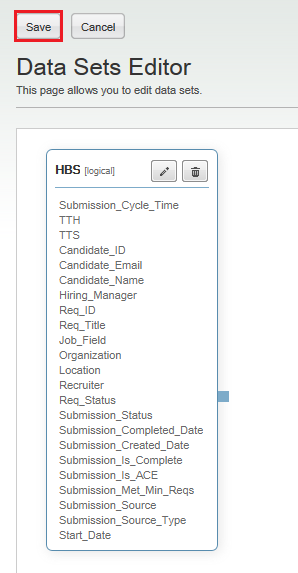
Click Save in the data sets editor.
|
. |
Click Data Model Definitions in the bread crumb trail to return to the list of Data Model Definitions.
This concludes creating the data model. We will activate the data model after we create the report template. |


Creating a Report Template
In this topic you will learn how to create a report template using the BI Publisher Plug-in for Microsoft Word.
Data Model XML
In this subtopic, you begin the template creating process by downloading a sample XML file and uploading it into BI Publisher to use the XML Schema.
. |
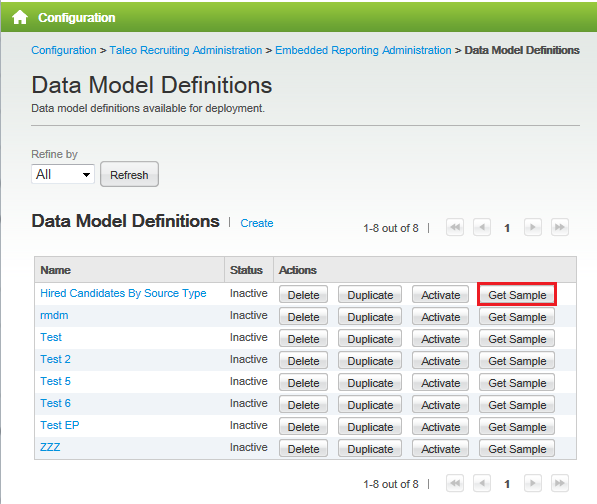
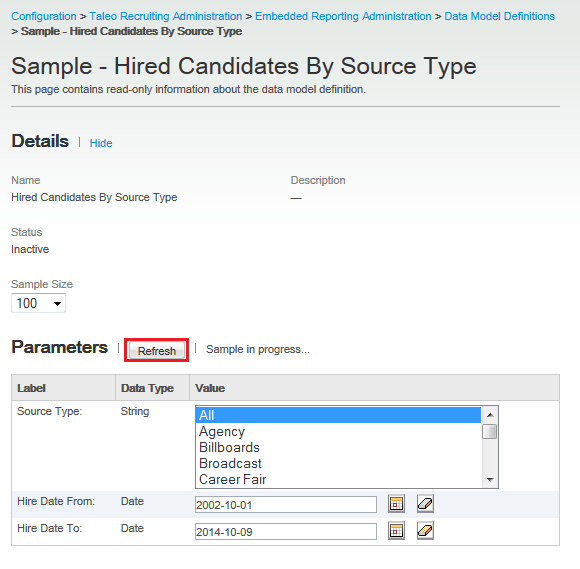
Click Get Sample for Hired Candidates By Source Type.
|
|---|---|
. |
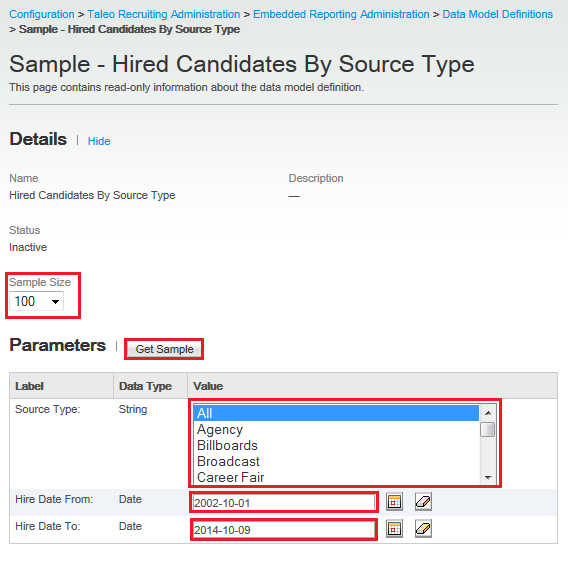
Set the sample size to 100 records, add values for the parameters and then click Get Sample. Note: You may select any parameters that make sense for your data.
|
. |
Next, you will add a named filter that you previously created to limit the analysis.. Click Refresh until you get the option to download sample.
|
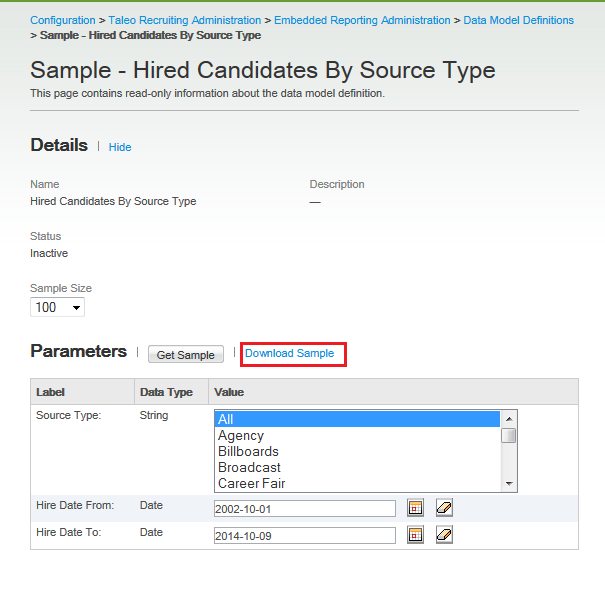
. |
Click Download Sample to download your sample.
Save the file to your computer with the default file name. |
. |
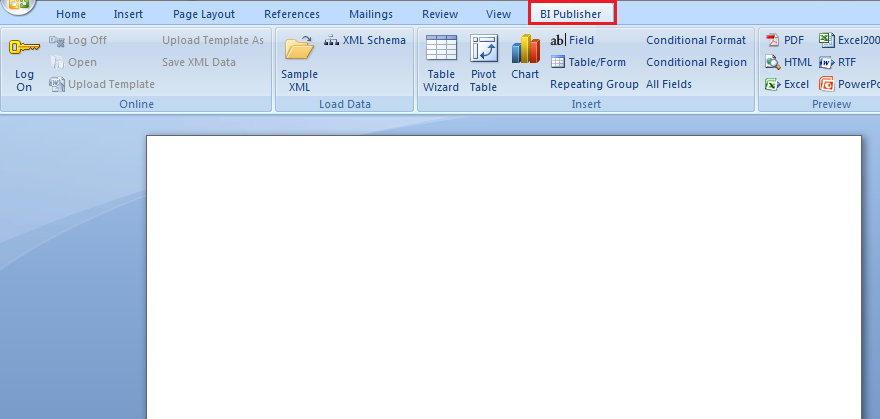
Open Microsoft Word and go to the BI Publisher Tab.
|
. |
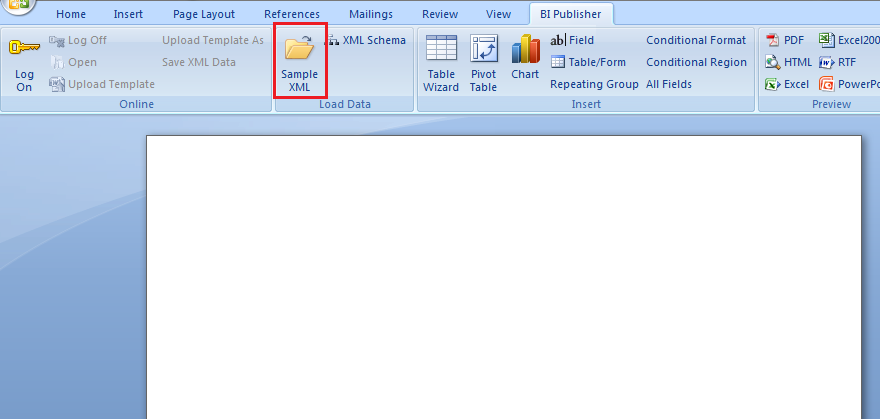
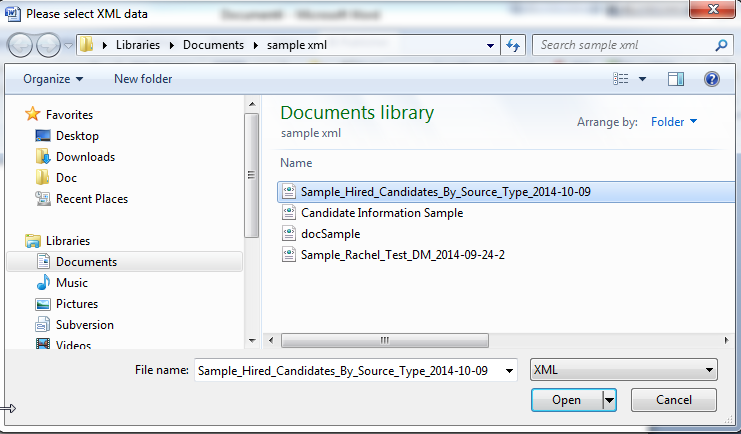
Import the xml. a. Click the Sample XML icon.
b. Select the sample xml you downloaded previously.
You will get a message that the data loaded successfully.
|
Inserting Charts Into the Template
To begin creating the template we will brand and title the report and then insert some charts.
|
. |
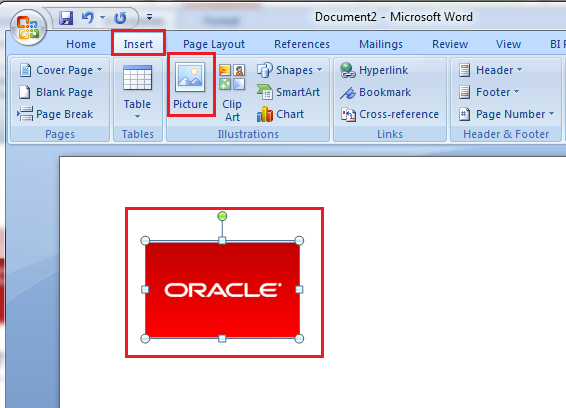
Click the Insert tab, then click Picture to insert a picture of a company logo.
|
|---|---|
|
. |
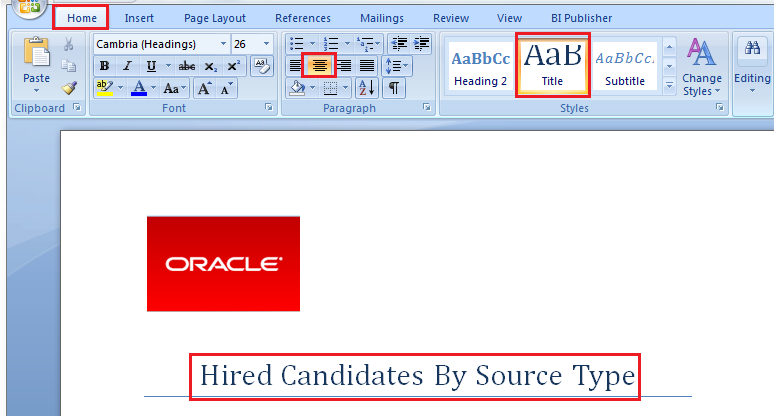
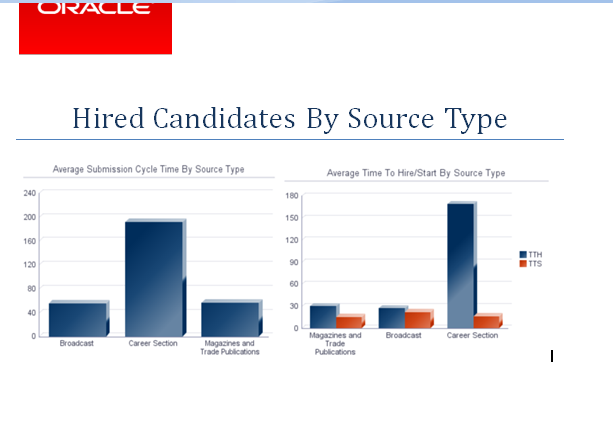
Click Home Tab select the Title style, center the cursor and enter the title Hired Candidates By Source Type.
|
|
. |
Move your cursor down a line and in the BI Publisher tab select Chart.
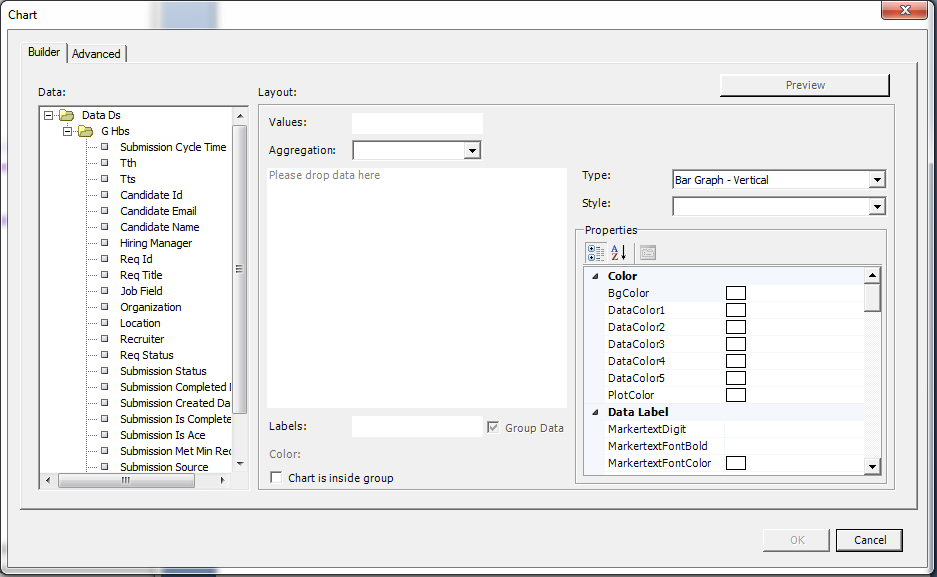
The chart builder displays.
The chart builder is made of two tabbed pages: the Builder page and the Advanced page. The Advanced page allows you to directly manipulate the chart syntax.
|
|
. |
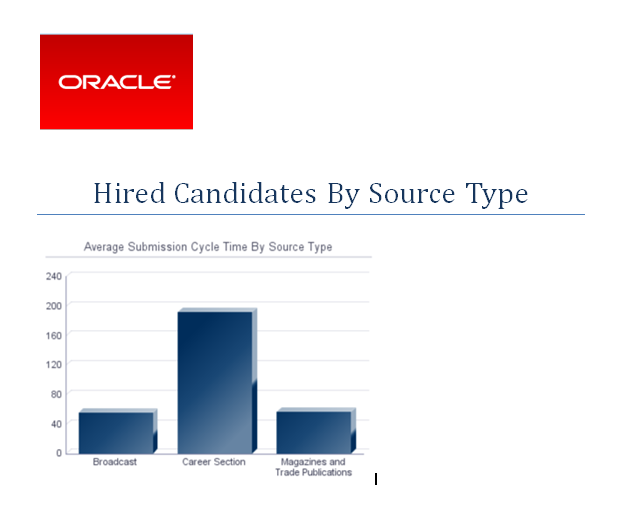
a. Drag and drop Submission Cycle Time into the Values: field. b. Set the aggregation rule to Average. c. Drag and drop Submission Source Type into the Labels: field. d. In the Properties section, set LegendShow to False. e. In the Properties section, set Title to Average Submission Cycle Time By Source Type. f. Click Preview.
Click OK. The chart appears in the document.
|
|
. |
In the BI Publisher tab select Chart.
The chart builder displays.
|
|
. |
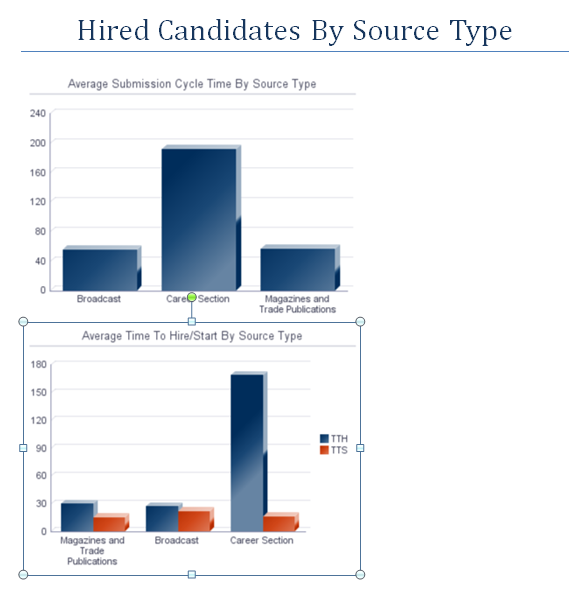
a. Drag and drop Tth and Tts into the Values: field. b. Set the aggregation rule to Average. c. Drag and drop Submission Source Type into the Labels: field. d. In the Properties section, set LegendShow to False. e. In the Properties section, set Title to Average Time To Hire/Start By Source Type. f. Click Preview.
Click OK. The chart appears in the document.
|
|
. |
Resize the charts so they are the same size and both fit on the same line.
|
|
. |
Move your cursor down a line, center it and in the BI Publisher tab select Chart.
The chart builder displays.
|
|
. |
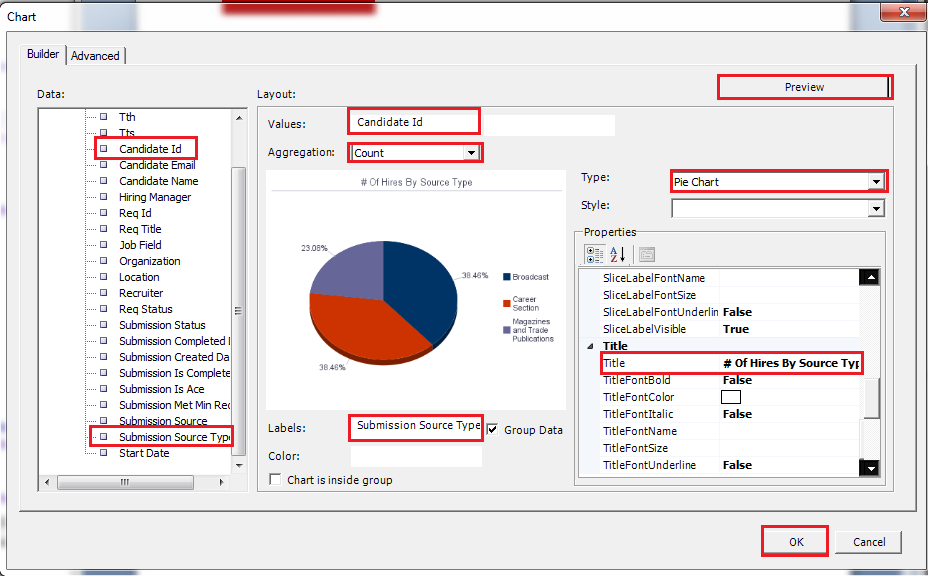
a. Drag and drop Candidate Id into the Values: field. b. Set the aggregation rule to Count. c. Drag and drop Submission Source Type into the Labels: field. d. In the Properties section, set Title to # Of Hires By Source Type. e. Set Type to Pie Chart. f. Click Preview.
Click OK. The chart appears in the document.
|
|
. |
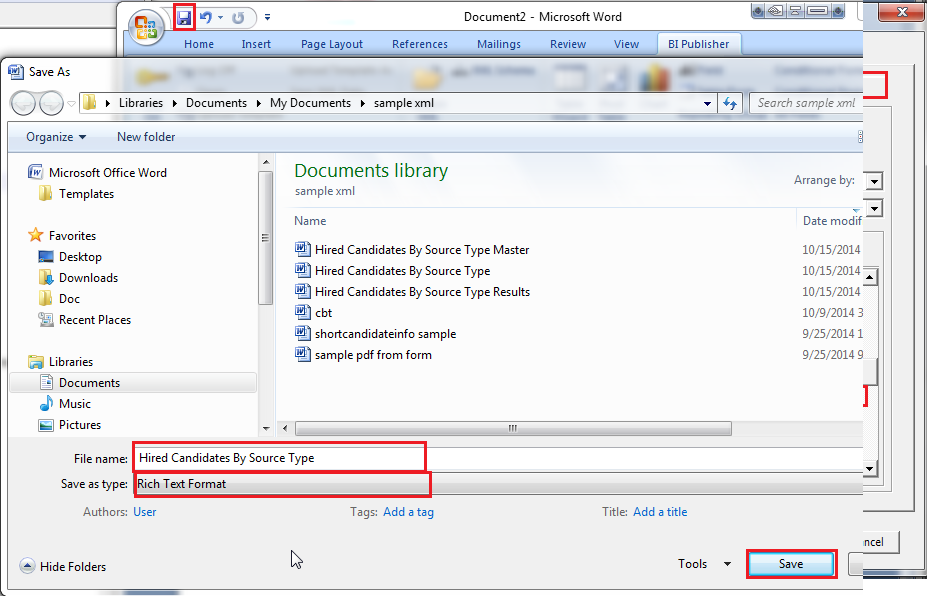
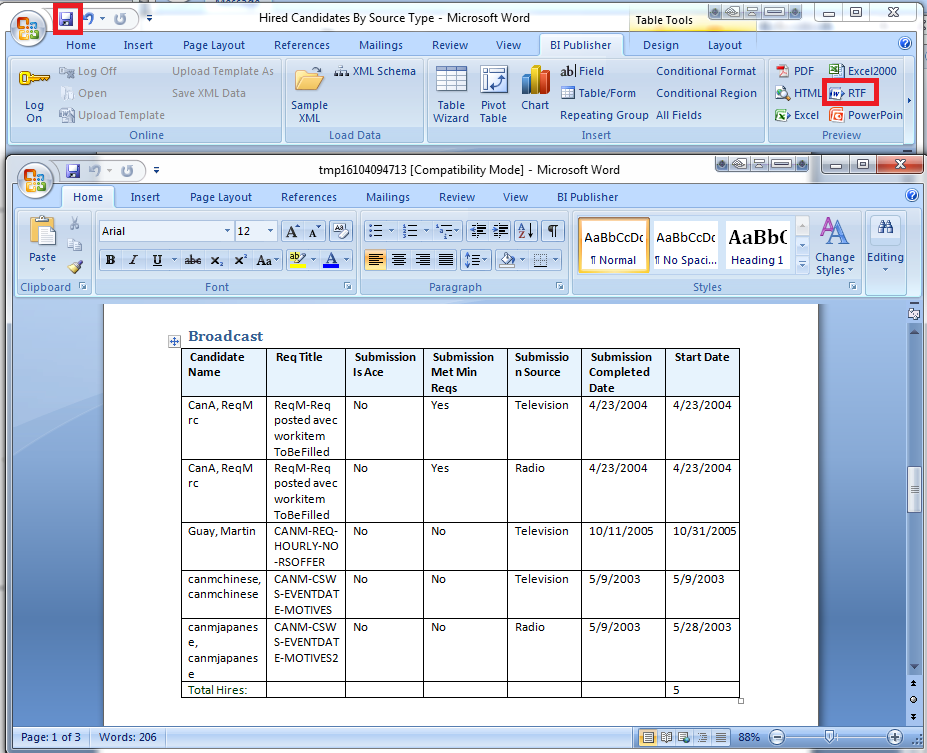
Save the document as "Hired Candidate By Source Type" in Rich Text Format.
|


Adding a Table Into a Template
In this subtopic we will add a table that is grouped by Source Type.
|
. |
Press Ctrl + Enter on your keyboard to create a page break. On the new page, click the Home tab, select the Heading 1 style, center the cursor, and name the page Hired Candidates By Source Type Breakdown.
|
|---|---|
|
. |
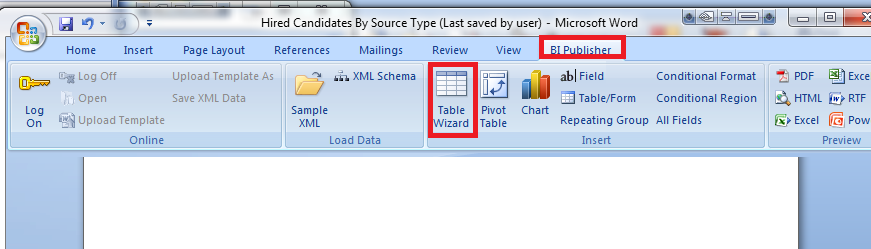
In the BI Publisher tab select the Table Wizard.
|
|
. |
The table wizard appears. Leave the default selection of Table and click Next
|
|
. |
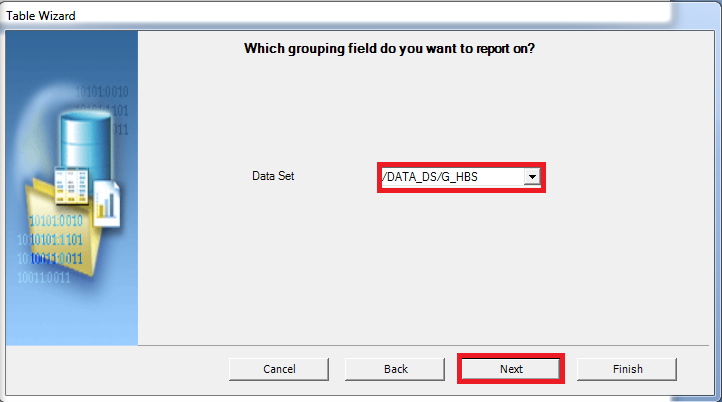
We only created one data set and it is automatically selected. Leave the default data set selected and click Next.
|
|
. |
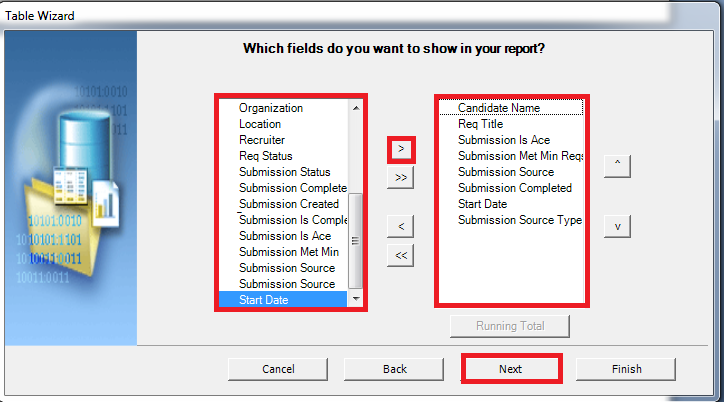
Shuttle the following fields into your report:
Click Next. |
|
. |
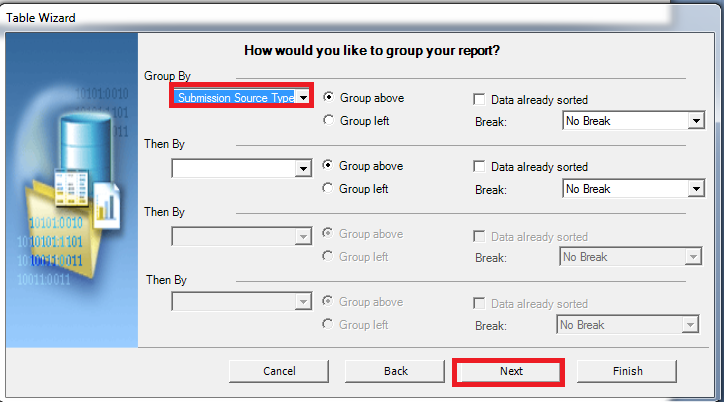
Select Group By Submission Source Type.
Click Next. |
|
. |
Set Sort By Candidate Name.
Click Finish. |
|
. |
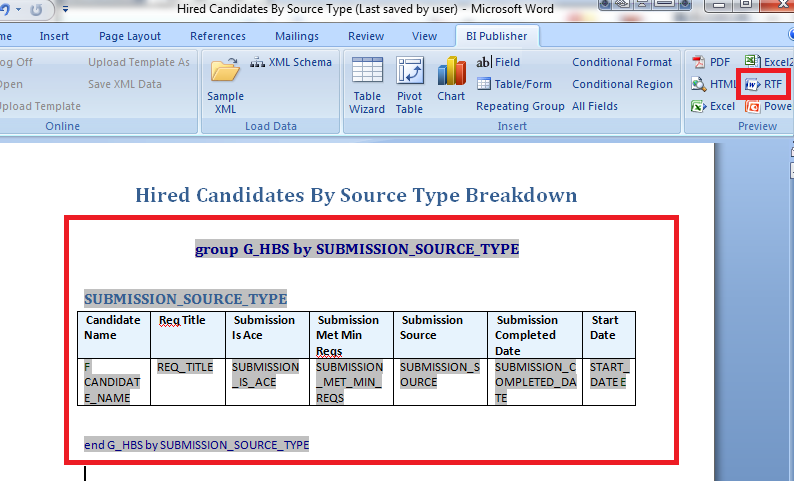
Your table is now in the template. Re-size the columns as appropriate. To preview your report click RTF in the Preview pane.
|
|
. |
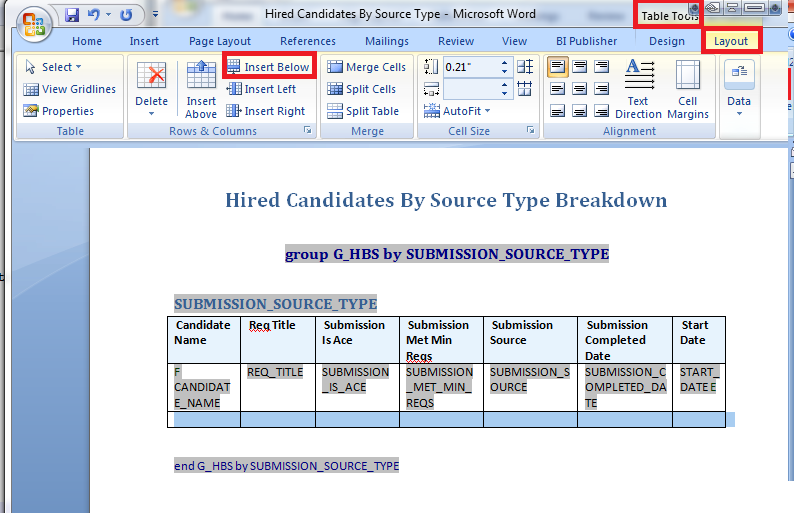
Using the Table Tools - Layout tab, insert a row to the bottom of the table.
|
|
. |
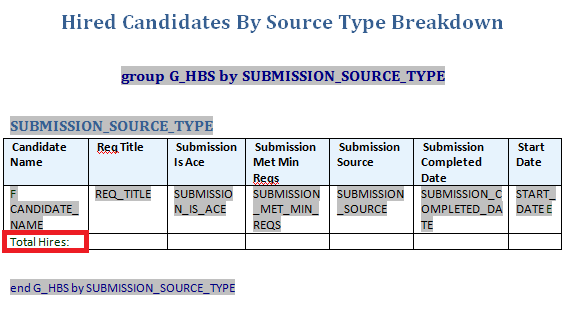
In the first cell add the text Total Hires:.
Bring focus to the last cell in the row and select Field from the BI Publisher Tab.
The field selector displays. |
|
. |
Select the Candidate Id field, the Count calculation, the On Grouping, and click Insert.
Close the field selector. |
|
. |
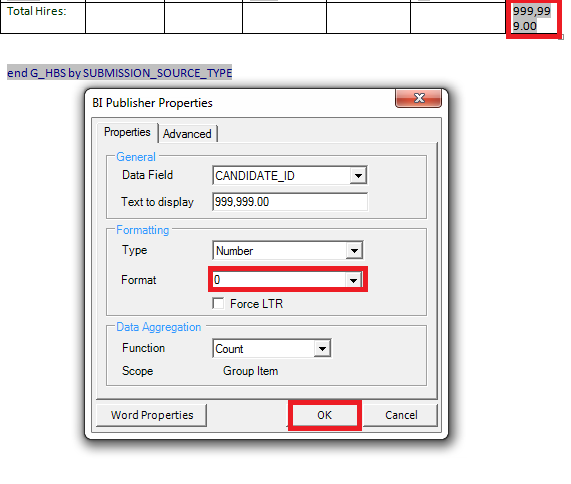
Double click the new numeric field place holder to modify the properties. We want to remove the decimal places on the count by changing the format to 0.
Click OK. |
|
. |
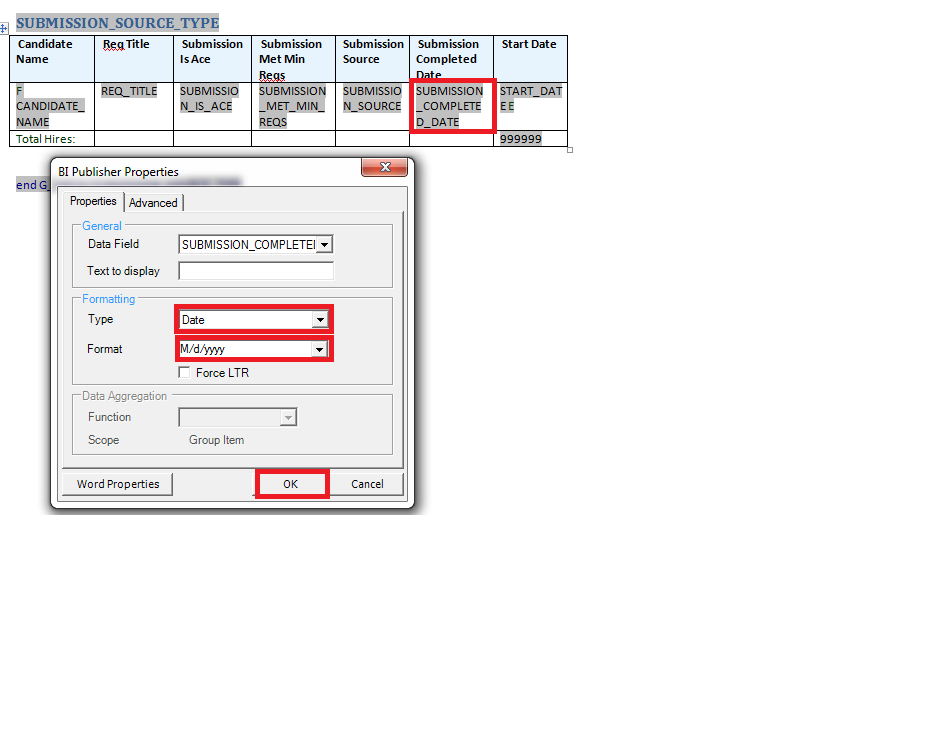
Double click the place holder for Submission Completed Date to Modify the properties. Select Date for the type, M/d/yyyy for the format.
Click OK. Repeat the date formatting with Start Date. Preview the document as an RTF and make any necessary adjustments to the size of the fields, then save the document.
|


Adding Conditional Styling
In this subtopic, you will add conditional styling to fields.
|
. |
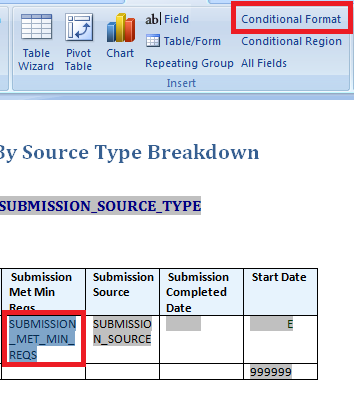
Click the field place holder for Submission_Met_Min_Reqs and click Conditional Format.
|
|---|---|
|
. |
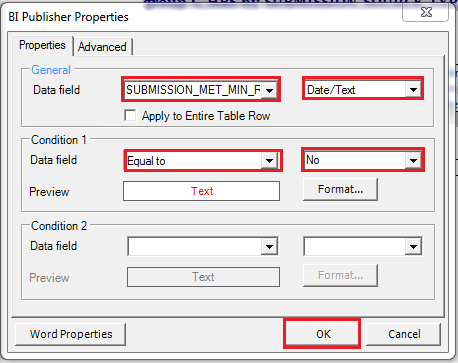
a. Select the Data field SUBMISSION_MET_MIN_REQUIREMENTS. b. Set the data field to Date/Text c. In Condition 1 select the operator Equal to. c. Type in the operand No.
Click OK. |
|
. |
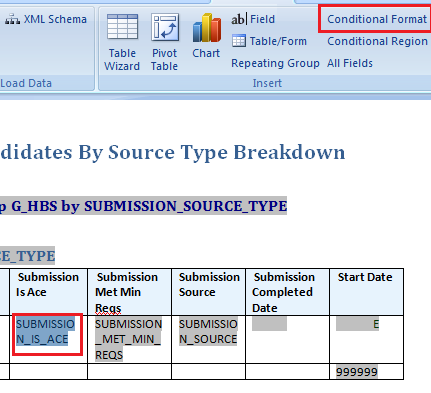
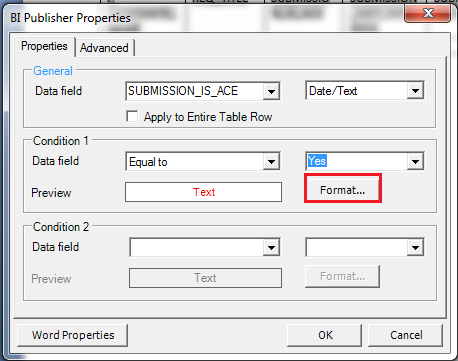
Click the field place holder for Submission_Is_Ace and click Conditional Format.
|
|
. |
a. Select the Data field SUBMISSION_IS_ACE. b. Set the data field to Date/Text. c. In Condition 1 select the operator Equal to. c. Type in the operand Yes.
|
|
. |
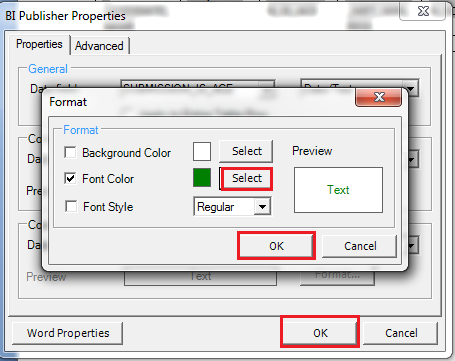
Click Format.
Change the Font Color to Green.
Click OK to leave the format editor. Click OK to leave the condition editor. |
|
. |
Preview the document as an RTF, then save the document. |

Adding a Chart Inside of a Group
|
. |
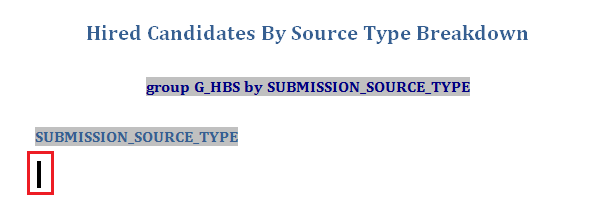
Place your cursor after the field for Submission_Source_Type and return the cursor to the next line.
|
|---|---|
|
. |
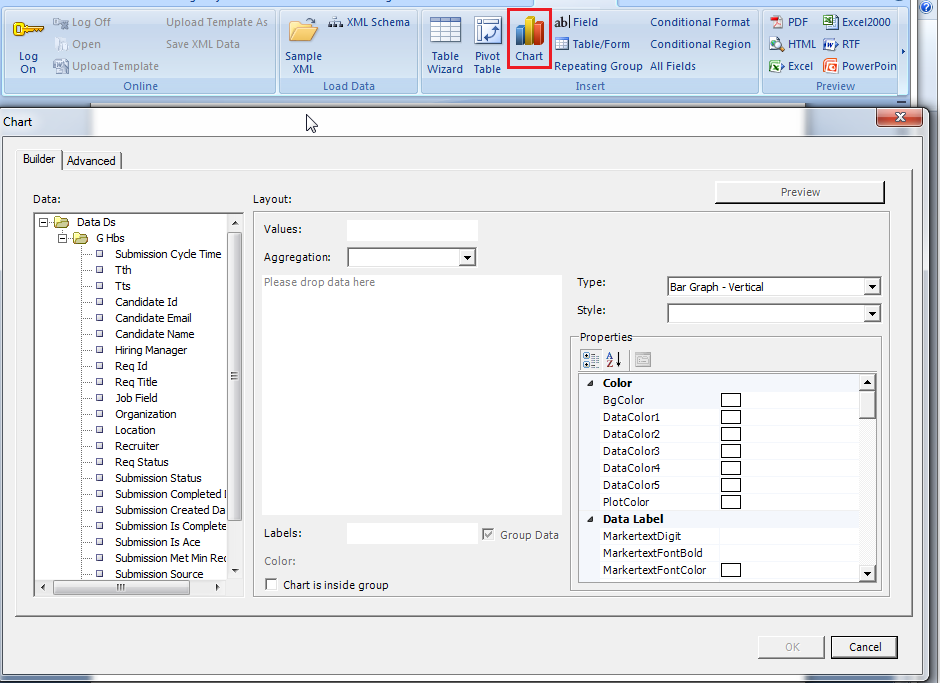
Click Chart.
The chart builder is displayed. |
|
. |
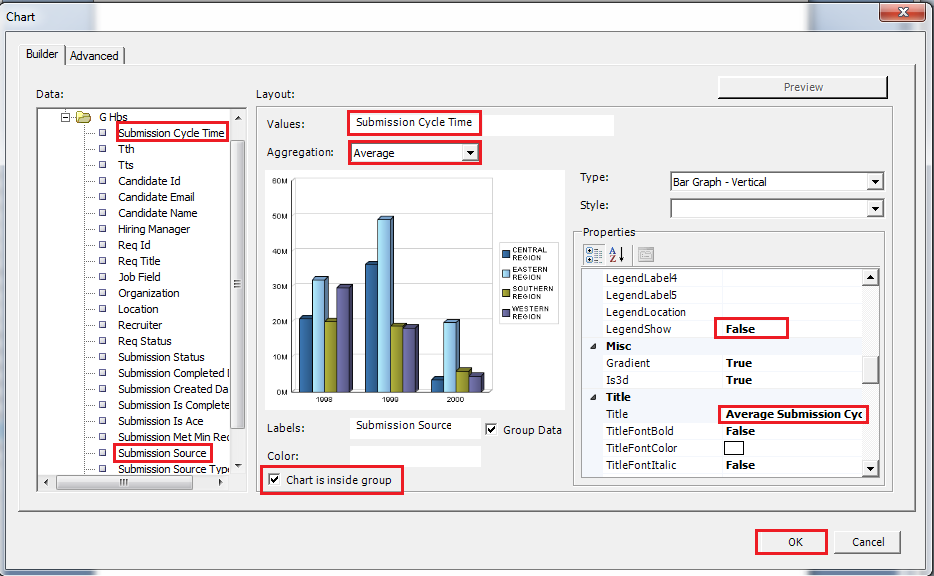
a. Drag and drop Submission Cycle Time into the Values: field. b. Set the aggregation rule to Average. c. Drag and drop Submission Source into the Labels: field. d. In the Properties section, set LegendShow to False. e. In the Properties section, set Title to Average Submission Cycle Time By Source. f. Enable Chart is inside group.
Click OK. |
|
. |
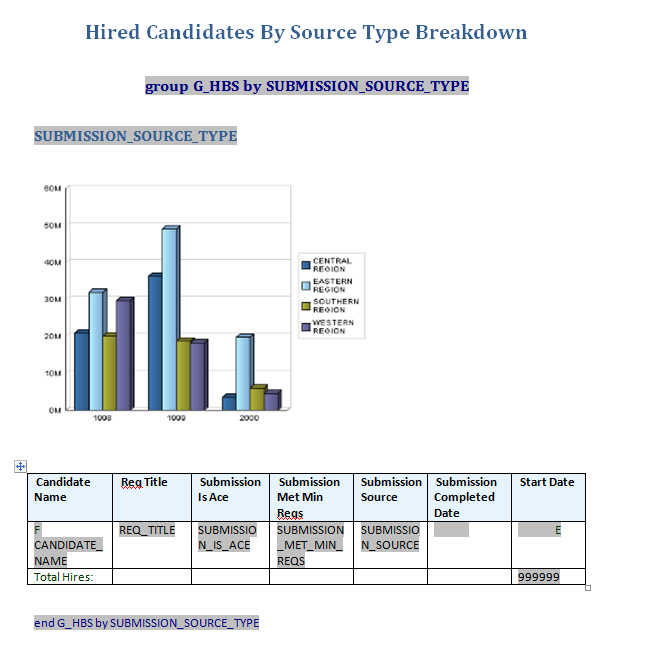
The second page of your template should look like this:
|
|
. |
Preview the document as an RTF and make any necessary adjustments to the size of the fields, then save the document. |
Creating a Narrative
Fields can be added individually. We will use this feature to create a narrative for individual sources as a new group inside of the source type group.
. |
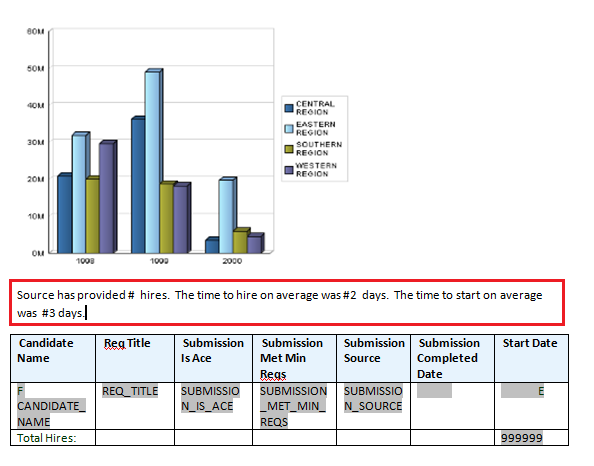
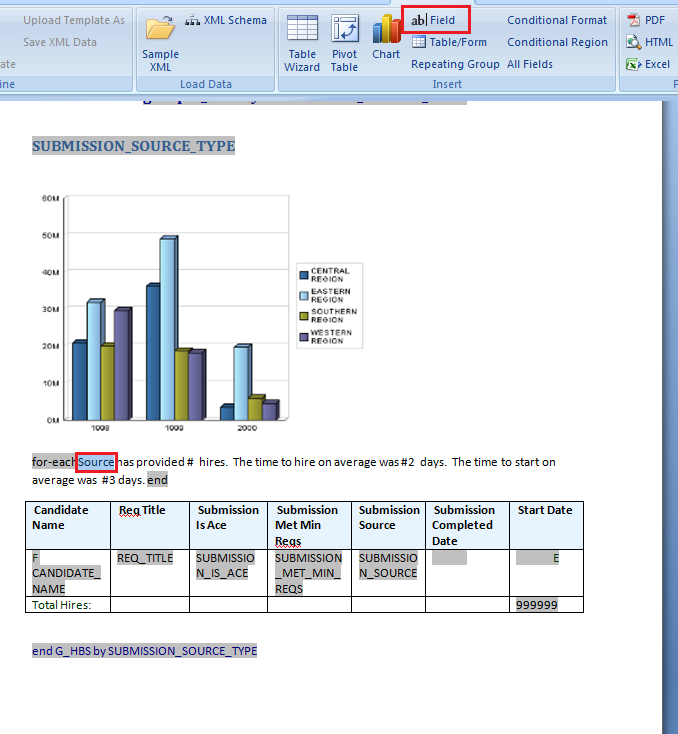
Place the cursor between the chart and the table and enter the following text: Source has provided # hires. The time to hire on average was #2 days. The time to start on average was #3 days.
|
|---|---|
. |
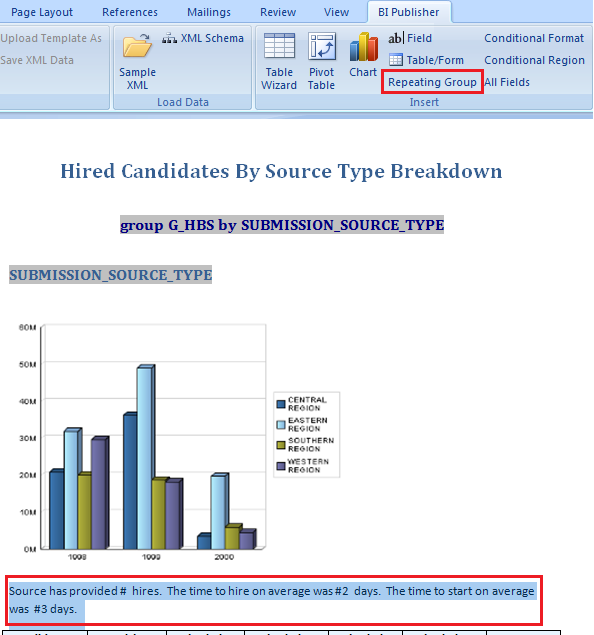
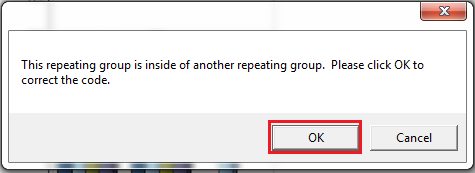
Highlight the narrative text and select Repeating Group.
A message will appear indicating "This repeating group is inside of another repeating group. Please click OK to correct the code." Click OK.
|
. |
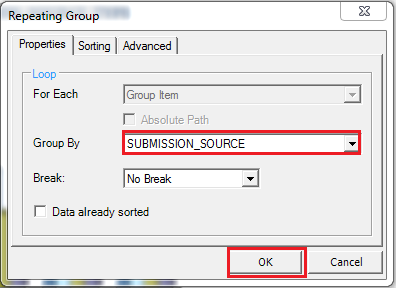
The Repeating Group dialog box appears. Select Group By SUBMISSION_SOURCE under Group By.
Click OK. Another message will appear telling you "This repeating group contains another repeating group which needs to be adjusted to match your changes. Please open this group (double-click the field) and click OK to correct the code." Click OK. No further action is needed to create the sub group. |
. |
a. Highlight Source from the narrative and click Field.
b. Select Submission Source and click Insert.
|
. |
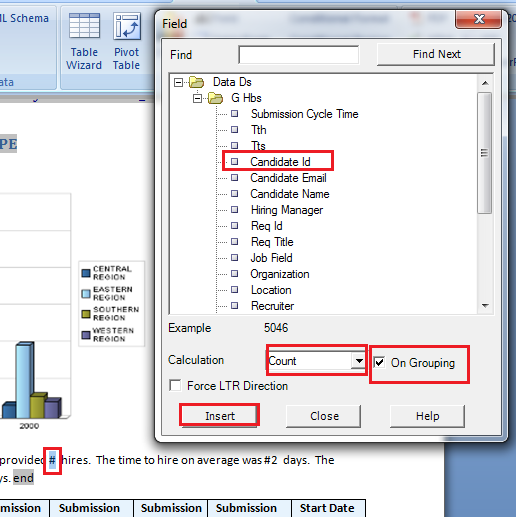
a. Highlight #. b. From the field selector select Candidate Id. c. Set the Calculation to Count. d. Set On Grouping and click Insert.
|
. |
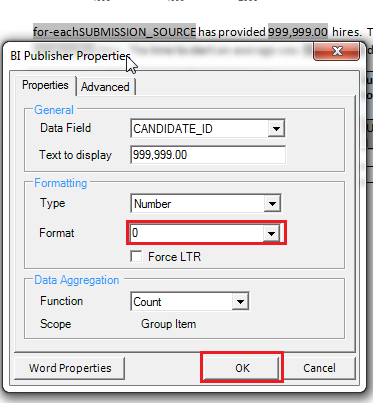
a. Double click 999,999.00 to open up the properties editor. b. Change the Format to 0.
|
. |
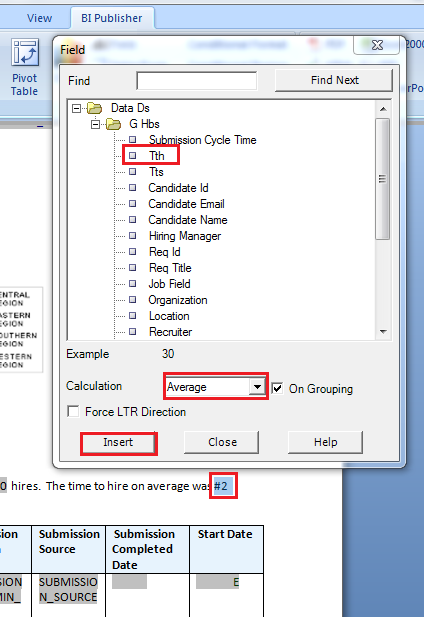
a. Highlight #2. b. From the field selector select Tth. c. Set the Calculation to Average. d. On Grouping is already selected. Click Insert.
|
. |
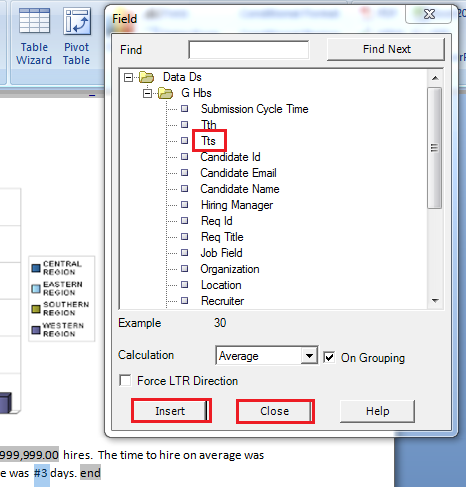
a. Highlight #3. b. From the field selector select Tts. c. The Calculation Average is already selected. d. On Grouping is already selected. Click Insert.
Click Close. |
|
. |
Preview the document as an RTF and make any necessary adjustments to the narrative, then save the document. The template is now complete. |

Creating a Report Definition
Now that we have created the data model and the template we will create a category for our report and enter the report definition so the report can be accessed in Recruiting.
Creating a Report Definition Category
Report Definition Categories are optional. If a category is not specified the report will show up in "Unspecified Category".
. |
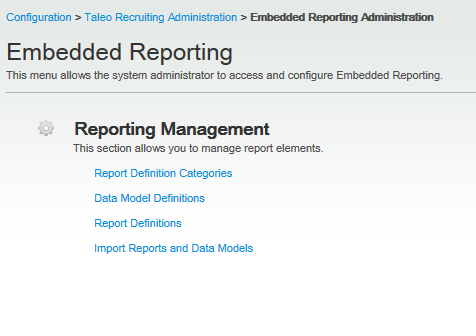
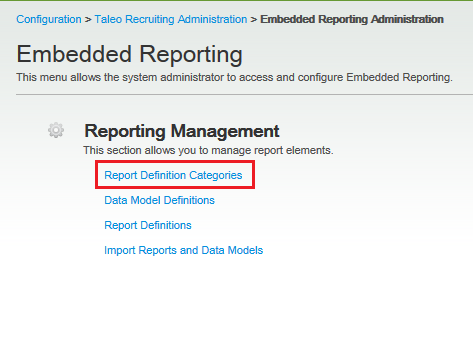
Begin in Embedded Reporting Administration.
|
|---|---|
| . |
Select Report Definition Categories.
|
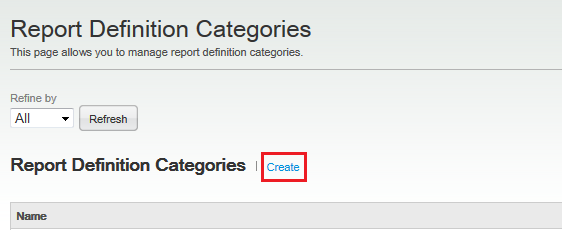
| . |
In the Report Definition Categories list click Create.
|
| . |
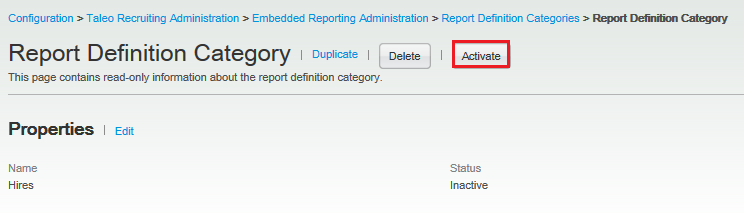
In the Report Definition Category Editor enter the name Hires.
Click Save. |
| . |
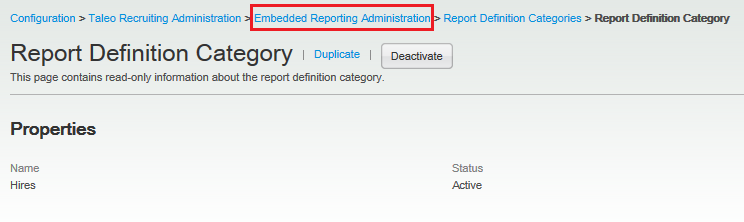
Click Activate to activate the report definition category for use in the report definition.
|
|
. |
Use the breadcrumbs to return to Embedded Reporting Administration.
|
|
. |
Access Data Model Definitions.
|
|
. |
Activate the Hired Candidates by Source Type data model.
Use the breadcrumbs to return to Embedded Reporting. |


Creating a Report Definition
Now that we have a report template, active data model definition and report definition category we are ready to crate a report definition.
. |
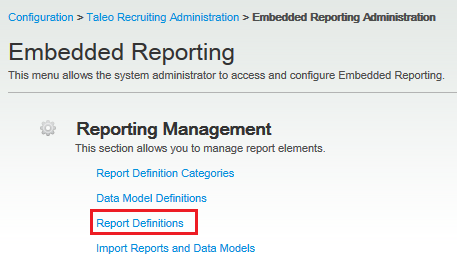
From Embedded Reporting click Report Definitions
|
|---|---|
. |
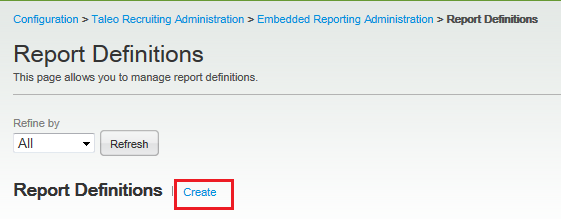
In the Report Definitions list click Create.
|
. |
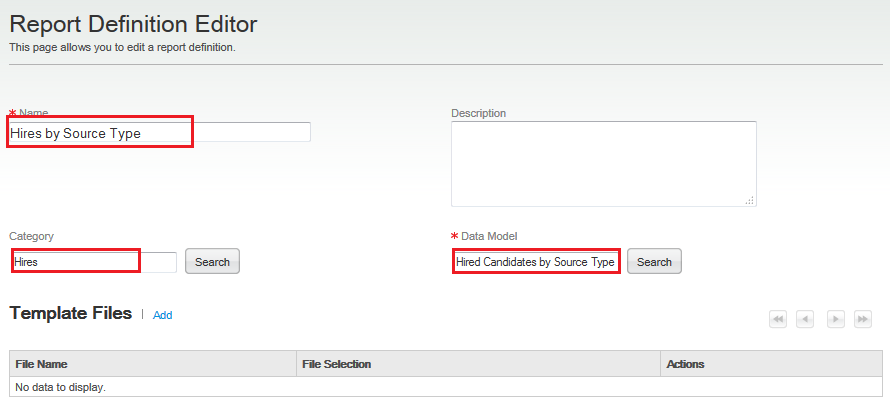
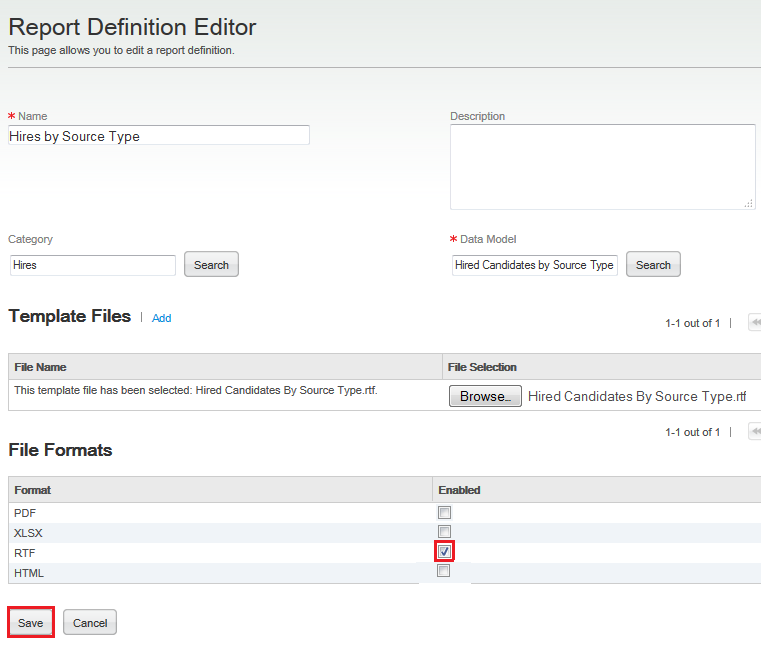
In the Report Definition Editor name the report "Hires By Source Type", add the category Hires, and choose the data model Hired Candidates by Source Type.
|
. |
Click Add to add your template file.
Browse to find the "Hired Candidates By Source Type.rtf" file on your system.
|
. |
Select the RTF file format for your output.
Click Save. |
. |
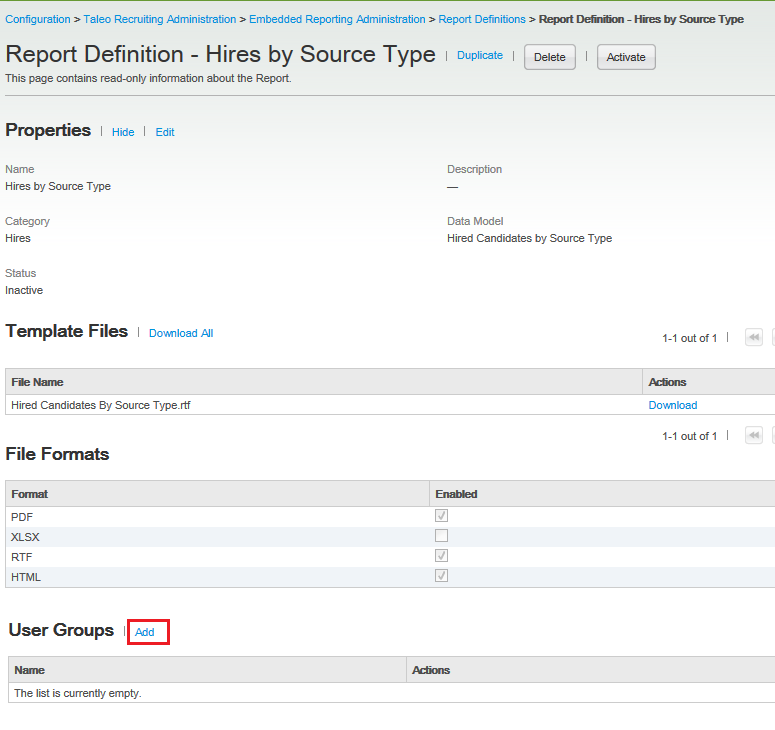
You can add reporting user groups if you want to restrict the viewers of this report. If no user groups are selected, all users with an access to Embedded Reporting will be able to access the report. It is recommended to push this report to a small group of users who can validate the report meets needs before making it widely available.
|
. |
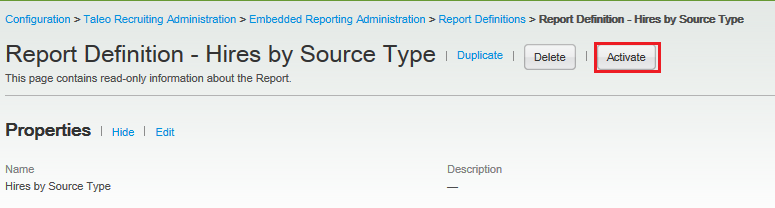
Click Activate to activate the report definition and make it available in the Report section of Recruiting.
|


Summary
This tutorial has covered creating data model definitions, report templates and report definitions in Taleo Recruting.
In this tutorial, you have learned how to:
- Create lists of values, parameters, and data models in the data model definitions.
- Create and customize RTF report templates using the BI Publisher plug-in for MS word.
- Enable report definitions for access inside of Recruiting.
Resources
Credits:
- Product Manager: Rachel Martorelli
![]()
|
|
Copyright © 2013, Oracle and/or its affiliates. All rights reserved |