Before You Begin
Purpose
Learn how to view your application programming interface (API) analytics to understand how and when they're used.
Time to Complete
40 minutes
Background
To properly maintain your APIs, you must understand the demand, usage, failure, trends, and events in your API ecosystem. You do that by checking your API analytics in the Management Portal, which is part of Oracle API Platform Cloud Service.
- On the API Analytics page, you can review the API analytics for requests from specified applications or requests to specified gateways.
- On the Gateway Analytics page, you can browse the analytics for the APIs deployed to your gateway, selecting requests to specified APIs or requests from specified applications.
Note: You can also review the Application Analytics page in the Developer Portal, but this feature is outside the scope of this tutorial.
What Do You Need?
- Access to an Oracle API Platform Cloud Service instance
- A user with Manage API or View All Details API grant access to the API
- A user with Manage Gateway or View All Details gateway grant access to the Gateway
- Completion of the following tutorials to generate a set of analytics data:
- Oracle API Platform Cloud Service: Configuring Rate-Limiting, Header Validation, and Resource-Based Routing Policies
- Oracle API Platform Cloud Service: Configuring Key Validation and Header-Based Routing Policies
Note: The data generated may vary because of the concurrent use of your Oracle API Platform Cloud Service instance and other causes, such as user errors.
Navigating to the API Analytics Page
-
In your browser, enter
http://hostname.domain:8080/apiplatform. -
On the Oracle API Platform Cloud Management Portal login page, enter your user name and password, and click Sign In.
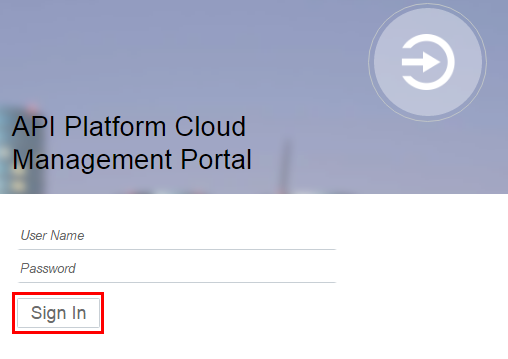
Description of this image -
On the APIs List page, click Energy.
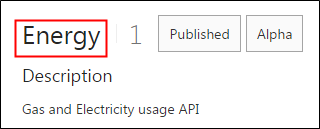
Description of this image -
On the API Implementation page, click the Analytics tab
 .
.The Analytics page opens.
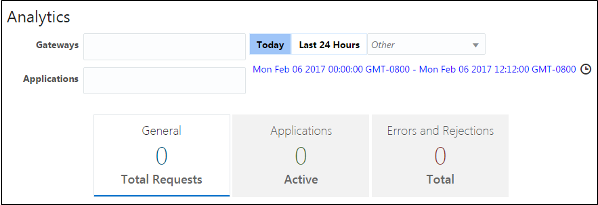
Description of this image
Navigating to the Gateway Analytics Page
-
In your browser, enter
http://hostname.domain:8080/apiplatform. -
On the Oracle API Platform Cloud Management Portal login page, enter your user name and password, and click Sign In.
-
On the Management Portal page, click Gateways.
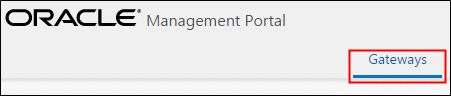
Description of this image -
On the Gateways page, click a gateway.
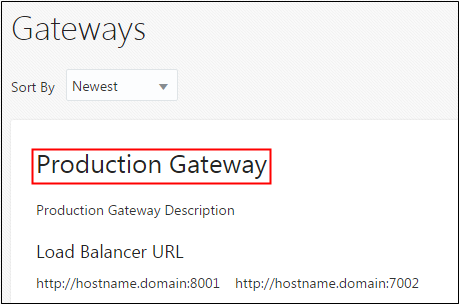
Description of this image -
On the Gateway Details page, click the Analytics tab
.The gateway Analytics page opens.
Description of this image
Exploring General Analytics
The general analytics page shows charts for all requests. You can filter data by gateway, registered application, period of time, and request status (rejected, failed, or successful).
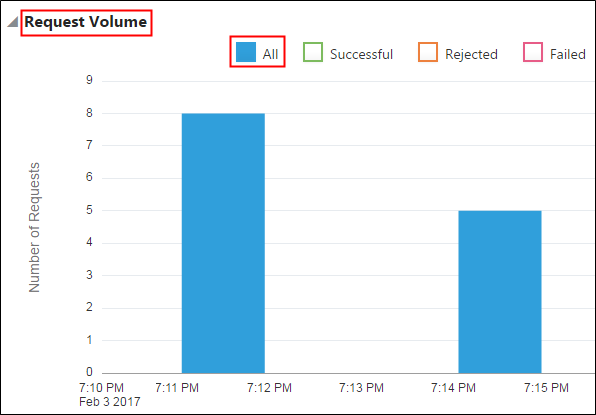
Reviewing the Request Volume Chart
This chart displays the number of requests of a deployed API in a gateway. You can filter the data by all requests or by successful, rejected, or failed requests.
-
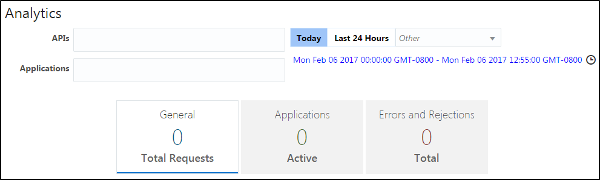
Click General to view all requests in the charts.
Description of this image -
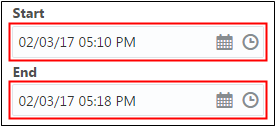
Click the Click to customize time interval link.
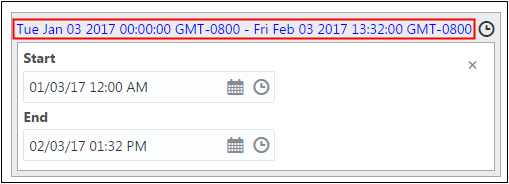
Description of this image The Start and End fields are displayed.
-
Click Start and select the start date and time, click End and select the end date and time.
Description of this image -
To filter your data, perform one of the following actions:
-
On the API Analytics page, click Gateways and select Production Gateway.
Description of this image -
On the Gateway Analytics page, click API and select Energy.
Description of this image
-
-
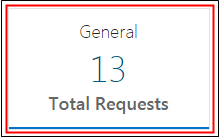
Scroll down to the Request Volume chart, click All, and review the requests for your API.
Description of this image -
Click Successful and review the successful requests for your API.
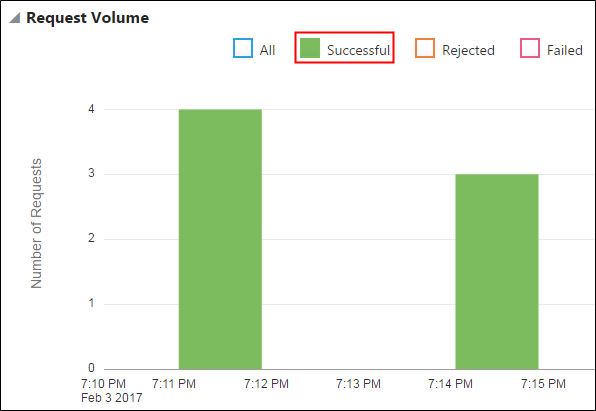
Description of this image -
Click Rejected and review the rejected requests.
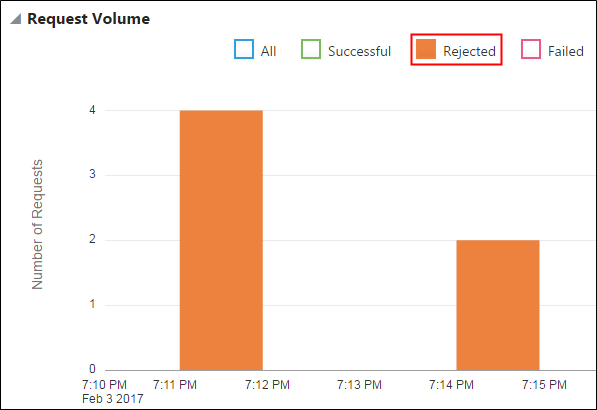
Description of this image -
Click Failed and review the failed requests.
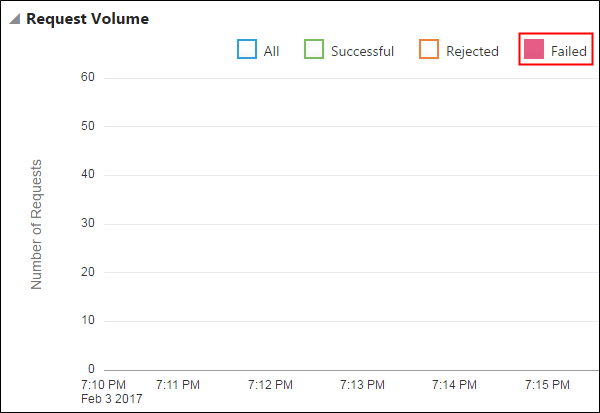
Description of this image
Reviewing the Response Time Chart
This chart displays the time ranges of requests and responses for your API.
-
Scroll down to the Response Time chart and click Round Trip.
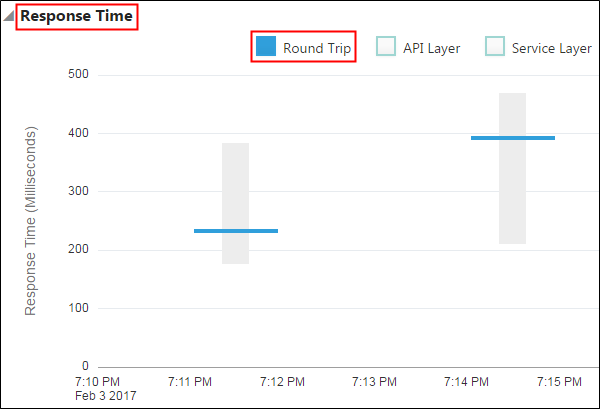
Description of this image -
Place your cursor over the response range bar and review the response times displayed in the round-trip details box.
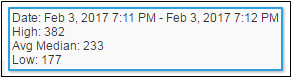
Description of this image -
Click API Layer. Review the chart that displays the bars corresponding to the time ranges spent per request in the API layer.
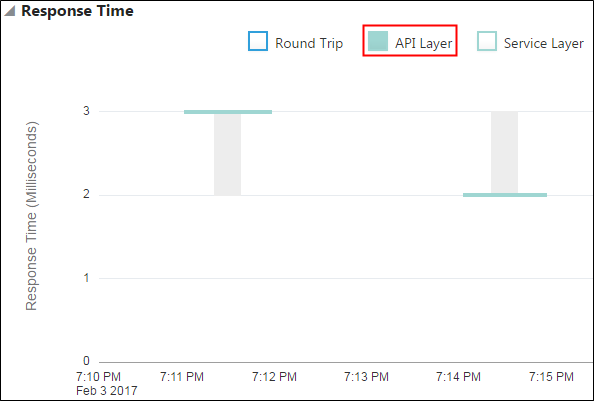
Description of this image -
Click Service Layer. Review the chart that displays the bars corresponding to the time ranges spent per request in the service layer.
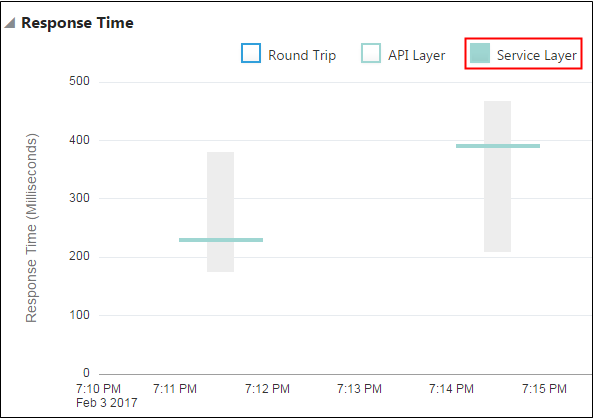
Description of this image
Reviewing the Payload Size Chart
This chart displays the size of requests and responses made to your deployed API. You can filter the data by request or by response payloads.
Scroll down to the Payload Size chart and click Request.
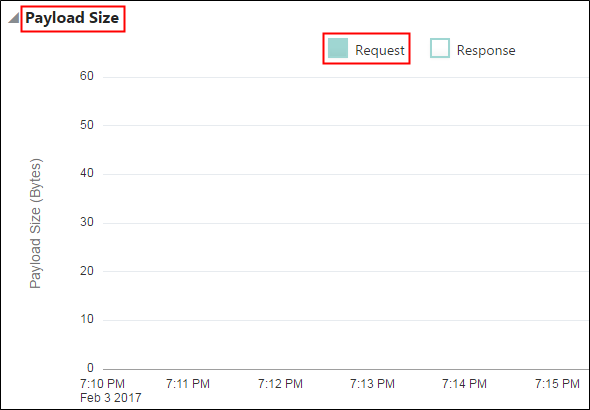
Note: In this tutorial, the requests in the chart don't have payloads. Keep in mind that requests with payloads do exist.
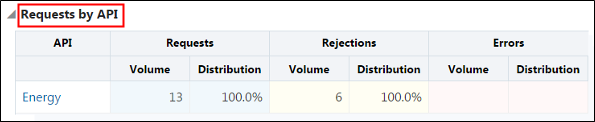
Reviewing the Requests by API Chart
This chart, which is exclusive to gateway analytics, displays the distribution of your API requests.
Scroll down to the Requests by API chart and review the information in the API, Requests, Rejections, and Errors columns.
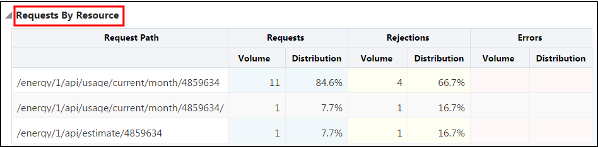
Reviewing the Requests by Resource Chart
This chart displays the distribution of your requests by request path.
Scroll down to the Requests by Resource chart and review the information in the Request Path, Requests, Rejections, and Errors columns.
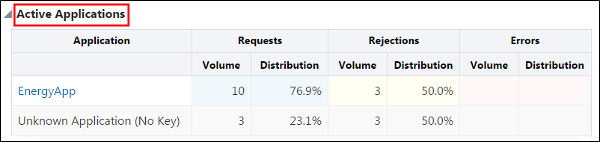
Exploring Application Analytics
This chart shows the requests for each registered application.
-
Click Applications to review the requests in the charts.
Description of this image -
Scroll down to the Active Applications chart and review the information in the Application, Requests, Rejections, and Errors columns.
Description of this image
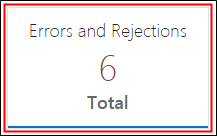
Exploring the Errors and Rejections Analytics
These charts show the failed and rejected requests.
Applying Errors and Rejections Chart Filters
Use these filters for all charts:
- All: View all requests.
- Request Policies: View the failed or rejected requests from the request flow.
- Response Policies: View the failed or rejected requests from the response flow.
- Service: View the failed or rejected requests at the back end.
Use one of the following filters for the Rejection Rate and Error Rate charts:
- No policy filter: View all the requests.
- Show Policy Instances: View the errors or rejections from each instance of a policy. For example, if errors or rejections are generated from multiple header validation policies, then all header validation policy errors or rejections are displayed as a single data point.
- Show Policy Types: View the errors or rejections for each policy type. For example, if errors or rejections are generated from multiple header validation policies, all header validation policy errors are displayed as separate data points.
- Built-in Policy Types: View the failed or rejected requests by OAuth2Validator, SLAEnforcement, or Sender policies.
You can use the Show Policy Instances and Show Policy Types filters only for the Rejection Distribution and the Error Distribution charts.
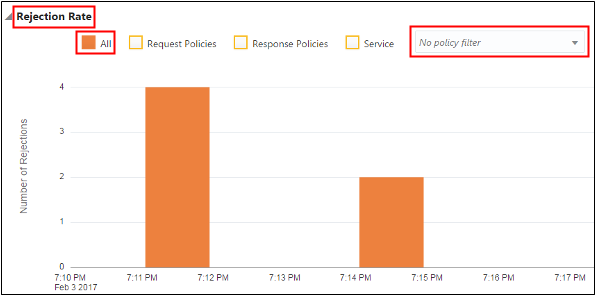
Reviewing the Rejection Rate Chart
This chart displays the frequency of the rejected requests through time.
-
Click Errors and Rejections.
Description of this image -
Scroll down to the Rejection Rate chart, click All, and select No policy filter. Review the chart contents.
Description of this image -
In the policy filter list, under Policy Instances, select API Rate Limiting.
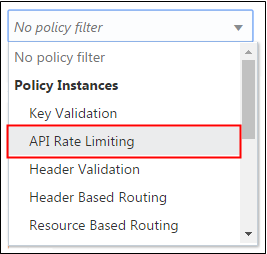
Description of this image The chart displays only the requests that were rejected by the API Rate Limiting policy.
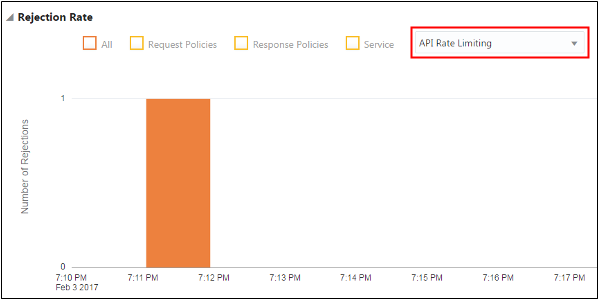
Description of this image -
In the policy filter list, under Policy Types, select Header Validation.
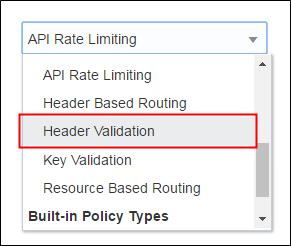
Description of this image The chart displays only the requests that were rejected by the Header Validation policy.
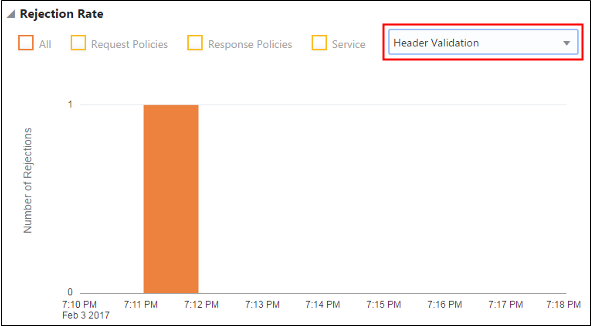
Description of this image
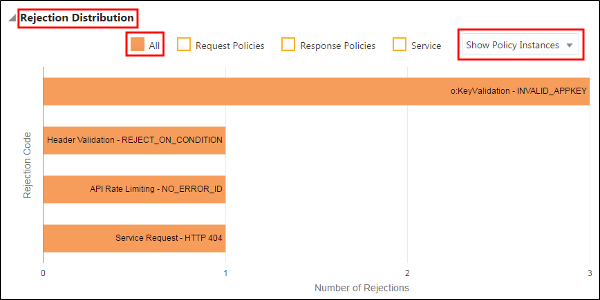
Reviewing the Rejection Distribution Chart
This chart displays the rejections for your API requests, classified by policy types or policy instances.
-
Scroll down to the Rejection Distribution chart, click All, and select Show Policy Instances from the policy filter list.
Description of this image -
Select Show Policy Types.
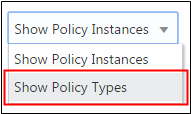
Description of this image -
Review how the same rejections are plotted in the four bars, one for each policy type.
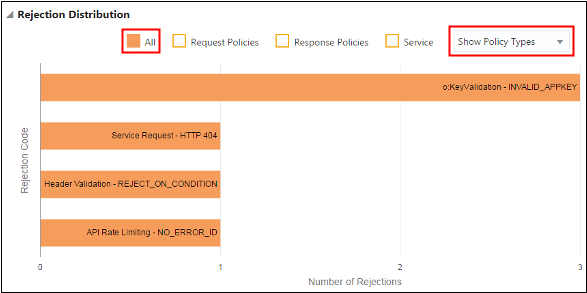
Description of this image
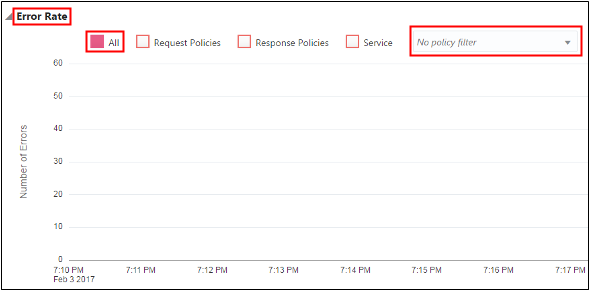
Reviewing the Error Rate Chart
This chart displays the frequency of the failed requests.
Scroll down to the Error Rate chart, click All, and select No Policy from policy filter list.
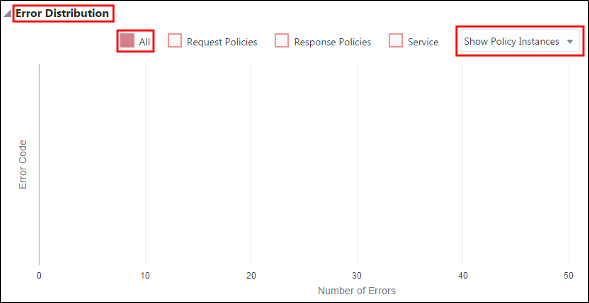
Reviewing the Error Distribution Chart
This chart displays the number of errors for your API requests, classified by policy types or policy instances.
Scroll down to the Error Distribution chart, click All, and select Show Policy Instances from the policy filter list.
Want to Learn More?
Manage APIs in the Oracle Help Center
Manage Gateways in the Oracle Help Center