Using SQL Developer For General Tuning
Overview
Purpose
This tutorial covers using Oracle SQL Developer to to diagnose and tune a performance problem in a DBaaS environment.
Time to Complete
Approximately 70 minutes
Introduction
In this tutorial you will navigate several sections of SQL Developer Performance section. You will
- Configure the DBaaS database instance to display a performance problem with a small workload
- Navigate the SQL Developer Performance menu, while a workload is running
- Tune the database configuration for an application workload
Prerequisites
Before starting this tutorial, you should:
- Have access to a Oracle Database Cloud (DBaaS) instance.
- Have created the DEMOS PDB, as part of the instance creation wizard. The DEMOS PDB contains the Oracle Sample Schemas, in particular the OE schema that will be used in this example.
- Download the usingsqldev.zip file that contains the workload simulations to your local machine, then transfer it to the DBaaS instance using scp. Unzip it into the /home/oracle directory.
- Download and Install SQL Developer from Oracle Technology Network>...>SQL Developer. NOTE: SQL Developer 4.1 is shown in this tutorial.
Suggested Prerequisites
Before starting this tutorial it may be helpful to have followed the Signing Up for a Database Cloud Service, Connecting to a Database Cloud Service (DBaaS) Instance Through an SSH Tunnel and Creating a Database Cloud Service (DBaaS) Instance tutorials.
Topic 1 Setup the Environment
-
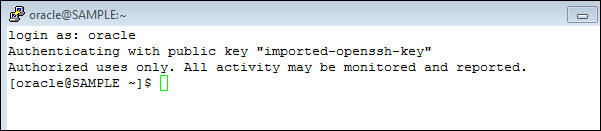
Login as the oracle OS user in your terminal to the DBaaS instance.The name of this DBaaS instance is SAMPLE. Yours will be different.
- Start SQL*Plus as the sys user, the sys password connect 'AS SYSDBA' Note: the sys user password is set when you create the DBaaS instance, as the administration password. This password is the one set for users SYS, SYSTEM, and DBAAS_MONITOR. sqlplus sys/
-
This DBaaS instance should be expendable. For this practice the archive logging and flashback database is turned off. That means if there is a failure that would require a point in time recovery the instance will need to be deleted and another one created. It is assumed that backup for the database is NOT being done. Note: in the following commands the database SID is assumed to be ORCL. If your database SID is something else substitute your database SID for ORCL in the commands. In SQL*Plus execute the following commands:
SHUTDOWN IMMEDIATE; - Change directory to the /home/oracle/workload directory:
cd $HOME/workload
$ cd $HOME/workload $
- Start the workload:
./start_workload.sh 2 DEMOS <administration_password>
Note: this command starts a workload in the background that runs until the runload file is removed.
- When the prompt returns, create an AWR Snapshot to force an ADDM report. Run the script $HOME/workshops/snapshots.sh
$ sqlplus / as sysdba

SQL*Plus: Release 12.1.0.2.0 Production on Tue Apr 7 14:15:13 2015

Copyright (c) 1982, 2014, Oracle.  All rights reserved.


Connected to:
Oracle Database 12c Enterprise Edition Release 12.1.0.2.0 - 64bit Production
With the Partitioning, Oracle Label Security, OLAP, Advanced Analytics
and Real Application Testing options
CREATE PFILE='pfileORCL.bak' FROM SPFILE='spfileORCL.ora';
CREATE SPFILE='spfileORCL.ora' FROM PFILE='$HOME/workload/pfile_safe.ora';
STARTUP MOUNT;
ALTER DATABASE FLASHBACK OFF;
ALTER DATABASE NOARCHIVELOG;
ALTER DATABASE OPEN;
EXIT;
SQL> SHUTDOWN IMMEDIATE;
Database closed.
Database dismounted.
ORACLE instance shut down.
SQL> CREATE SPFILE='spfileORCL.ora' FROM PFILE='$HOME/workload/pfile_safe.ora';

File created.

SQL> STARTUP MOUNT;
ORACLE instance started.

Total System Global Area 3221225472 bytes
Fixed Size                  2929552 bytes
Variable Size            3087010928 bytes
Database Buffers          117440512 bytes
Redo Buffers               13844480 bytes
Database mounted.

SQL> ALTER DATABASE FLASHBACK OFF;

Database altered.

SQL> ALTER DATABASE NOARCHIVELOG;

Database altered.

SQL> ALTER DATABASE OPEN;

Database altered.

SQL> EXIT;
Disconnected from Oracle Database 12c Enterprise Edition Release 12.1.0.2.0 - 64bit Production
With the Partitioning, OLAP, Advanced Analytics and Real Application Testing options
$ ./start_workload.sh 2 DEMOS XXXXXXXX

SQL*Plus: Release 12.1.0.2.0 Production on Tue Apr 7 14:36:41 2015

Copyright (c) 1982, 2014, Oracle.  All rights reserved.

SQL> Connected.
SQL>
Grant succeeded.

SQL>
User altered.


User altered.


User altered.

SQL> Disconnected from Oracle Database 12c Enterprise Edition Release 12.1.0.2.0 - 64bit Production
With the Partitioning, OLAP, Advanced Analytics and Real Application Testing options

SQL*Plus: Release 12.1.0.2.0 Production on Tue Apr 7 14:36:42 2015

Copyright (c) 1982, 2014, Oracle.  All rights reserved.

SQL> Connected.
SQL>
Sequence dropped.


PL/SQL procedure successfully completed.


Table altered.


Table altered.


Table altered.


Procedure created.

Disconnected from Oracle Database 12c Enterprise Edition Release 12.1.0.2.0 - 64bit Production
With the Partitioning, OLAP, Advanced Analytics and Real Application Testing options
$ $HOME/workshops/snapshots.sh
PL/SQL procedure successfully completed.
Topic 2 Accessing DBaaS with SQL Developer
To use the SQL Developer performance monitoring and tuning features you will have to create a SQL Net connection and a DBA connection. Then you can navigate to the various Performance sections. This section shows you how to create an SSH tunnel to port 1521 on the DBaaS instance using SSH tunneling in SQL Developer.
Create a SQL Net Connection to the DBaaS Database Instance
-
Start SQL Developer on your local machine.
- Navigate to the SSH Hosts pane. NOTE:
this is a new feature in SQL Developer 4.1.
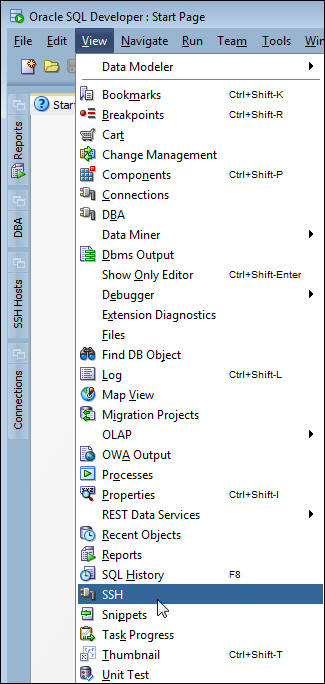
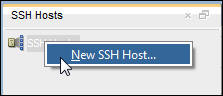
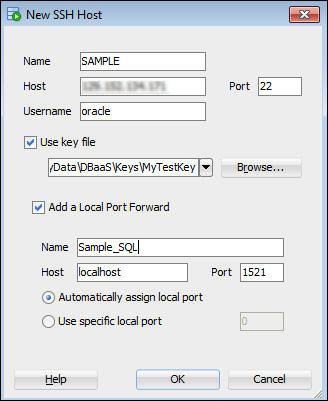
- In the SSH Hosts pane, right-click SSH Hosts and then
click New SSH Host to create a New Host.
- In the New SSH Host dialog enter:
- Name: < the DBaaS instance name is suggested>
- Host: < the public IP address of your DBaaS instance>
- Username: Instance login name: oracle
- Check Use key file
- provide an ssh file
- Check Add a Local Port Forward
- Provide a name
- Host is localhost
- Allow port to default
- Select Automatically assign local port Click OK
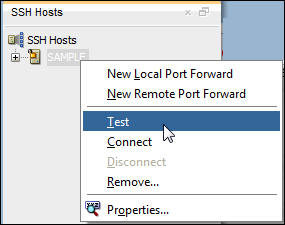
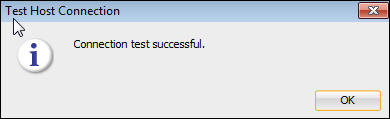
- Test the SSH Host connection.
- Click OK in the Confirmation message box.
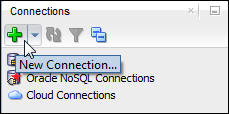
- Navigate to the Connections navigator pane.
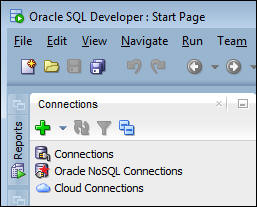
- Create a new connection by clicking the green plus icon.
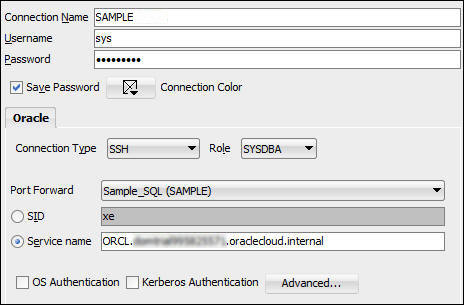
- Complete the Connection properties dialog for your DBaaS database instance.
- Name the connection: SAMPLE
- Enter a User with DBA privileges: SYS
- Enter the Administration password: xxxxxx
- Check Save Password
- Set Connection type to SSH
- Set Role to SYSDBA
- In the Port Forward field, Select the Name of the Local Port Forward you created in step 4.
- Select Service name and enter the connection string for the Database instance. Use <SID>.<domain_name> .
- Test and if successful Save and Connect.
- The Test must be successful, before you can proceed.
Create a DBA Connection to the DBaaS Database Instance
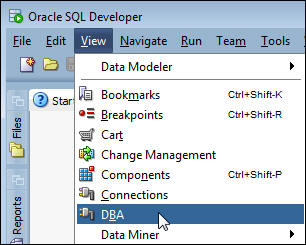
- Open the DBA navigation pane. Click View>DBA.
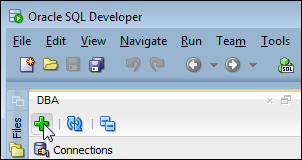
- In the DBA navigation pane, click the Create icon (green plus sign).
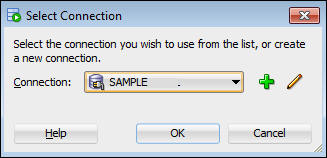
- In the Select Connection dialog, Select the DBaaS database connection you named previously, and then click OK.
- Expand the connection in the DBA navigation pane.
Topic 3 Navigating SQL Developer
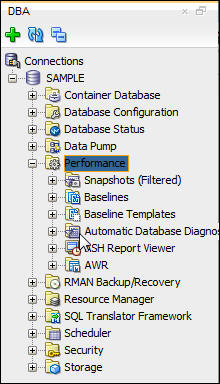
The SQL Developer Performance features are collected under the Performance header in the DBA navigation pane. Though there are other areas such as Database Configuration that affect the database performance and are used to collect diagnostic information.
View Snapshot History and Create a Snapshot
Snapshots are automatically taken every 60 minutes by default. A snapshot contains a set of diagnostic information at a point in time these are collections of database internal statistics: such as wait counts, metrics, I/O requests, transactions, SQL statements, and others. These statistics taken at a single point in time mean very little by themselves, but when two snapshots are compared taking the difference between the points in time the difference in the statistics provide information about the workload, bottlenecks, and the health of the database instance.- Expand the Performance header in the DBA navigation pane.
-
If this is the first time to select the Performance heading for this connection, Diagnostic Pack Required dialog appears. This is a warning that the items in this menu require a license for the use of these feature. Note: the DBaaS High Performance and Extreme Performance subscriptions include a Diagnostic Pack license. Click OK.
- The Performance heading expands.
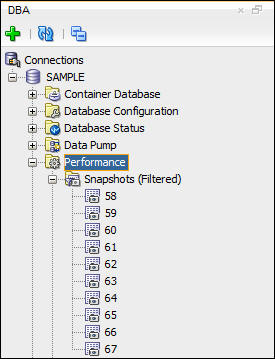
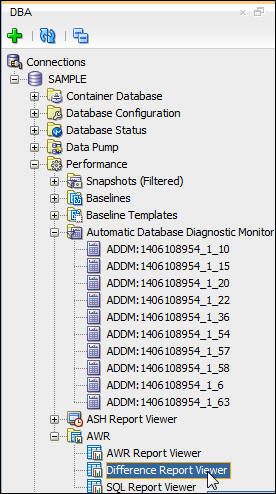
- Expand Snapshots. The 10 most recent snapshots are shown.
- Select Snapshots. A snapshots pane appears in
worksheet area of the SQL Developer window list the
snapshots and set of properties.These properties display the
Snapshot ID, capture time, and whether Automatic Database
Diagnostics Monitor (ADDM) had any finding based on this
snapshot and the previous one.
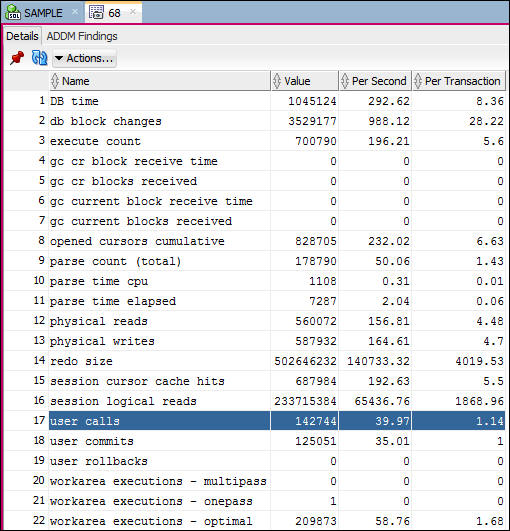
- Double click the ID of a Snapshot where ADDM Findings is YES. The window will display the Details of the Snapshot.The Details shows a set of metrics calculated between this snapshot and the previous one. For example: User calls shows 39.97 calls per second.
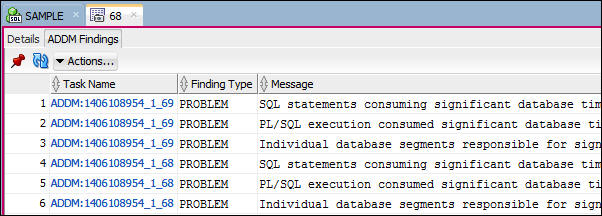
- Every snapshot triggers a execution ADDM over the last two snapshots. If there are findings they are listed with the beginning and ending snapshot. If an ADDM task produces multiple findings, the task will be listed multiple times. Click the ADDM Findings tab. In the example: notice that snapshot 68 was either the beginning or ending snapshot for two ADDM tasks each of which had three findings.
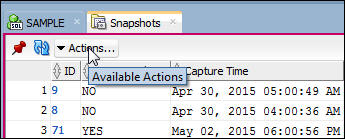
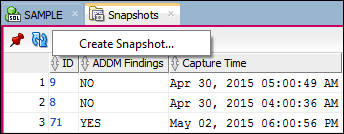
- In the DBA navigation pane, click Snapshots. then in the Snapshots tab in the Worksheet area, click the Actions pulldown.
- Select Create Snapshot.
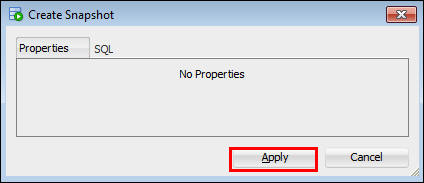
- Click Apply in the Create Snapshot dialog.
- Click OK in the Successful dialog.
View and Generate ADDM Reports
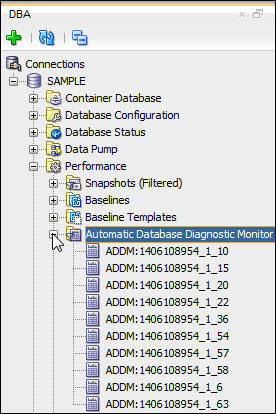
The Automatic Database Diagnostic Monitor heading in the Performance section of the DBA navigation menu allows you view ADDM reports, and generate ADDM reports over any two snapshots that do not include a shutdown between them. ADDM reports over longer periods will reduce the impact percent of performance problems of short duration, and increase the impact percent of systemic and long term problems.- Expand the Automatic Database Diagnostic Monitor heading in the Performance section of the DBA navigation menu. notice that a subset of the ADDM tasks are shown.
- Click the Automatic Database Diagnostic Monitor heading. A
listing of the ADDM tasks appear in the worksheet area of
SQL Developer.
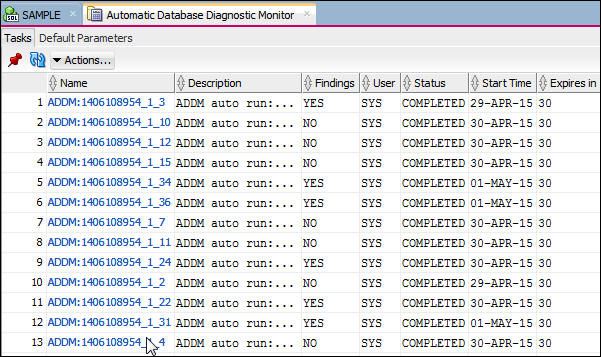
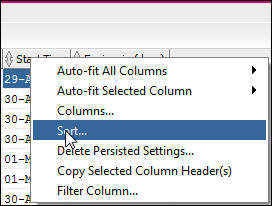
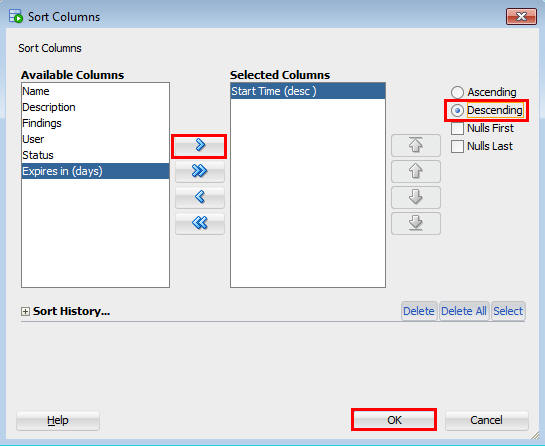
- In the list of ADDM tasks shown, right click the Start
Time column, select Sort.
- In the dialog, move Start_Time into the right hand pane,
select descending and click OK.
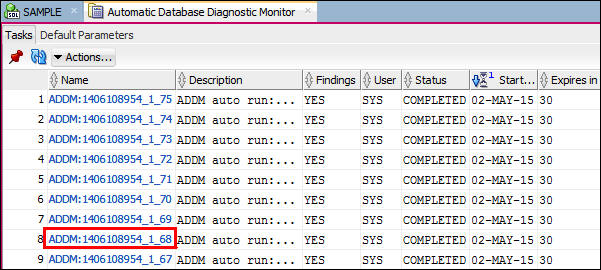
- In the sorted ADDM listing, select an ADDM task where
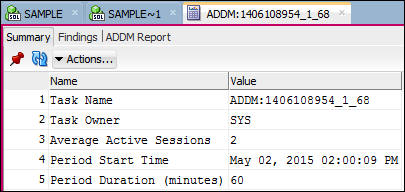
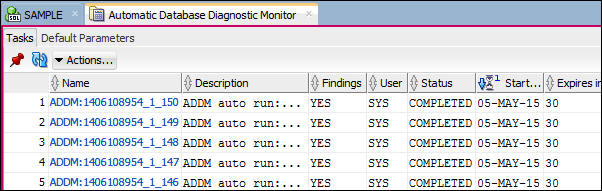
there are Findings. Double click the Name link.
- The Summary information of the ADDM task is shown.
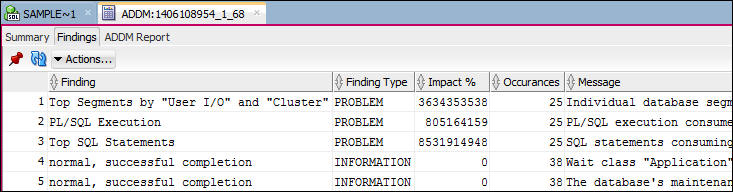
- Click the Findings tab. The finding are displayed. Notice
that the Informational findings are included here.
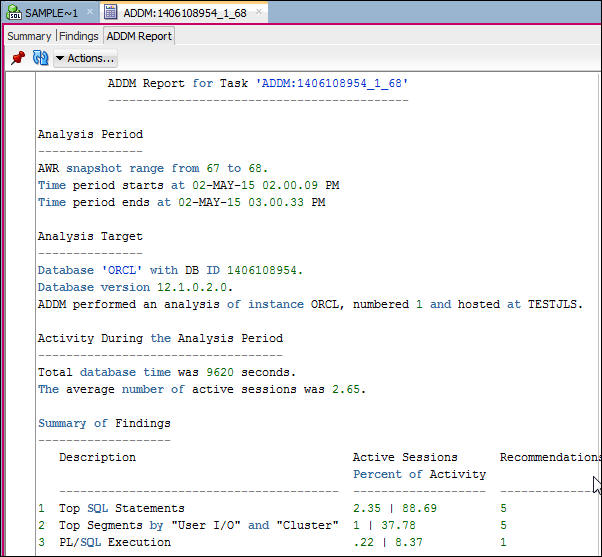
- Click the ADDM Report tab. This displays the ADDM report
in text format. You can scroll down to see the entire
report, which includes details of the findings,
recommendations, and rationales.
Generate and View Automatic Workload Repository Reports
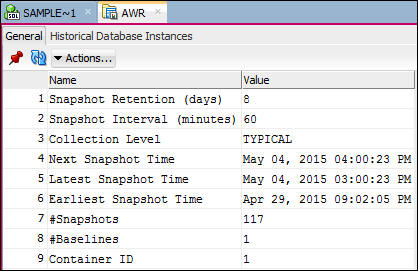
In this section, you will generate and view Automatic workload Repository (AWR) Reports over a single period, and compare two periods. AWR reports will show the detailed data that is used to create ADDM reports. These reports provide a large amount of useful data, that can be difficult to interpret, but are often useful on understanding the rationales given for various ADDM recommendations and findings.- In the DBA navigator pane, expand the Performance header,
and click AWR.
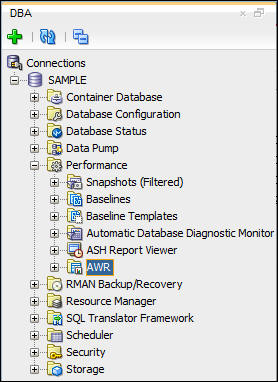
- The AWR settings and basic information is displayed in the
Worksheet area.
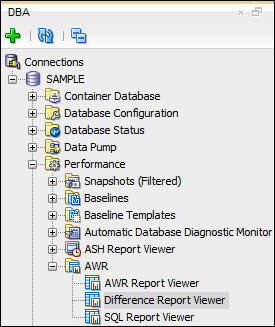
- In the DBA navigator pane, expand the AWR item. You will
see AWR Report Viewer, Difference Report Viewer, and SQL
Report Viewer.
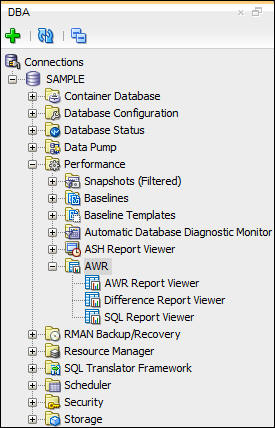
- To generate a AWR report, click AWR Report Viewer. A
dialog appears allowing you to choose the starting and
ending snapshots. You can browse the existing
snapshots. The only restrictions are the beginning snapshot
must be older that the ending snapshot, and the database
instance must not have been shutdown between the chosen
snapshots. The example uses the same snapshots that were
used in the previous examples for the ADDM report.
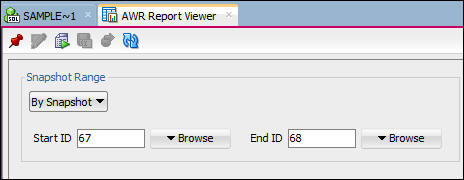
- After choosing the snapshots click the Generate Report
button.
- The report takes a few seconds to appear. It is in HTML
format.
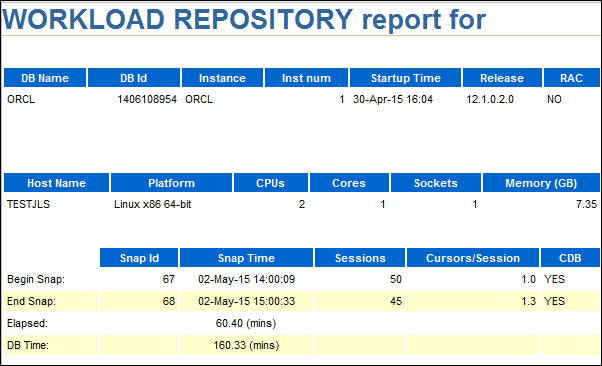
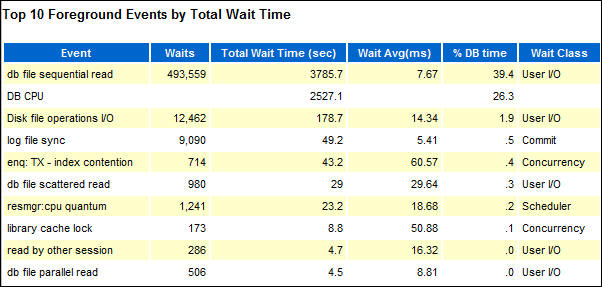
- Scroll down to see Top ADDM Findings, Load Profile,
Instance Efficiency Percentage, Top 10 Foreground Wait
Events, and other sections that represent the Report
Summary. The Top 10 Foreground Wait events section is shown
here.
- Following the Report Summary is the Main Report table of
Contents, that allows you to jump to the section of
interest.
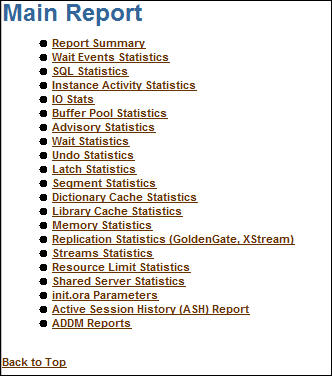
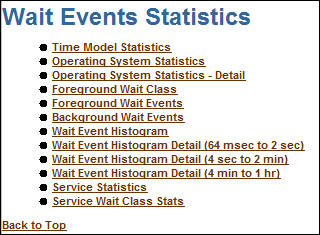
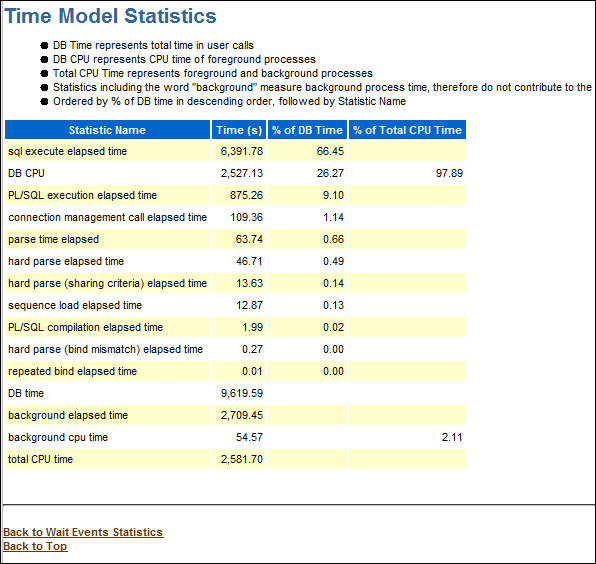
- Click Wait Event Statistics link under Main Report.
- The Time Model Statistics is one of the more important
sections when looking for performance problems. Changes in
these statistics will give a good indication of whether the
tuning efforts are working. Click Time Model
Statistics.
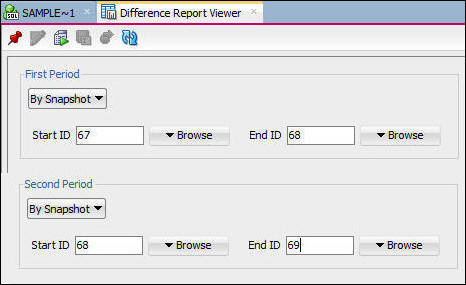
- To generate a Difference Report, click Difference Report
Viewer under the AWR heading in the DBA navigation pane.
- A dialog appears that allows you to chose two periods. In
the example adjacent periods have been selected, but this is
not required. Any two valid periods may be compared. Then
click the Generate Report button.
 Note:
the screen shot has been reformatted to fit the OBE format.
Note:
the screen shot has been reformatted to fit the OBE format.
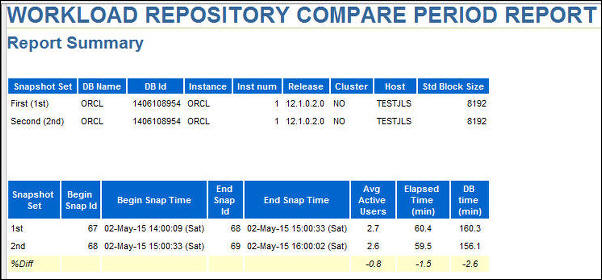
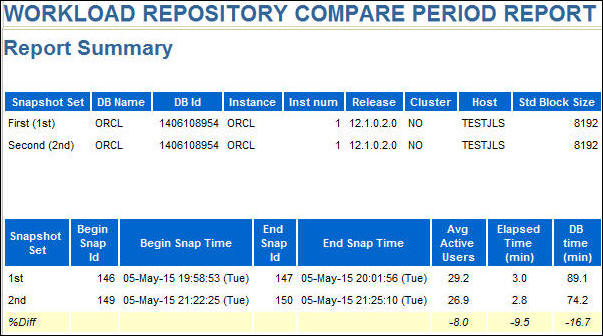
- The display says Generating for a short time before the
Workload Repository Compare Period Report is displayed.It is
helpful when comparing periods if the elapsed time is
similar. Notice that in the example the differences in the
last three columns is very small. The number of active
users, and elapsed time are very close to the same value,
and DB time is slightly less in the second period.
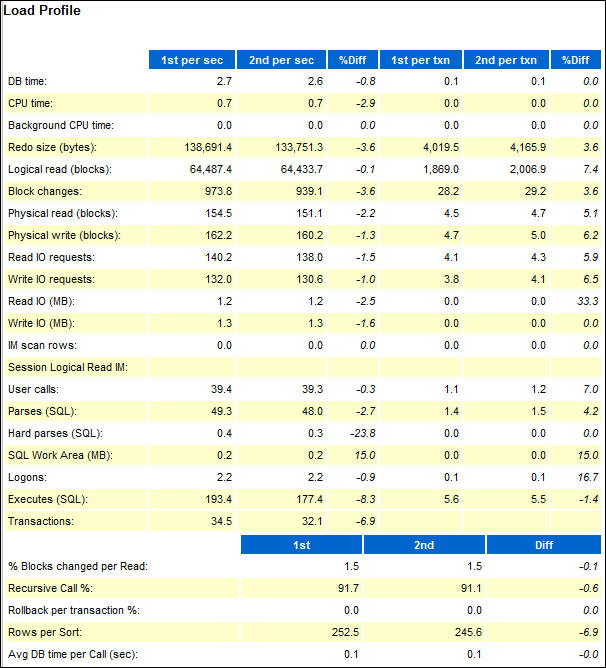
- Scroll down to the Load Profile, If the workload has
changed between the two periods this section will show the
specific ways the load was different. In the example the
same workload is still running for the entire time for both
periods, so the differences are very small.
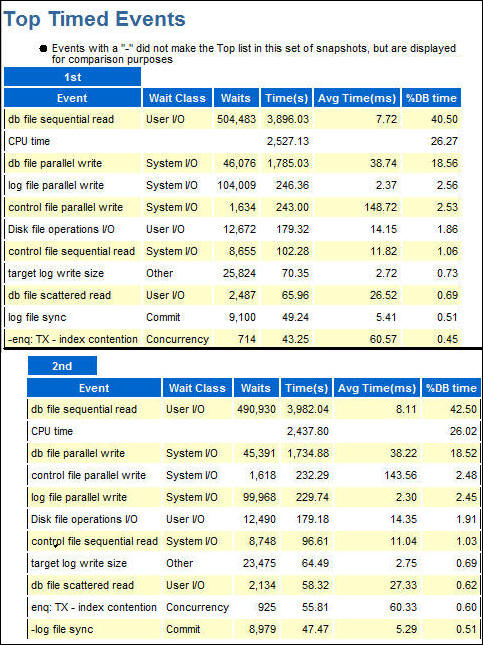
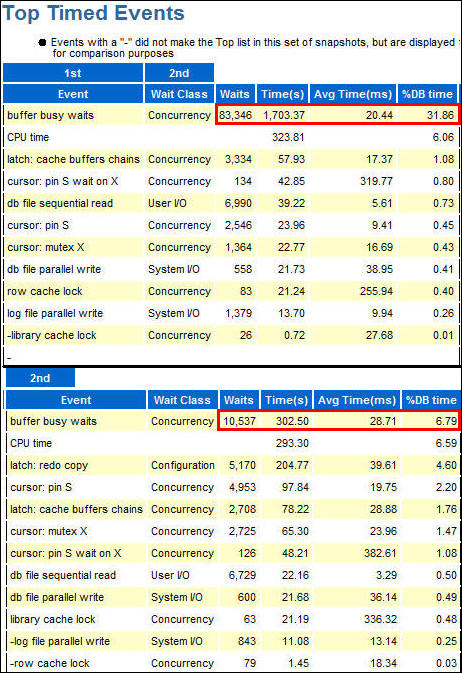
- Scroll down to the Top Timed Events, this is an important
listing for assessing your tuning efforts showing the
changes in various wait events. In this example the first
and second periods are formatted above and below to fit in
this tutorial format rather than the side-by-side as they
appear in the report. Since the workload did not change and
there were no changes to the database configuration, there
were no significant changes to %DB time.
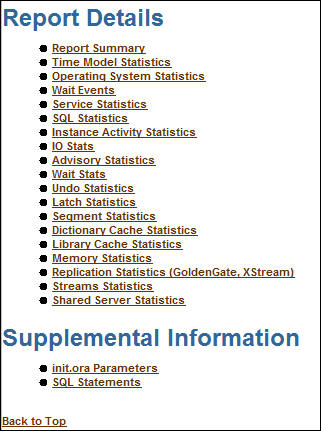
- Scroll down to the Report Details table of contents. This
listing follows the order as the AWR report, and the section
listing may be clicked to jump to the section of interest.
It is worth the time to view several sections of this report
especially the Time Model Statistics, and determine what
information can be gleaned. This tutorial continues without
going into detail on these other sections. Some will be
shown in a later topic.
- Stop the workload. In a terminal window on the DBaaS instance as the oracle user execute rm $HOME/workload/runload
Topic 4: Tune an Database Configuration for an Application Workload
In this workload, the tablespaces have been configured inappropriately. The purpose of this tutorial is follow the ADDM recommendations and observe the change in performance.
Setup the Workload
- Change directory to the $HOME directory of the oracle user.
- In the $HOME directory of the oracle user, run the setup
script
$HOME/workshops/prepare AppWkld
This script sets the Memory parameters to a minimum level. Creates a Manual Segment Space Managed Tablespace, the user and tables for this application.
cd $HOME
$ $HOME/workshops/prepare AppWkld
The Oracle base has been set to /u01/app/oracle

SQL*Plus: Release 12.1.0.2.0 Production on Fri Apr 3 20:21:01 2015

Copyright (c) 1982, 2014, Oracle.  All rights reserved.

SQL> Connected.
SQL> Database closed.
Database dismounted.
ORACLE instance shut down.
SQL>
File created.

SQL> ORACLE instance started.

Total System Global Area 3221225472 bytes
Fixed Size                  2929552 bytes
Variable Size            3087010928 bytes
Database Buffers          117440512 bytes
Redo Buffers               13844480 bytes
Database mounted.
Database opened.
SQL> Disconnected from Oracle Database 12c Enterprise Edition Release 12.1.0.2.0 - 64bit Production
With the Partitioning, OLAP, Advanced Analytics and Real Application Testing options

SQL*Plus: Release 12.1.0.2.0 Production on Fri Apr 3 20:21:47 2015

Copyright (c) 1982, 2014, Oracle.  All rights reserved.

SQL> Connected.
SQL> SQL> drop tablespace tbsspc including contents and datafiles;
drop tablespace tbsspc including contents and datafiles
*
ERROR at line 1:
ORA-00959: tablespace 'TBSSPC' does not exist


SQL>
SQL> CREATE SMALLFILE TABLESPACE "TBSSPC"
  2  DATAFILE '/u02/app/oracle/oradata/ORCL/DEMOS/tbsspc1.dbf' SIZE 50M
  3  AUTOEXTEND ON NEXT 10M MAXSIZE 200M
  4  LOGGING
  5  EXTENT MANAGEMENT LOCAL
  6  SEGMENT SPACE MANAGEMENT MANUAL;

Tablespace created.

SQL> drop user spc cascade;
drop user spc cascade
          *
ERROR at line 1:
ORA-01918: user 'SPC' does not exist


SQL>
SQL> create user spc identified by spc
  2  default tablespace tbsspc
  3  temporary tablespace temp;

User created.

SQL>
SQL> grant connect, resource, dba to spc;

Grant succeeded.

SQL>
SQL> connect spc/spc@DEMOS
Connected.
SQL>
SQL> drop table spct purge;
drop table spct purge
           *
ERROR at line 1:
ORA-00942: table or view does not exist


SQL> create table spct(id number, name varchar2(2000));

Table created.

SQL>
SQL> exec DBMS_STATS.GATHER_TABLE_STATS(-
> ownname=>'SPC', tabname=>'SPCT',-
> estimate_percent=>DBMS_STATS.AUTO_SAMPLE_SIZE);

PL/SQL procedure successfully completed.

SQL>
SQL> exit;
Disconnected from Oracle Database 12c Enterprise Edition Release 12.1.0.2.0 - 64bit Production
With the Partitioning, OLAP, Advanced Analytics and Real Application Testing options
Run the Workload
- Create a snapshot to isolate this workload. Run
$HOME/workshops/snapshots.sh
- Run the workload script
$HOME/workshops/workgen AppWkld
$ $HOME/workshops/workgen AppWkld The Oracle base has been set to /u01/app/oracle PL/SQL procedure successfully completed. PL/SQL procedure successfully completed. PL/SQL procedure successfully completed. PL/SQL procedure successfully completed. ... PL/SQL procedure successfully completed. PL/SQL procedure successfully completed Load is finished - When "Load is finished" message appears, run
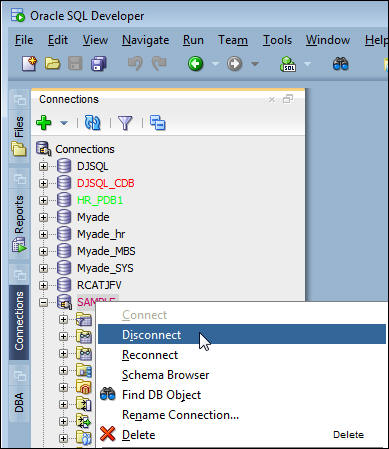
$HOME/workshops/snapshots.sh - In SQL Developer open the Connection navigator pane. Right
click the Sample connection, then click disconnect. The
prepare script shutdown and restarted the database instance
so the connection to the database from SQL Developer must be
reestablished.
- In the Connection navigator expand the Sample connection
to create a new connection.
- In the DBA navigator pane expand the Performance section
and click Automatic Database Diagnostic Monitor.

- When the Automatic Database Diagnostic Monitor tab is
populated in the worksheet area, Find the latest ADDM task
listed in the Name column. If needed sort the listing on the
Start_time column.
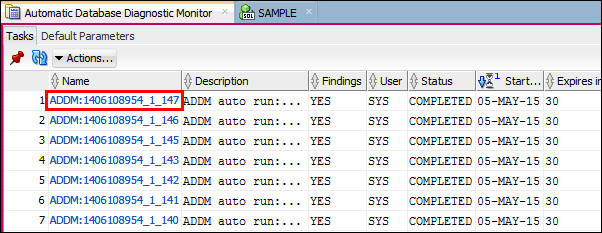
- Double click the latest ADDM Task name. When the task
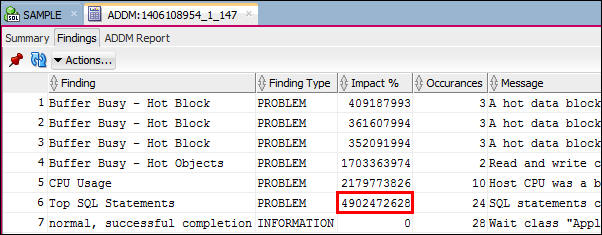
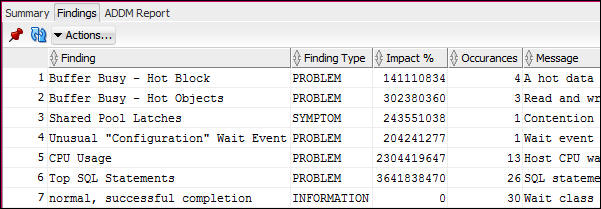
specific listing appears, click Findings tab. Notice that
the findings are not ordered by Impact %. Find the Finding
with the greatest impact.
- Click the ADDM Report tab, to find the recommendations and
rationales. The header shows the Snapshots used for the
period that the workload was running. Note the beginning and
ending snapshots.
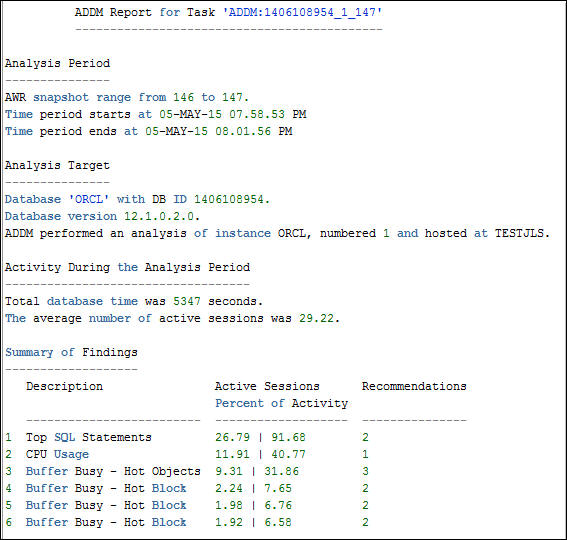
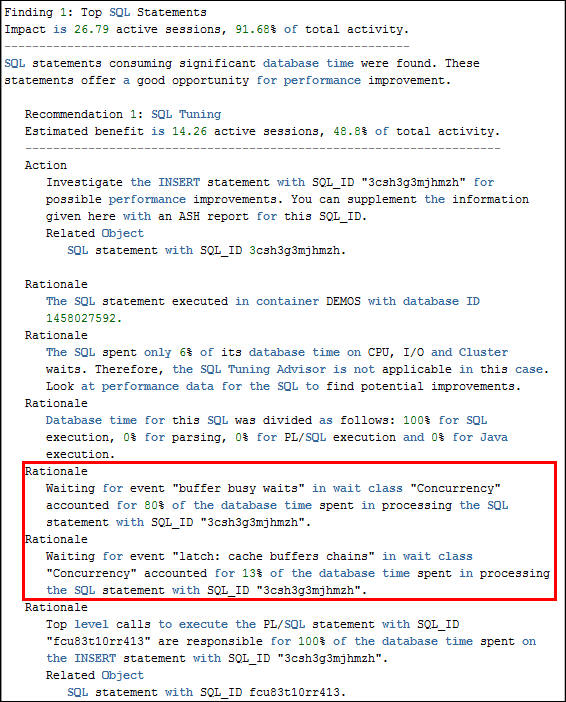
- Scroll down to the first recommendation "Top SQL
Statements". Notice that concurrency has a large impact for
this SQL statement. This should lead to further
investigation of the specific concurrency waits named. For a
description of wait events, see the Oracle
Database Reference : Wait Events
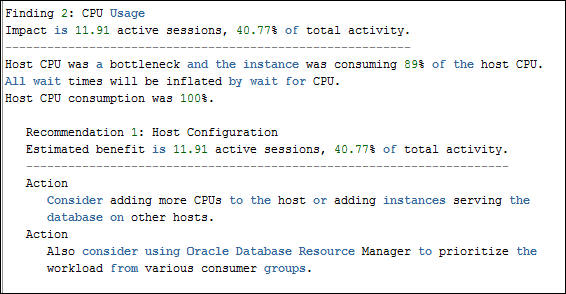
- Scroll down to examine the second Finding, CPU Usage. The
CPU Usage Finding will often accompany other finding that
put a load on the CPU because of inefficient SQL or poor
configuration. (Your report may not show all of the same
findings)
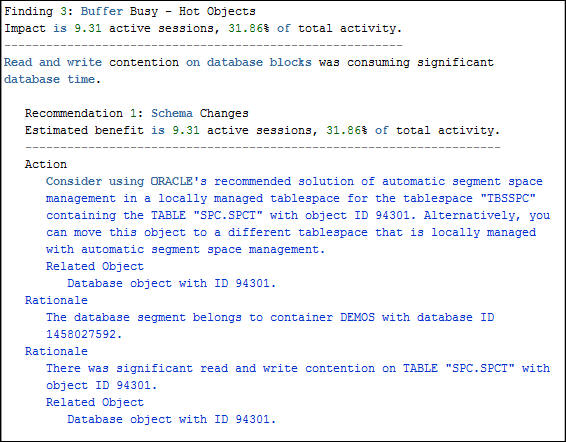
- Scroll down to examine the third finding, Buffer Busy -
Hot Object. Notice this finding will reduce the the
concurrency problem. The Hot Object is being caused by the
inserts on the SPC.SPCT table. ADDM has determined that the
tablespace is configured with manual segment space
management which is not the recommended (and not the
default) configuration. ADDM recommends that the table be
moved into a tablespace with automatic segment space
management.
- This process of checking findings should continue until
all the findings are reviewed. In this example, assume that
the SQL cannot be modified due to support restrictions. The
recommendations for the CPU Usage requires more hardware
that is not available. The third finding is something that
you can implement.
$ $HOME/workshops/snapshots.sh
PL/SQL procedure successfully completed.
$ $HOME/workshops/snapshots.sh
PL/SQL procedure successfully completed.
Tune the Configuration
- Implement the recommendation by running the script $HOME/workshops/fix_AppWkld.sql in a SQLPLUS seesion. This script drops the tables, tablespace and user, then recreates them using a automatic segment space managed tablespace.
sqlplus sys@DEMOS as sysdba
SQL> @$HOME/workshops/fix_AppWkld.sql
$ sqlplus sys/Oracle_4U@DEMOS as sysdba
SQL*Plus: Release 12.1.0.2.0 Production on Fri Apr 3 21:45:00 2015
Copyright (c) 1982, 2014, Oracle. All rights reserved.
Enter password:
Connected to:
Oracle Database 12c Enterprise Edition Release 12.1.0.2.0 - 64bit Production
With the Partitioning, OLAP, Advanced Analytics and Real Application Testing options
SQL> @$HOME/workshops/fix_AppWkld.sql
SQL>
SQL> drop tablespace tbsspc
2 including contents and datafiles;
Tablespace dropped.
SQL>
SQL> CREATE SMALLFILE TABLESPACE "TBSSPC"
2 DATAFILE '/u02/app/oracle/oradata/ORCL/DEMOS/tbsspc1.dbf' SIZE 50M
3 AUTOEXTEND ON NEXT 10M MAXSIZE 200M
4 LOGGING
5 EXTENT MANAGEMENT LOCAL
6 SEGMENT SPACE MANAGEMENT AUTO;
Tablespace created.
SQL>
SQL> connect spc/spc@DEMOS
Connected.
SQL>
SQL> drop table spct purge;
drop table spct purge
*
ERROR at line 1:
ORA-00942: table or view does not exist
SQL> create table spct(id number, name varchar2(2000))
2 tablespace tbsspc;
Table created.
SQL>
SQL> exec DBMS_STATS.GATHER_TABLE_STATS(-
> ownname=>'SPC', tabname=>'SPCT',-
> estimate_percent=>DBMS_STATS.AUTO_SAMPLE_SIZE);
PL/SQL procedure successfully completed.
SQL>
SQL> exit;
Disconnected from Oracle Database 12c Enterprise Edition Release 12.1.0.2.0 -
64bit Production
With the Partitioning, OLAP, Advanced Analytics and Real Application Testing options
Run the Workload
- Create a snapshot to isolate this workload. Run
$HOME/workshops/snapshots.sh
- Run the workload script
- When "Load is finished" message appears,
run
$HOME/workshops/snapshots.sh
$ $HOME/workshops/snapshots.sh PL/SQL procedure successfully completed.
$ $HOME/workshops/snapshots.sh
PL/SQL procedure successfully completed.
$HOME/workshops/workgen AppWkld
$ $HOME/workshops/workgen AppWkld

The Oracle base has been set to /u01/app/oracle

PL/SQL procedure successfully completed.

PL/SQL procedure successfully completed.

PL/SQL procedure successfully completed.

PL/SQL procedure successfully completed.

 ...

PL/SQL procedure successfully completed.

PL/SQL procedure successfully completed

Load is finished
Run a AWR Differences Report
- In the DBA navigation pane, click Automatic Database
Diagnostics Monitor. In the worksheet area find the latest
ADMM task. Sort the tasks by start_time if necessary. Note:
the last portion of the ADDM task name is the ending
snapshot number. Note the snapshot number
- In the DBA navigation pane, expand AWR and click
Difference Report Viewer.
- In the Difference Report Viewer dialog, set the First
Period snapshots to the values you noted in the first run,
set the Second Period snapshots to the values of the
snapshots used in the latest ADDM task, set the ending
snapshot to the suffix of the task name, and the beginning
snapshot to the previous snapshot.
- Click the Generate Report icon .
In the header of the report notice the change in DB time
from the first to the second run of the same workload.
- Scroll down to the Top Timed Events section. Notice the
difference in buffer busy waits between the first and second
periods. The % DB time spen in waits is greatly reduced, as
is the total time and number of waits. Note:
the example has been reformatted to fit the tutorial format.
- Check the ADDM report for the second period. Did the findings change?
- Use the DBA navigator pane to display Automatic Database Diagnostic Monitor view in the worksheet area.
- Double click the ADDM Task name that corresponds with the end time for your second period. ( The suffix of the task name will be the ending snapshot number)
- Click the Findings tab.
- Notice that the order and the impact of the findings
changed Top SQL statements is still at the top, but the
impact has been reduced..
Topic 5: Cleanup Database Instance
1) Delete the Database Cloud instance, and recreate it. Be sure to request the DEMOS PDB is created. This requires about 2 hours.
2) Follow the instructions below.
- Run the script:
- Start SQL*Plus as the sys user, the sys password connect 'AS SYSDBA' sqlplus / as sysdba
- To restore your database instance to the original state before running this tutorial, issue the following commands.
$HOME/workshops/cleanup AppWkld
$HOME/workshops/cleanup AppWkld
AppWkld

SQL*Plus: Release 12.1.0.2.0 Production on Wed May 6 20:46:39 2015
Copyright (c) 1982, 2014, Oracle.  All rights reserved.

Enter password:

Connected to:
Oracle Database 12c Enterprise Edition Release 12.1.0.2.0 - 64bit Production

With the Partitioning, OLAP, Advanced Analytics and Real
Application Testing options

SQL>
SQL> drop tablespace tbsspc including contents and datafiles;

Tablespace dropped.

SQL>
SQL> drop user spc cascade;
User dropped.

SQL>
SQL> exit;
Disconnected from Oracle Database 12c Enterprise Edition
Release 12.1.0.2.0 - 64bit Production
With the Partitioning, OLAP, Advanced Analytics and Real
Application Testing options
$ sqlplus / as sysdba

SQL*Plus: Release 12.1.0.2.0 Production on Tue Apr 7 14:15:13 2015

Copyright (c) 1982, 2014, Oracle.  All rights reserved.


Connected to:
Oracle Database 12c Enterprise Edition Release 12.1.0.2.0 - 64bit Production
With the Partitioning, Oracle Label Security, OLAP, Advanced Analytics
and Real Application Testing options
SHUTDOWN IMMEDIATE;
CREATE SPFILE='spfileORCL.ora' FROM PFILE='pfileORCL.bak';
STARTUP MOUNT;
ALTER DATABASE ARCHIVELOG;
ALTER DATABASE FLASHBACK ON;
ALTER DATABASE OPEN;
EXIT;
SQL> SHUTDOWN IMMEDIATE;

Database closed.
Database dismounted.
ORACLE instance shut down.

SQL>CREATE SPFILE='spfileORCL.ora' FROM PFILE='pfileORCL.bak';
File created.

SQL> STARTUP MOUNT;
ORACLE instance started.

Total System Global Area 3170893824 bytes
Fixed Size                  2929400 bytes
Variable Size            1728056584 bytes
Database Buffers          788529152 bytes
Redo Buffers               13844480 bytes
In-Memory Area            637534208 bytes
Database mounted.

SQL> ALTER DATABASE ARCHIVELOG;
Database altered.

SQL> ALTER DATABASE FLASHBACK ON;
Database altered.

SQL> ALTER DATABASE OPEN;
Database altered.

SQL> EXIT;
Disconnected from Oracle Database 12c Enterprise Edition Release 12.1.0.2.0 - 64bit Production
With the Partitioning, OLAP, Advanced Analytics and Real Application Testing options
Summary
In this tutorial, you learned to:
- Navigate SQL Developer, while a workload is running
- Tune the database configuration for an application workload
using ADDM recommendations
Resources
- Courses by Oracle University:
- Oracle Database 12c: Administration Workshop Ed 2
- Oracle Database 12c: Performance Management and Tuning
- Oracle Database 11g: SQL Tuning Workshop Release 2
- Oracle Database 11g: Performance Tuning DBA Release 2
- To learn more about Performance Management For DBaaS refer to additional OBEs in the Oracle Learning Library
Credits
- Lead Curriculum Developer: James Spiller
- Other Contributors: Dominique Jeunot
To navigate this Oracle by Example tutorial, note the following:
- Topic List:
- Click a topic to navigate to that section.
- Expand All Topics:
- Click the button to show or hide the details for the sections.
By default, all topics are collapsed.
- Hide All Images:
- Click the button to show or hide the screenshots. By default,
all images are displayed.
- Print:
- Click the button to print the content. The content that is
currently displayed or hidden is printed.
To navigate to a particular section in this tutorial, select the
topic from the list.