 Reporting Solutions Overview for Planning
 Before You Begin
This 15-minute tutorial shows you how to run reports and create reports from Ad hoc grids in Planning.
Background
Reports is a cloud-based reporting solution for creating EPM cloud financial and managerial reports. Report designers can insert charts and grids into a report utilizing EPM cloud sources such as Planning, Financial Consolidation and Close, and Tax Reporting.
What Do You Need?
Before starting this tutorial, you should:
- Have Service Administrator access to Planning for EPM Enterprise Cloud Service.
- Upload and import this snapshot into your Planning instance.
- Set the navigation flow to Financial Flow - Admin.
- Ensure that Microsoft Excel is installed.
 Reports Overview
With reports, you view summaries of key data for your organization. You can view and interact with reports that have been shared with you by report designers.
You run reports from Planning by navigating to the Reports page. Reports are organized into folders. When you run a report, you can select either HTML or PDF. You may be prompted to select a Point of View to provide a frame of reference for the data. You also can export reports to Excel.
Reports can be either dynamic, where you can select members, or a snapshot where the members are already selected. You can save an ad hoc grid as a report so that it is available to run in the future.
Navigating Reports in Planning
You open reports from the Reports page.
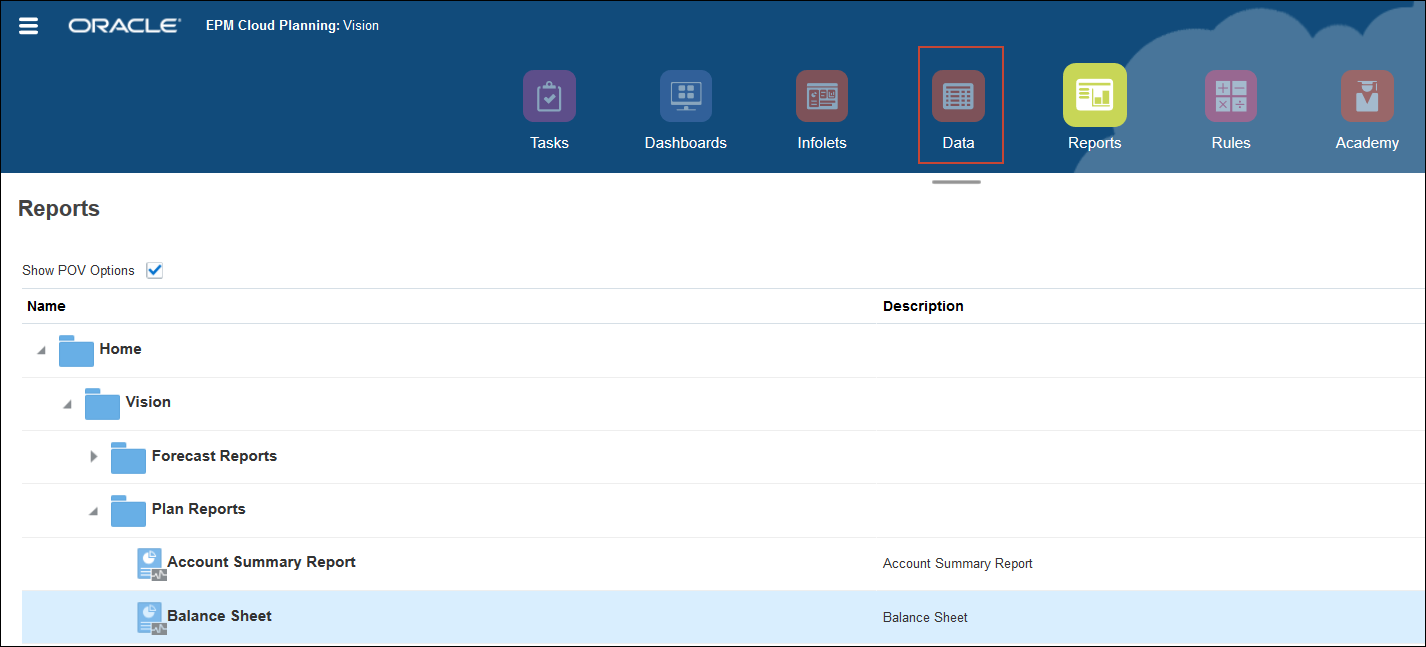
- From the Home page, click Reports.

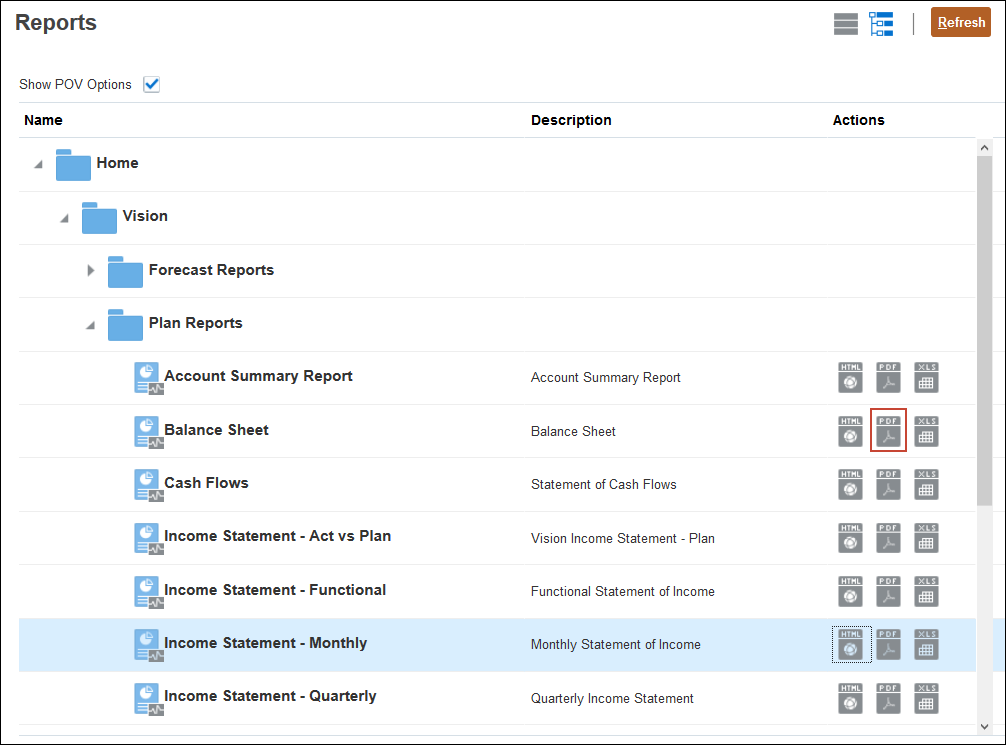
The Reports repository is displayed. Reports are organized in folders.
- Expand Vision.

- Expand Plan Reports.
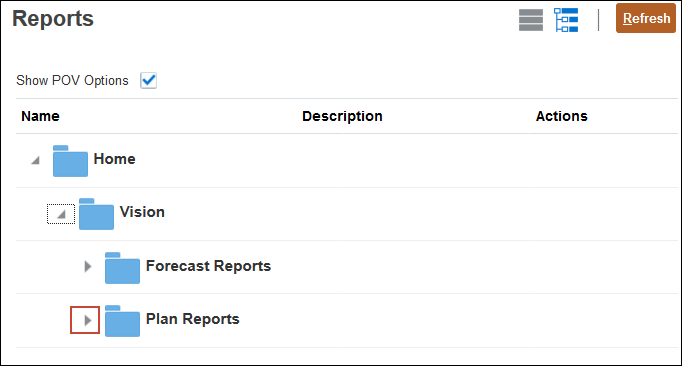
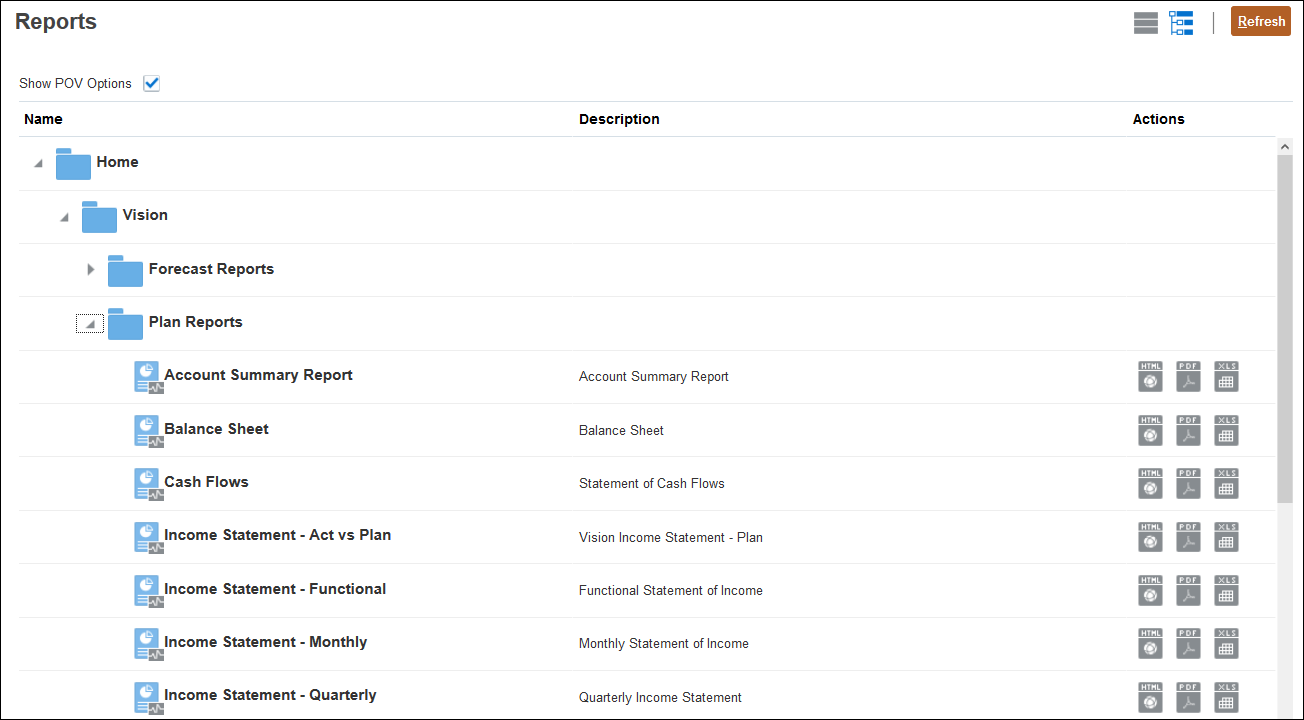
The Plan Reports folder is expanded so you can see the list of available reports.
 Running Reports in Planning
In this section, you learn how to run reports in Planning. You can run reports either as an HTML or PDF. You can also export the report to Excel. The report designer defines what dimensions are shown in the POV and which members can be selected for each POV dimension.
- On the Reports page, scroll down and in the row for Income Statement Monthly, click (
 ) HTML.

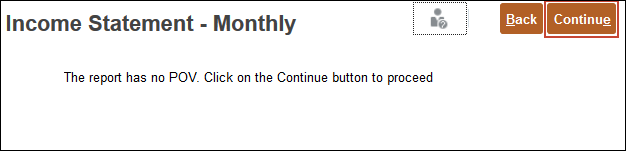
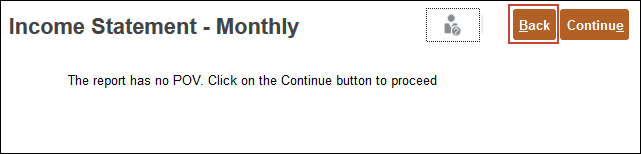
- At the information message, click Continue.
- From the page drop down list, select Sales.
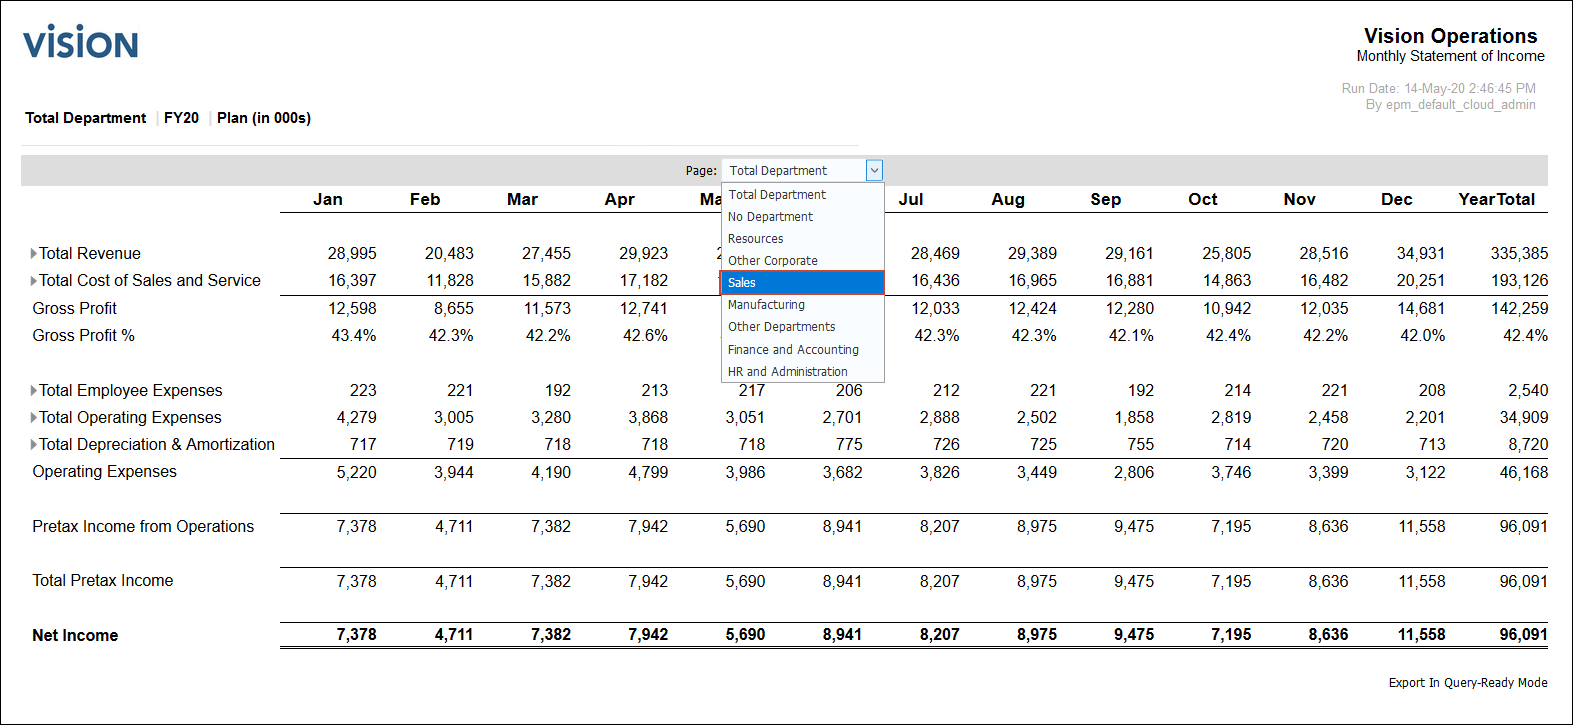
Data for the Sales department is displayed.
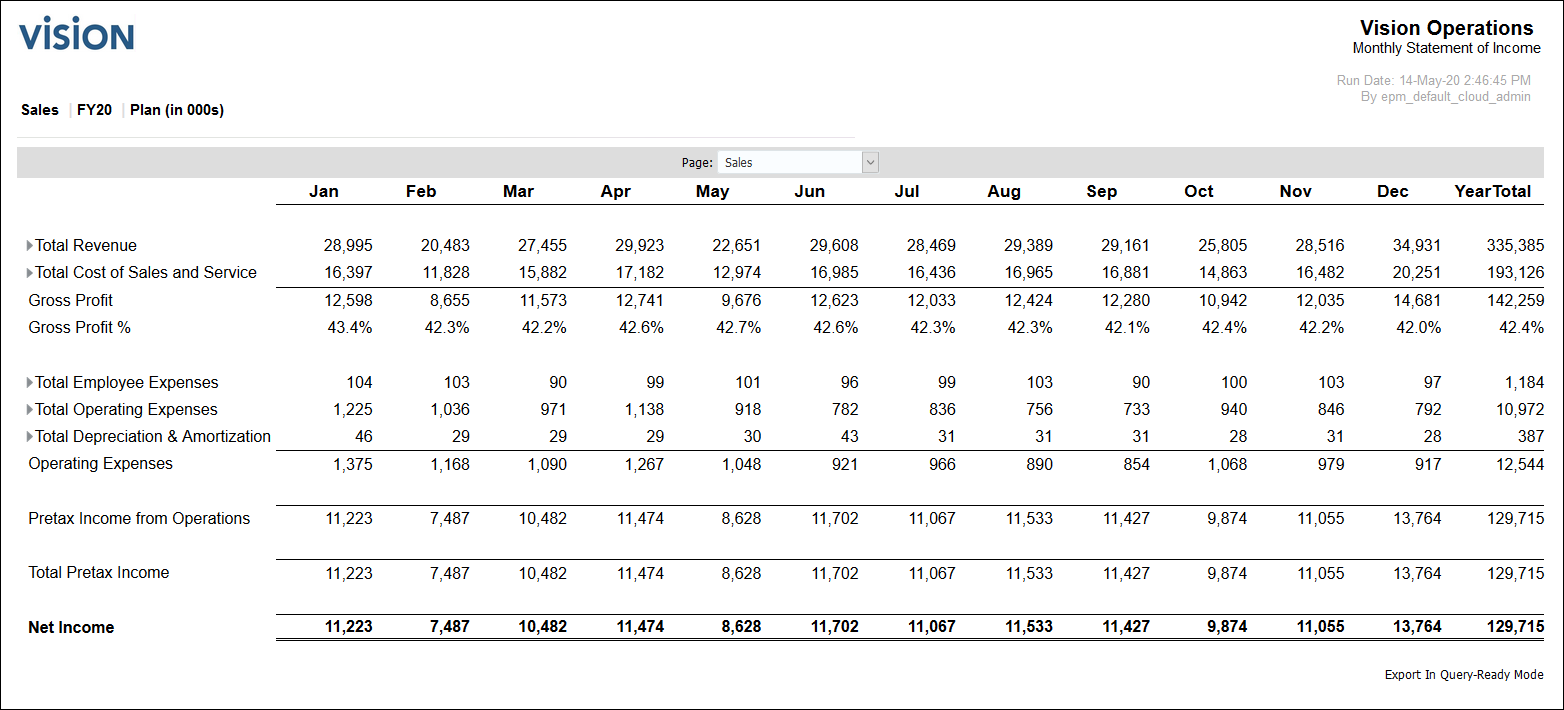
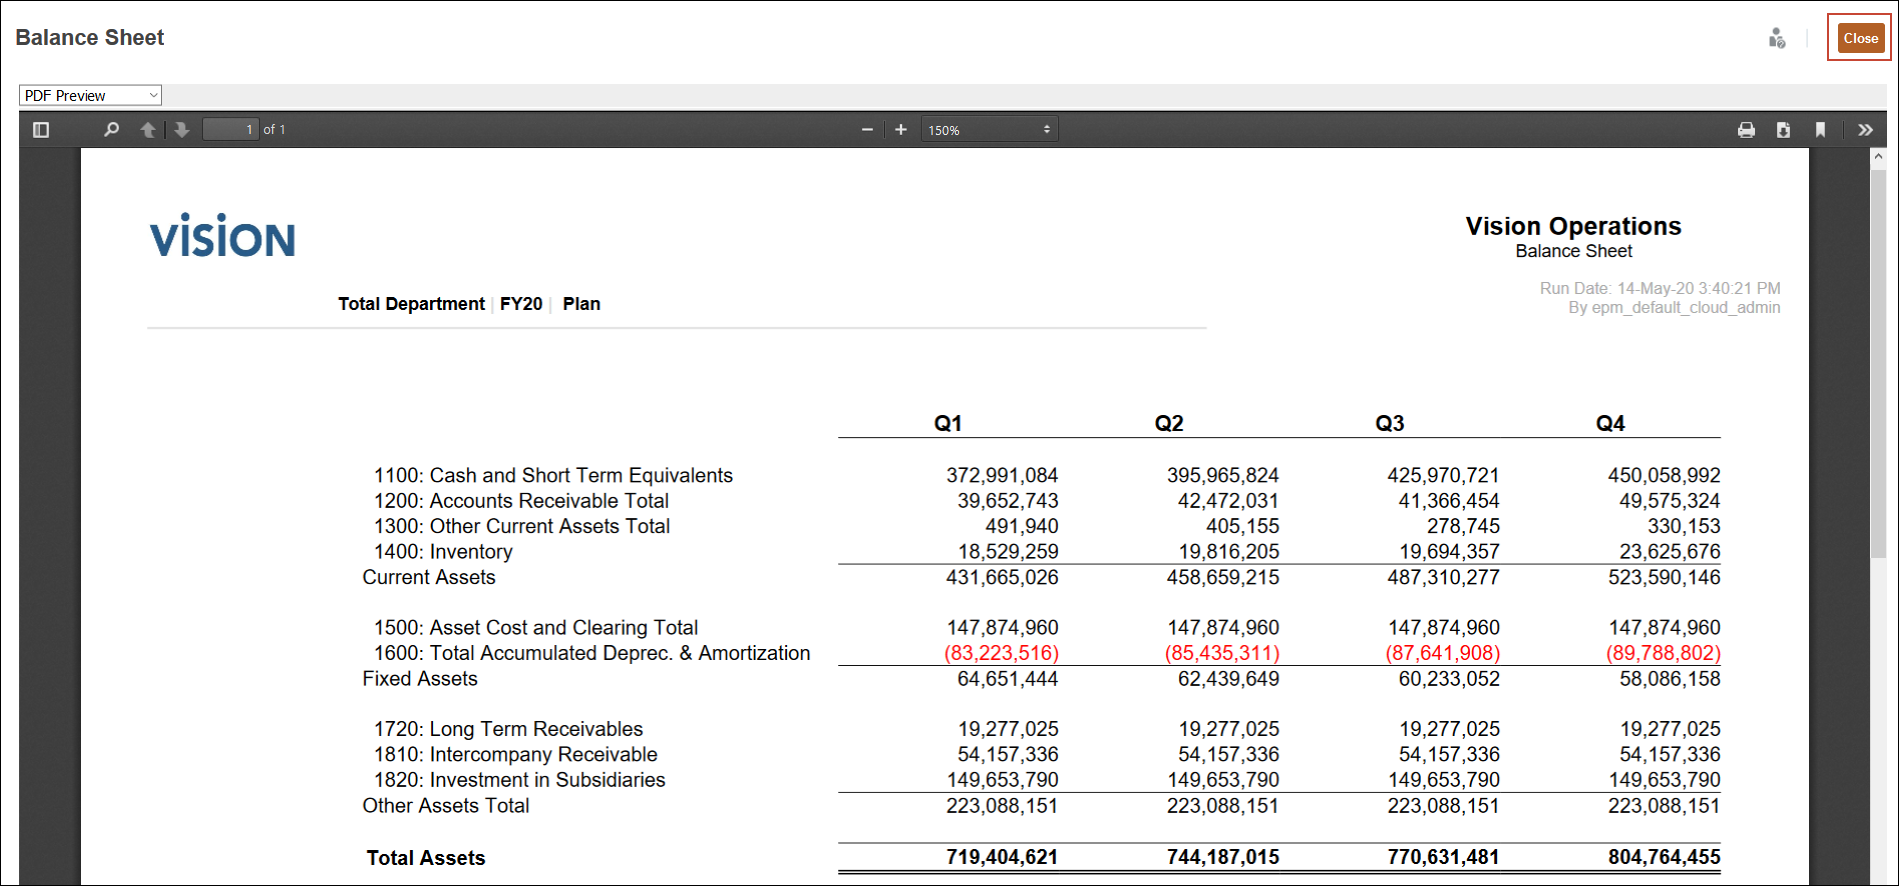
- In the upper left of the report, from the view drop down list, select PDF Preview.

The pdf preview shows data for Total Department which is based on the original report design. You can search for items in the document, navigate to the next page and zoom in. Notice that you can print or download the pdf.

- Click Close.
- Click Back.
- On the Reports page, in the row for Balance Sheet, click (
 ) PDF .
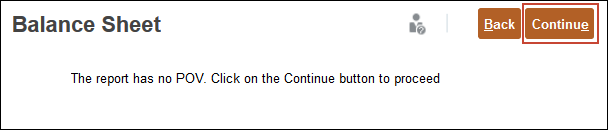
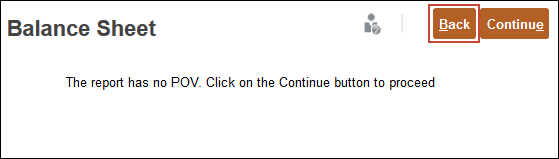
- At the information message, click Continue.
The Balance Sheet is displayed in PDF format.

- From the View drop-down, select Export to Excel.
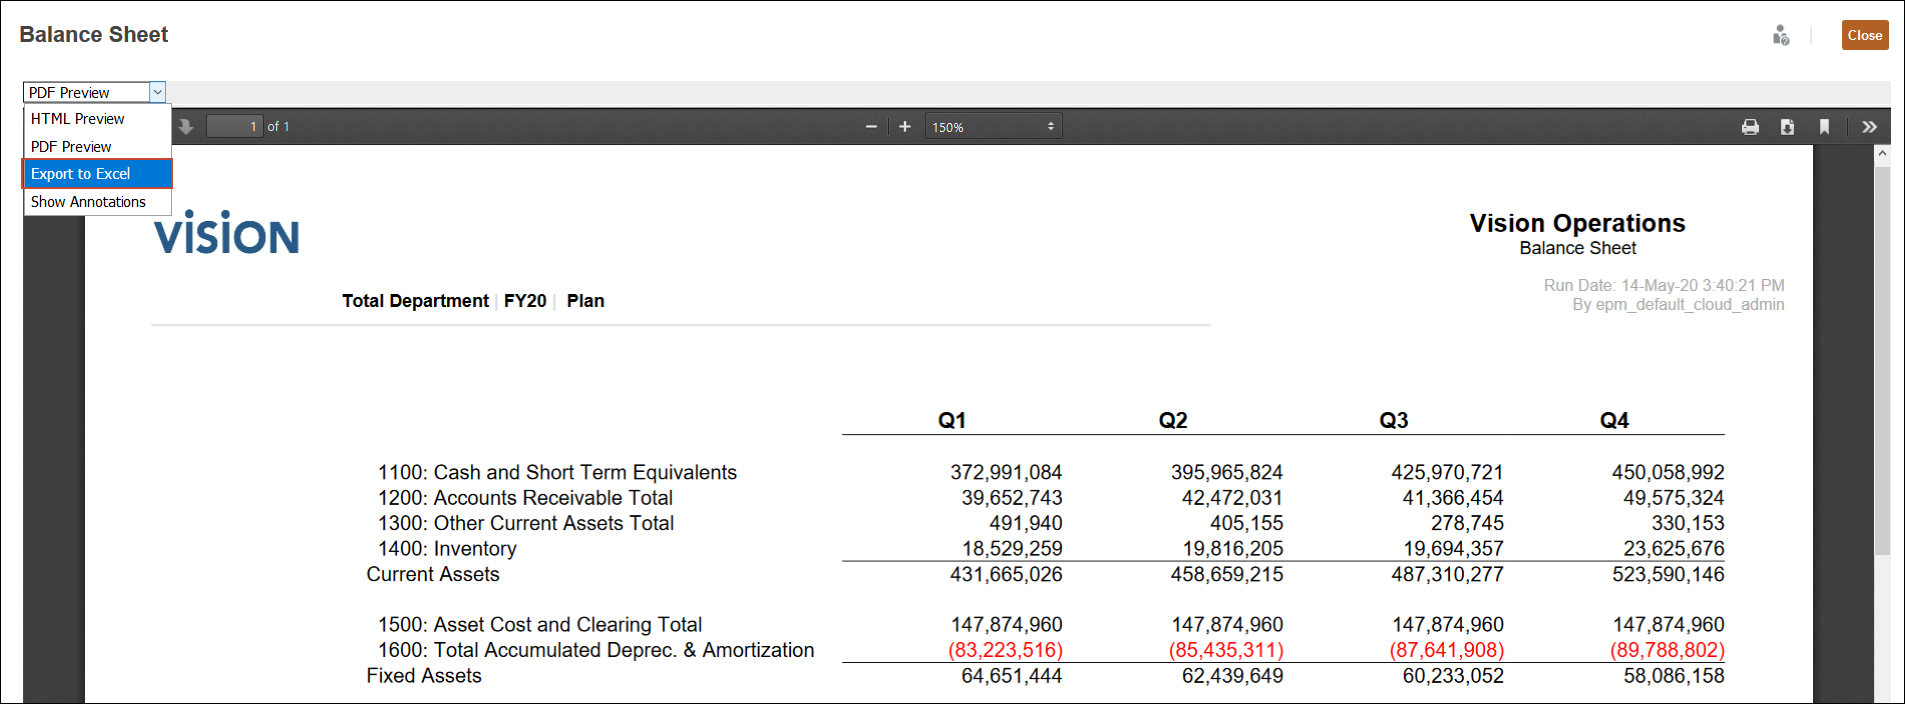
- Select Open with, and click OK.
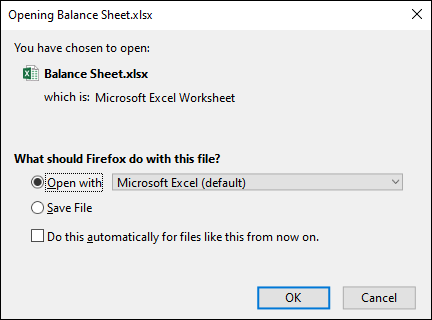
The file is opened in Excel.
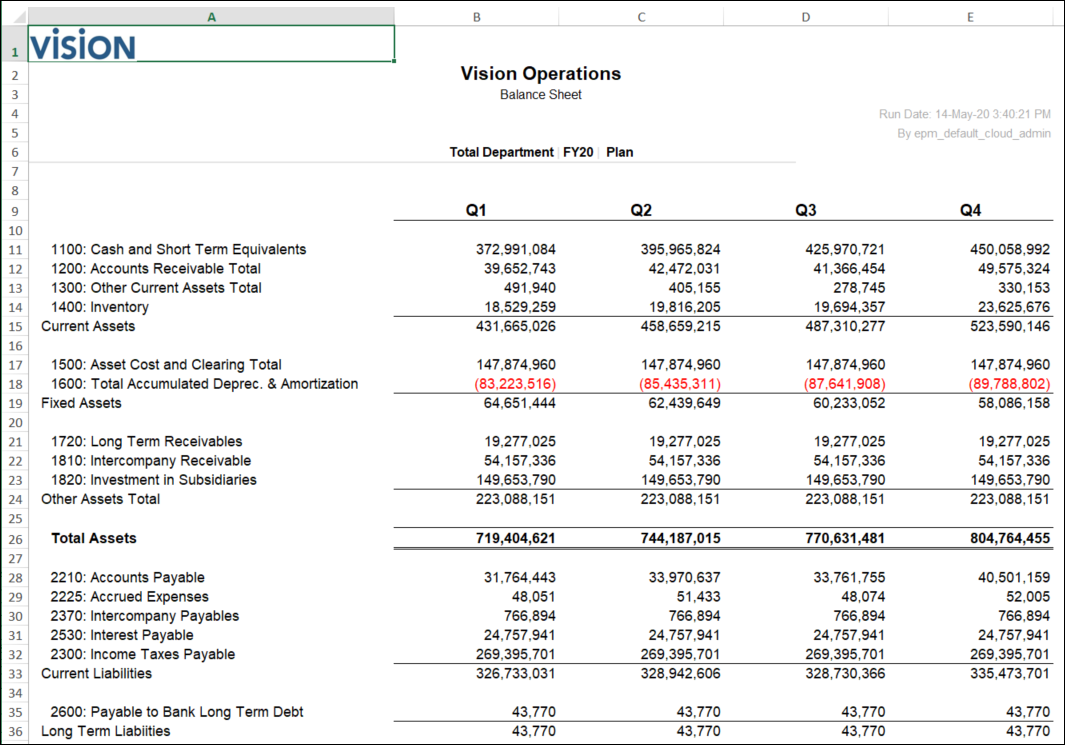
- Close Excel.
- Click Close to close the report.
- Click Back.
 Creating Reports from Ad Hoc Grids in Planning
In this section, you learn how to create reports from Ad Hoc grids.
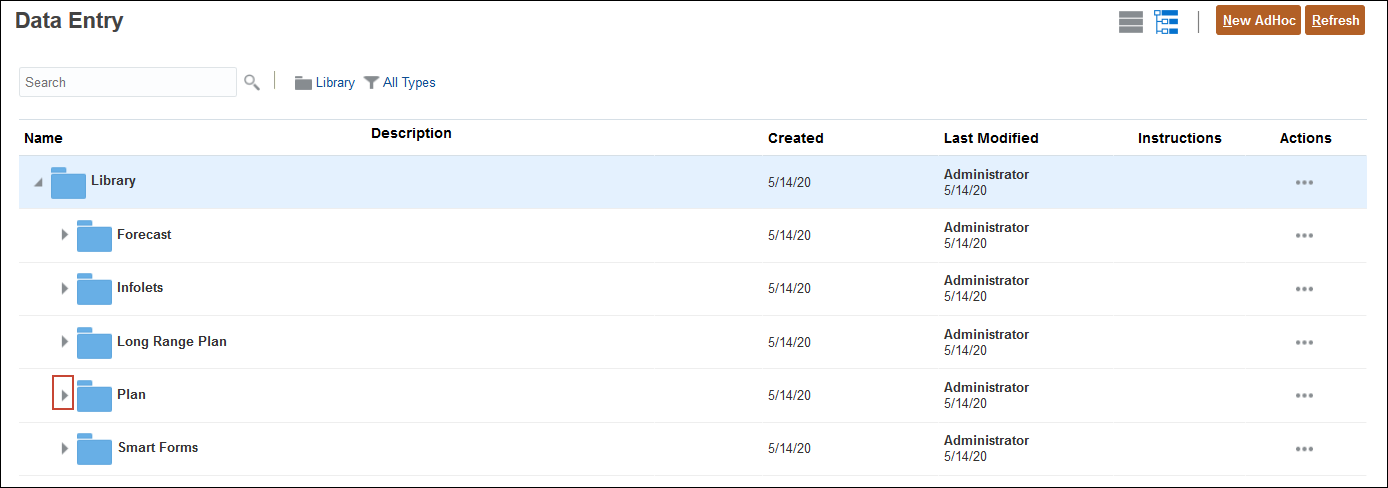
- Click Data.
- On The Data Entry page, expand Plan.
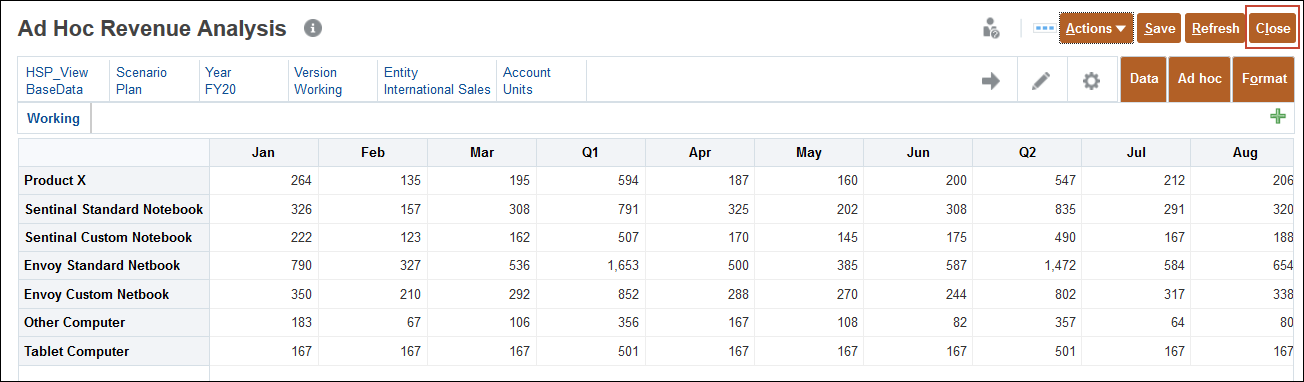
- Select Ad Hoc Revenue Analysis to open it.

- In the POV, click Year.
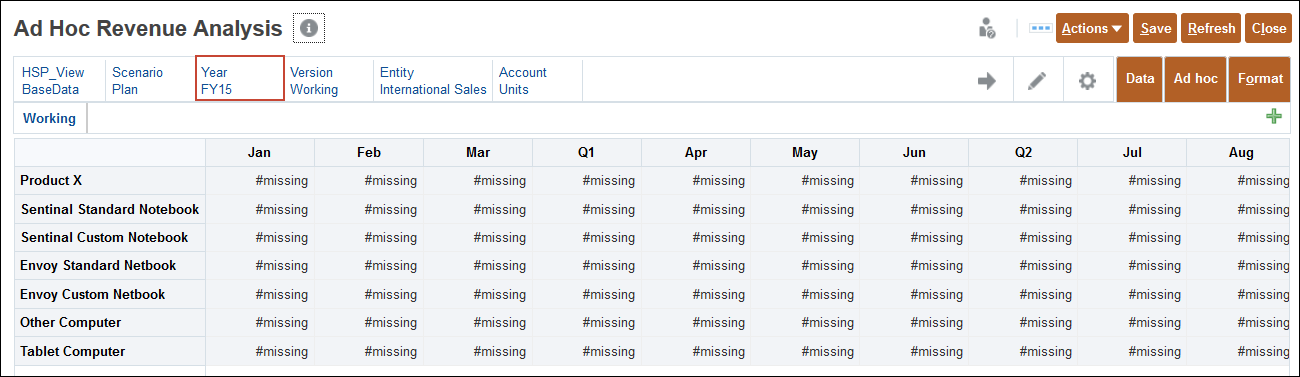
- Select FY20, and click OK.

- From the Actions menu, select Save Ad Hoc Grid.

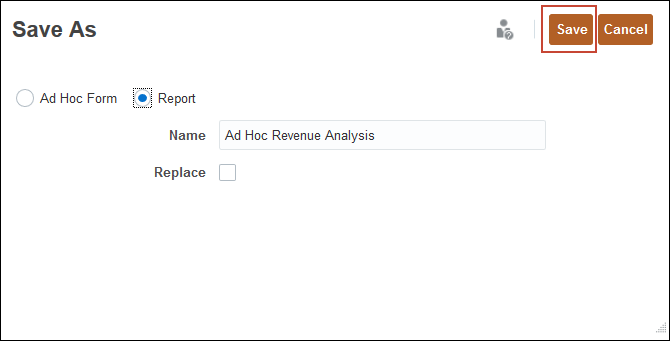
- In the Save As dialog box, select Report.
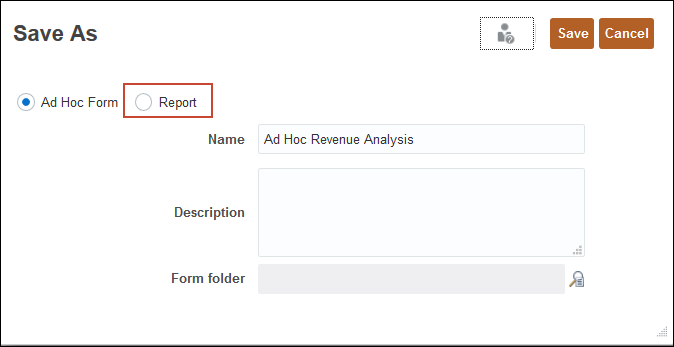
- Click Save.
- Click Close.
- Click Reports.

- On the Reports page, click Refresh.

- Expand Vision.

- Expand Plan1.

The report is displayed on the Reports page.
