Print
PrintBefore you begin
This 45-minute hands-on tutorial shows you how to predict, forecast and analyze with Sales Planning. The sections build on each other and should be completed sequentially.
Background
Oracle Sales Planning Cloud provides an extensible, reliable framework that enables your teams to set and analyze data-driven, intelligent quotas using best practice methodologies. All key participants engage in the sales planning process including sales operations, sales management, and sales reps.
Advanced Sales Forecasting provides a robust platform for the sales forecasting process, allowing multidimensional sales forecasting across territories, products, accounts, channels, or other custom dimensions. It offers sales teams connected sales planning with integration between Quota Planning, compensation planning, and sales forecasts. With Advanced Sales Forecasting, you can plan at the weekly or monthly level, and use a rolling forecast if your business requires it.
Extend Oracle Sales Planning Cloud by adding configurations and personalization into your sales planning application with custom navigation flows, dashboards, and infolets. Use tasks and approvals to manage the quota planning process. Use Groovy rules to customize even further for enhanced calculation and business rules. Integrate Oracle Sales Planning Cloud with Oracle Engagement Cloud – Sales Cloud to push quota targets to incentive compensation or bring in actual attainment.
As a sales manager, you can make forecast predictions, view forecast analyses, and adjust forecast commitments across your entire sales hierarchy.
What do you need?
An Oracle Sales Planning Cloud Service instance allows you to deploy and use one application. To deploy another application, you must request another Oracle Sales Planning Cloud instance or remove the current application.
- Have Service Administrator access to Oracle Sales Planning Cloud. The instance should not have an application created.
- Import the SalesPln application into your Oracle Sales Planning Cloud instance:
- If you haven't already, register for a free Oracle Cloud Customer Connect account so you can access the required files.
- From this Idea page, download and extract the SPC_apps.zip file. The compressed file contains two snapshots.
- Upload and import the SPC_BaseAdv.zip snapshot into your Oracle Sales Planning Cloud instance.
For more information on uploading and importing migration snapshots, refer to the Administering Migration for Oracle Enterprise Performance Management Cloud documentation.
Reviewing Advanced Sales Forecasting configuration
About themes
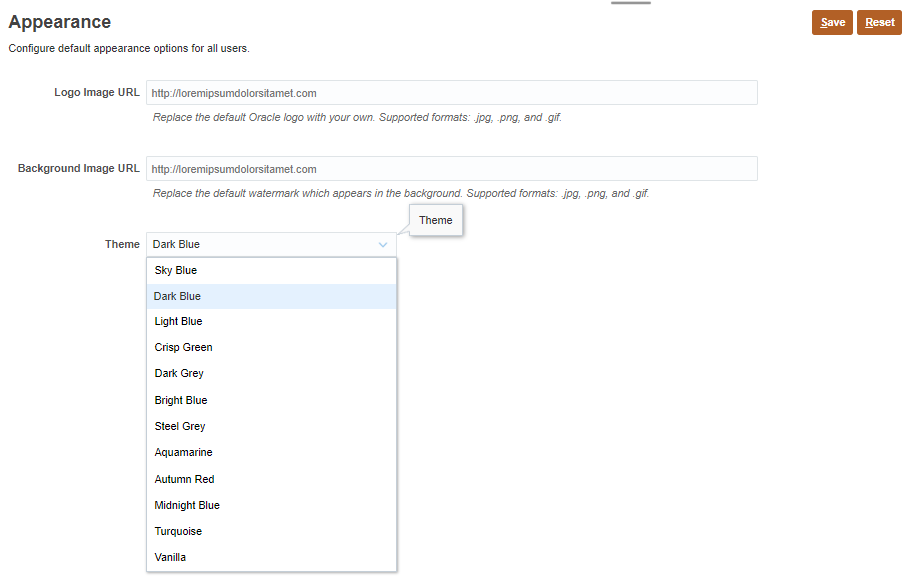
You can change the theme of your display or add your company logo or a background image to the home page.
This tutorial was developed using the Dark Blue theme. You can select a theme by clicking ![]() (Navigator), then under Tools, click Appearance. For Theme, select a color option.
(Navigator), then under Tools, click Appearance. For Theme, select a color option.
Reviewing configuration and enabled features
- On the home page, click Application, then Configure.

- From the Configure drop-down list, select Advanced Sales Forecasting.

The configuration task is displayed.

- Click Enable Features.
- Review the enabled features.
You can plan by territory. The lowest level in each hierarchy represents a sales rep. With Territory, you can integrate with Oracle Engagement Cloud’s Territory Management. The accounts, and product optional core custom dimensions have predefined functionality and artifacts associated with them. You can plan with a product and accounts dimension.

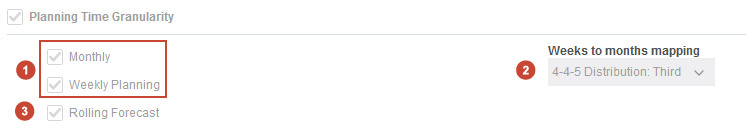
For the time granularity:
- You can plan on a monthly and weekly basis.
- With weekly planning, you can select the week-to-month mapping independently from the selections made during application setup. The week to month mapping is set up as 4-4-5 Distribution which lets your users perform their forecasting weekly while providing the flexibility of easily reporting on monthly totals.
- Rolling forecasts are enabled. This creates a Rolling Forecast scenario that you can use to continuously forecast over a rolling range of time periods.
With Predictive Planning enabled, perform time series statistical analyses on historical data to predict future results. Users can copy these predictions into forecast and what-if scenarios.

Quota Planning is also enabled. With Target Quota from Quota Planning enabled, a data map: Quota Planning Sales Forecast Integration is created. When your quota planning is finalized, you can push the final target quota numbers by Territory from Quota Planning to use as a starting point for your sales forecast in Advanced Sales Forecasting.

- Scroll down.
In addition to the Accounts and Product dimensions, you enable a custom dimension, Sales Channel.

- Click Close.
- On Configure, click Time Period Configuration.

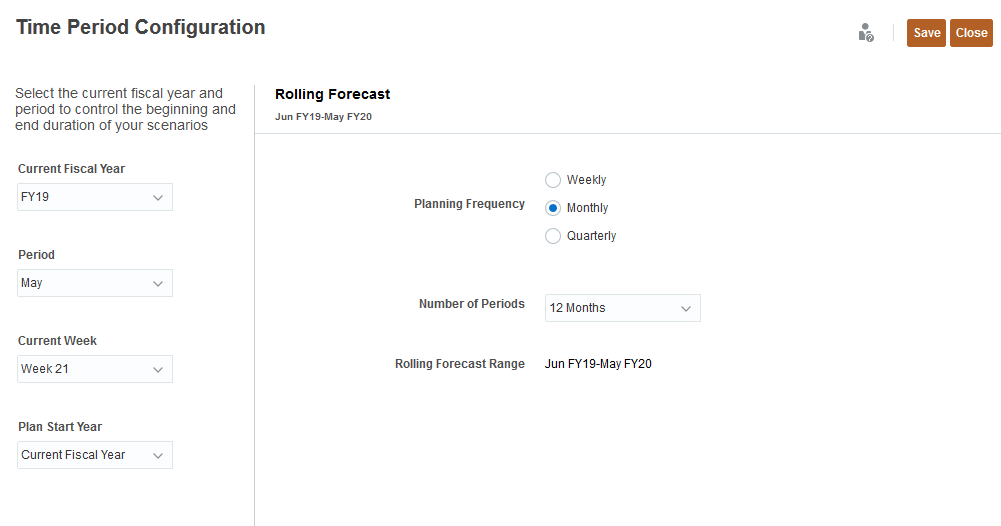
- Review the time period configuration.
The current fiscal year, period, and week is displayed. The planning frequency and number of periods for the rolling forecast is displayed.
- Click Close.
Setting variables and user preferences
In this section, you review the substitution variables that are set up, and you set user preferences so that you can work with forms and dashboards.
Reviewing substitution variable values
- Click
 (Navigator), and under Tools, click Variables.
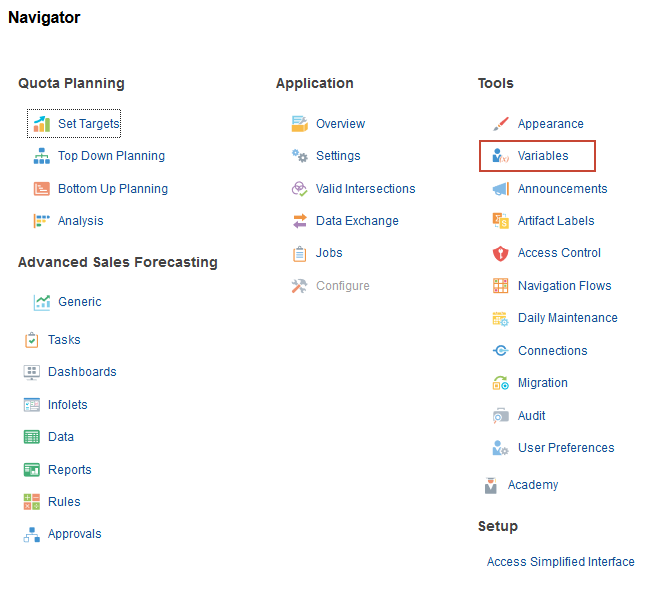
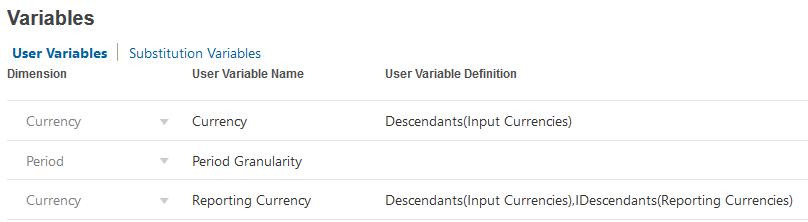
In Variables, you can administer user variables and substitution variables.
- Click the Substitution Variables tab.
- Review the values for substitution variables.
For all cubes, OEP_CurYr is FY19. notice the values for OEP_GREP and OEP_GSP. The current month is May.

Setting user preferences
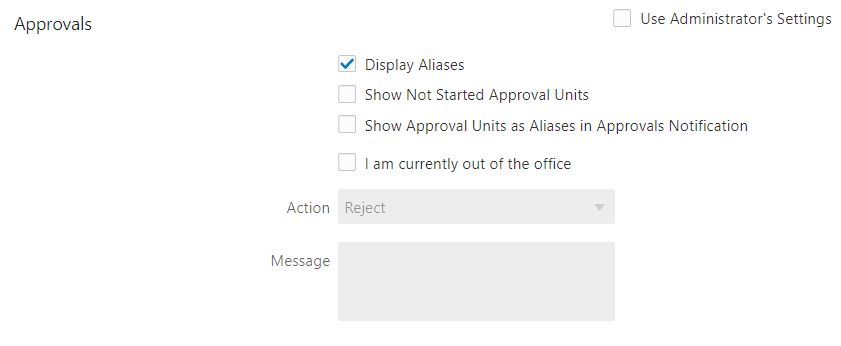
- Click User Preferences.

- In General, under Approvals, select Display Aliases.
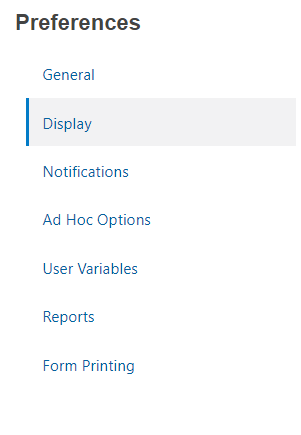
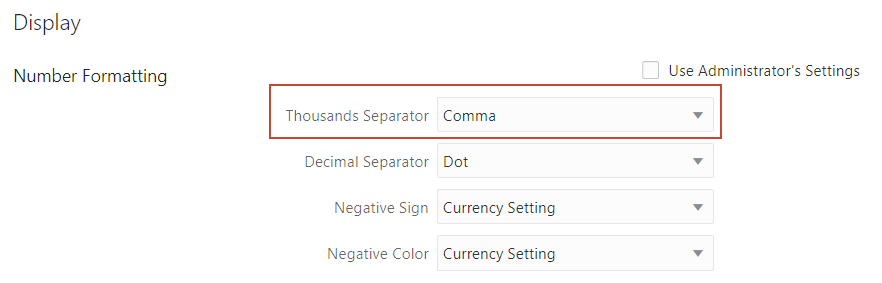
- On the left, under Preferences, click Display.
- Under Number Formatting, for Thousands Separator, ensure that Comma is selected.
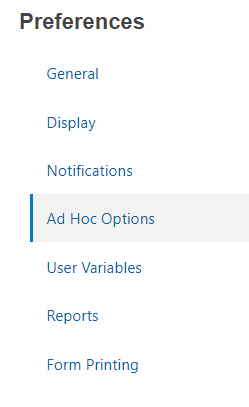
- On the left, under Preferences, click Ad Hoc Options.
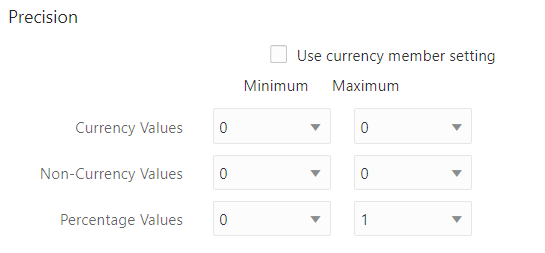
- Ensure the precision is set to:
Minimum Maximum Currency Values 0 0 Non-Currency Values 0 0 Percentage Values 0 1 Precision settings affect the value display only, not their stored values.
Setting values for user variables
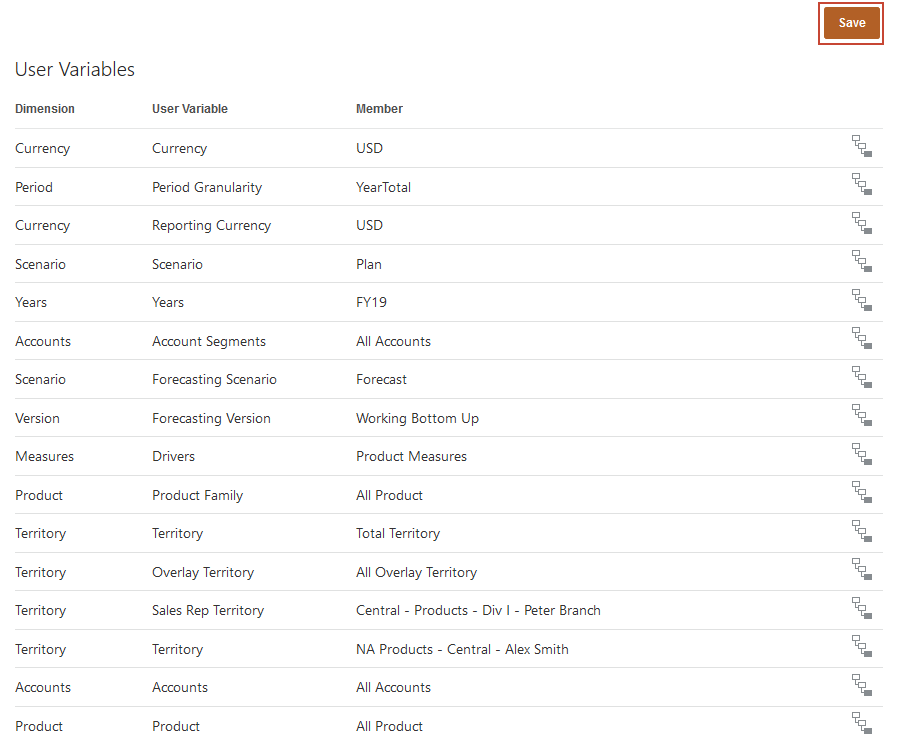
- On the left, under Preferences, click User Variables.
- For each variable, click its
 (Member Selector) to select a member as the variable's value:
Dimension User Variable Member Currency Currency USD Period Period Granularity YearTotal Currency Reporting Currency USD Scenario Scenario Plan Years Years FY19 Accounts Account Segments All Accounts Scenario Forecasting Scenario Forecast Version Forecasting Version Working Bottom Up Measures Drivers Product Measures Product Product Family All Product Territory Territory Total Territory Territory Overlay Territory All Overlay Territory Territory Sales Rep Territory Central - Products - Div I -Peter Branch Territory Territory NA Products - Central - Alex Smith Accounts Accounts All Accounts Product Product All Product If you selected to show aliases in Member Selector, the value listed in the Member column may vary. For example, for some dimensions, the prefix (OEP_ and OGS_) are not shown. For some territory members, instead of the numeric member name, the full alias name is displayed.
- Verify your selections, and click Save.
- In the Information message, click OK.
- Return to the home page. Click
 (Home).
Running predictions
You can create predictions for the rest of the year, based on year-to-date historical data.
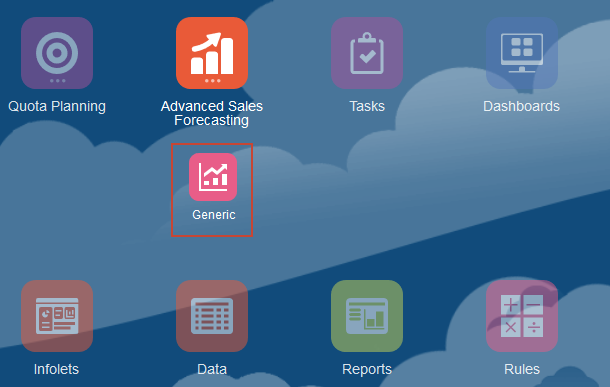
- On the home page, click Advanced Sales Forecasting, then Generic.
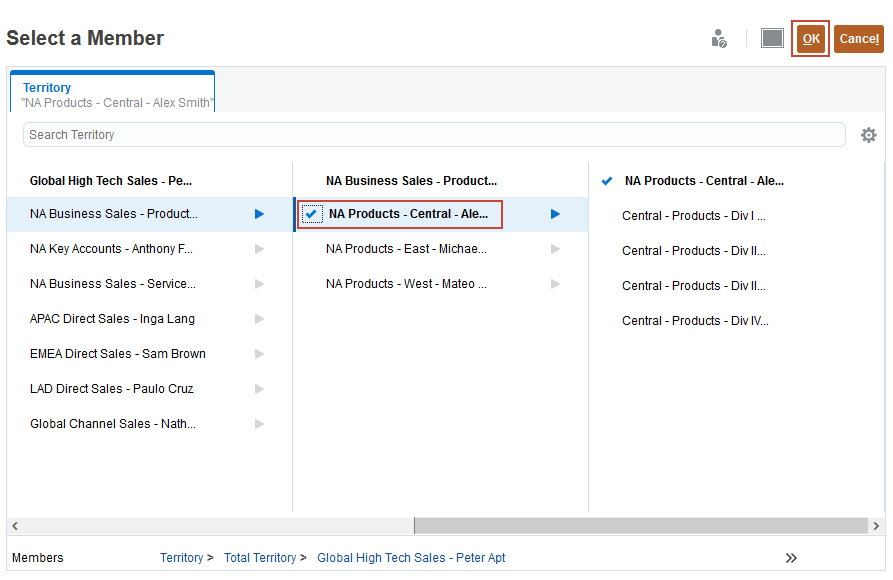
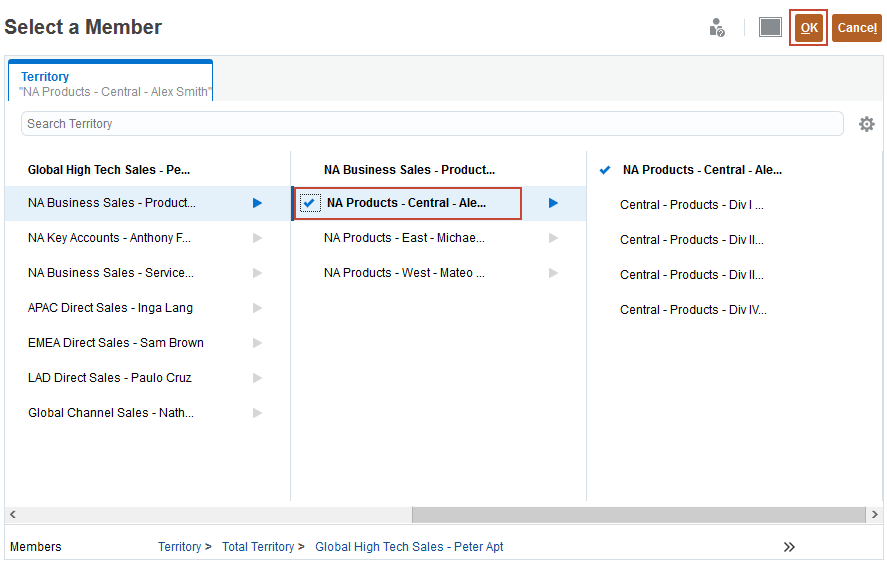
- In the POV, click Territory, select NA Products - Central - Alex Smith, and click OK.
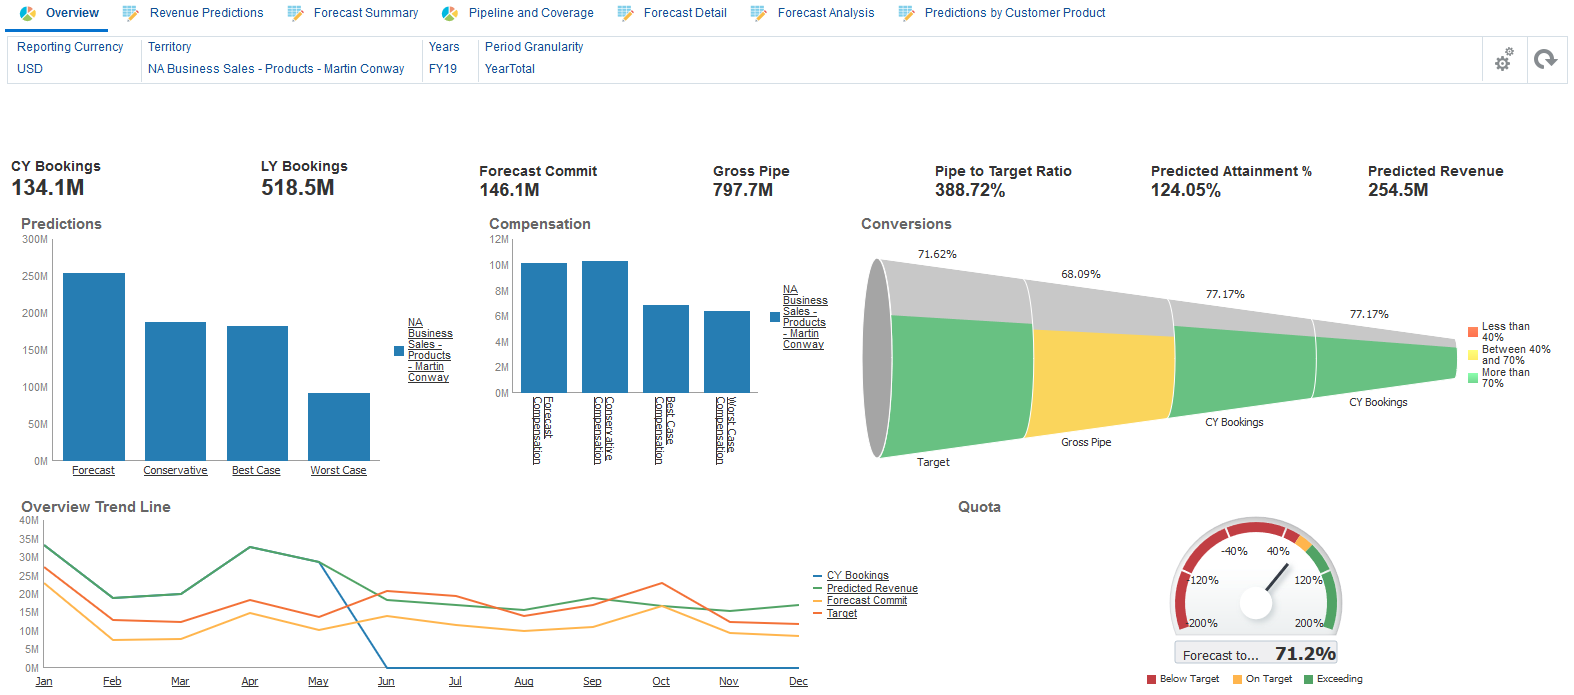
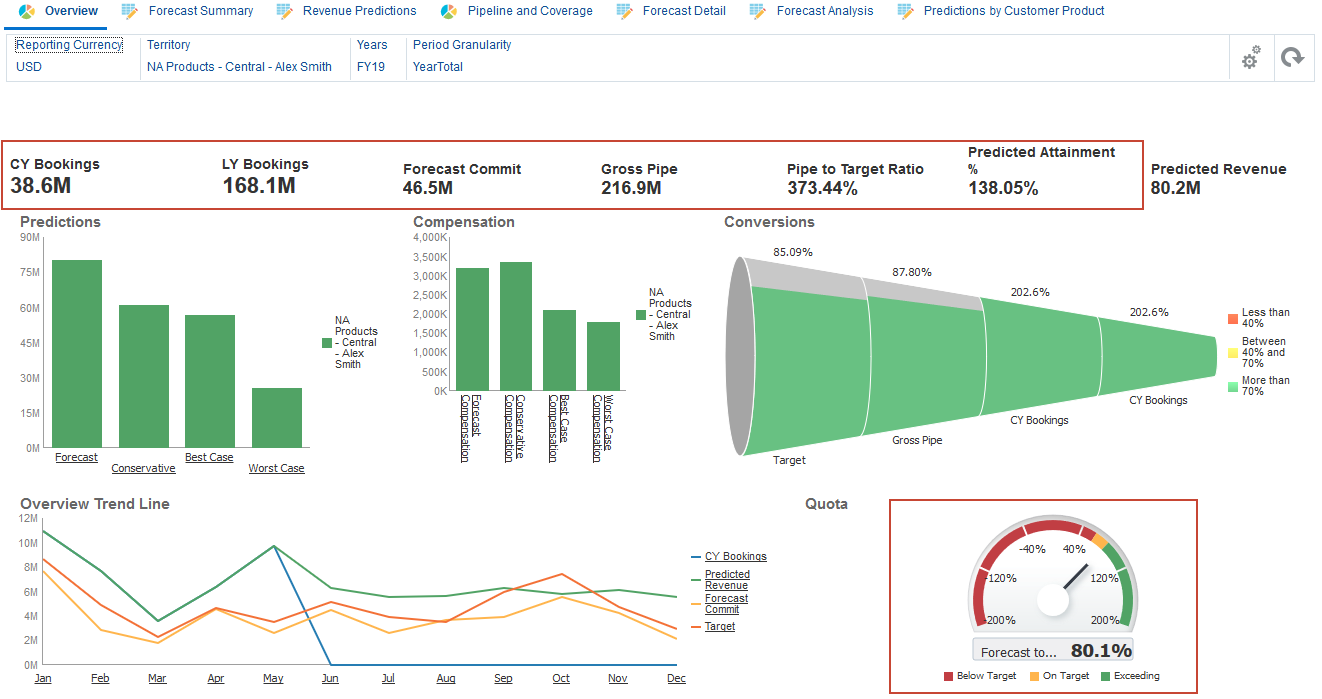
The Overview dashboard provides a snapshot of the current forecast for Alex Smith. Key measures such as Current Year Bookings to date, Last Year Bookings for the entire year, Forecast Commit, Gross Pipe, Pipe to Target, and Predicted Attainment (compared to target). The Forecast commitment is at 80% which is positive.
- Select the Revenue Predictions tab.

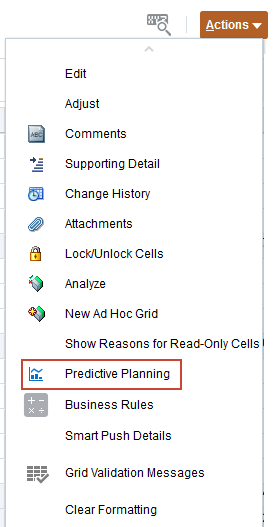
- To run predictions, click Actions, and select Predictive Planning.
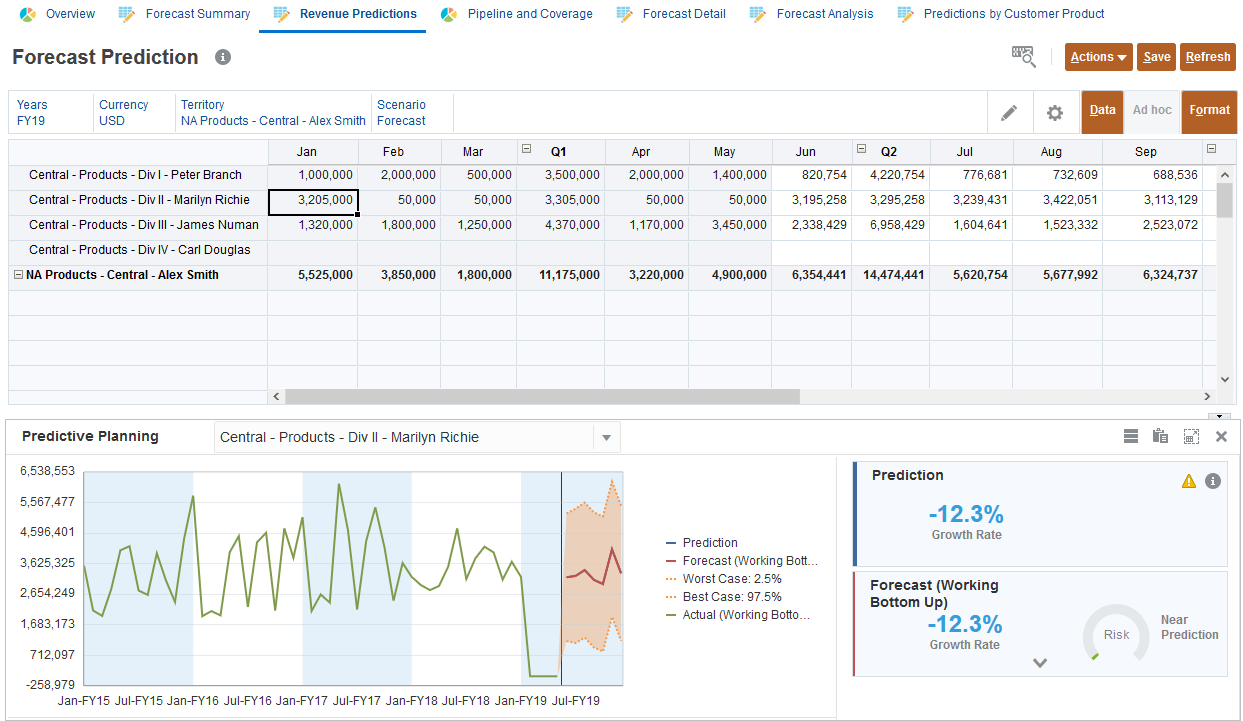
- Review the predictions displayed in the graph.
With Predictive Planning, historical data is retrieved and then analyzed using time series forecasting techniques to predict the future performance within the selected territory.

- In Forecast Prediction, for Central - Products - Div II - Marilyn Richie, select the data cell for Jan.
The prediction information is updated.
- In the POV, click Scenario, and under What-Ifs, select Best Case, and click OK.
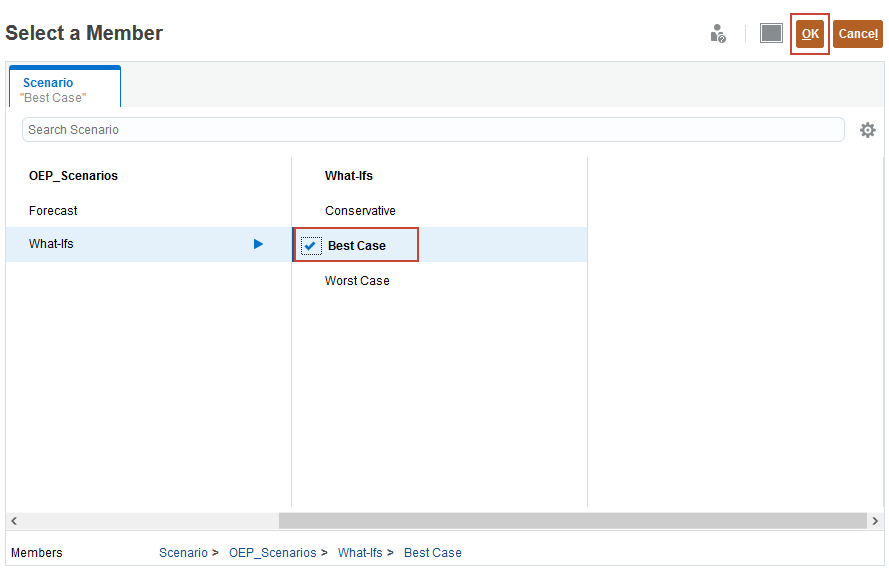
- Click
 (Go).
(Go).
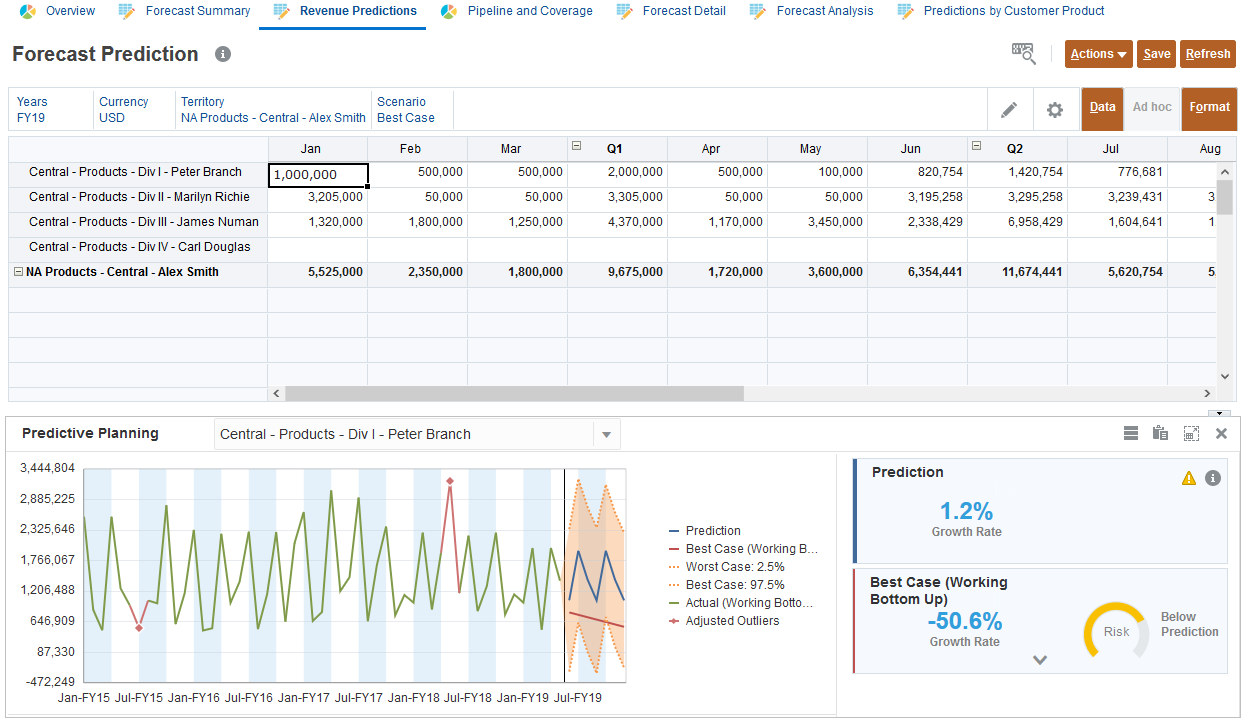
Predictions are run for the Best Case scenario. There is not much difference between Forecast and Best Case.
- In the Prediction area, click
 (Details).
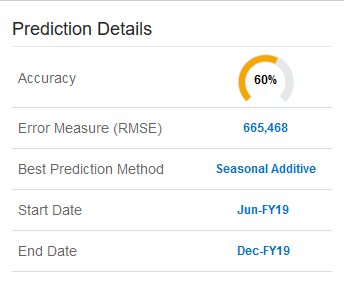
Depending on the data, the system predicts using the method with the greatest accuracy. To determine the prediction method, many factors are evaluated such as what historical data is available, and whether or not the data follows a trend or includes seasonality. Methods are described in the following table:
Method Seasonal Best Use Simple Moving Average No Volatile data with no trend or seasonality Double Moving Average No Data with trend but no seasonality Single Exponential Smoothing No Volatile data with no trend or seasonality Double Exponential Smoothing No Data with a trend but no seasonality Damped Trend Smoothing non-seasonal method No Data with a trend but no seasonality Seasonal Additive Yes Data without trend but with seasonality that does not increase over time Seasonal Multiplicative Yes Data without trend but with seasonality that increases or decreases over time Holt-Winters’ Additive Yes Data with trend and seasonality that does not increase over time Holt-Winters’ Multiplicative Yes Data with trend and with seasonality that increase over time Damped Trend Additive Seasonal Method Yes Data with a trend and with seasonality Damped Trend Multiplicative Seasonal Method Yes Data with a trend and with seasonality Arima No Data with minimum of 40 historical data points, limited number of outliers and no seasonality Sarima Yes Data with minimum of 40 historical data points, limited number of outliers and seasonality - Review the prediction details including the prediction method. The best prediction method is Seasonal Additive.
- Click outside Prediction Details to close it.
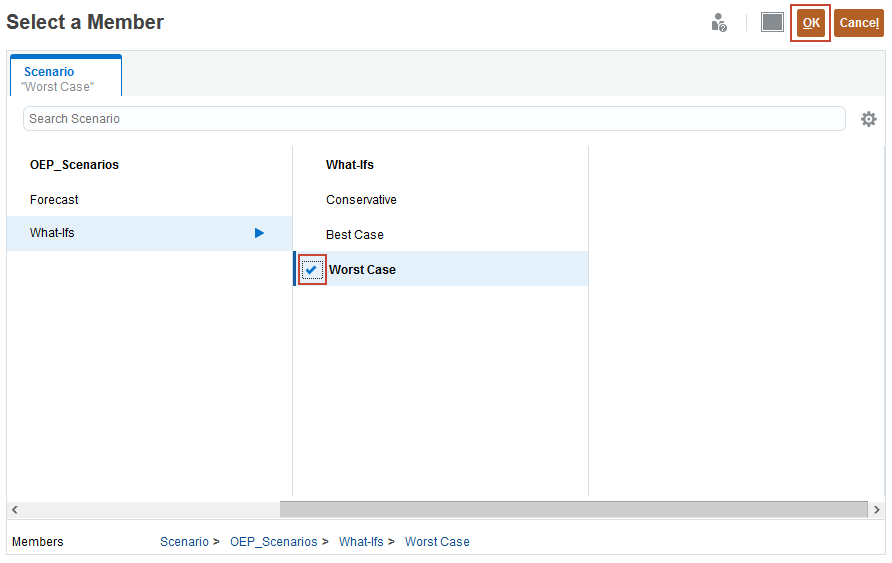
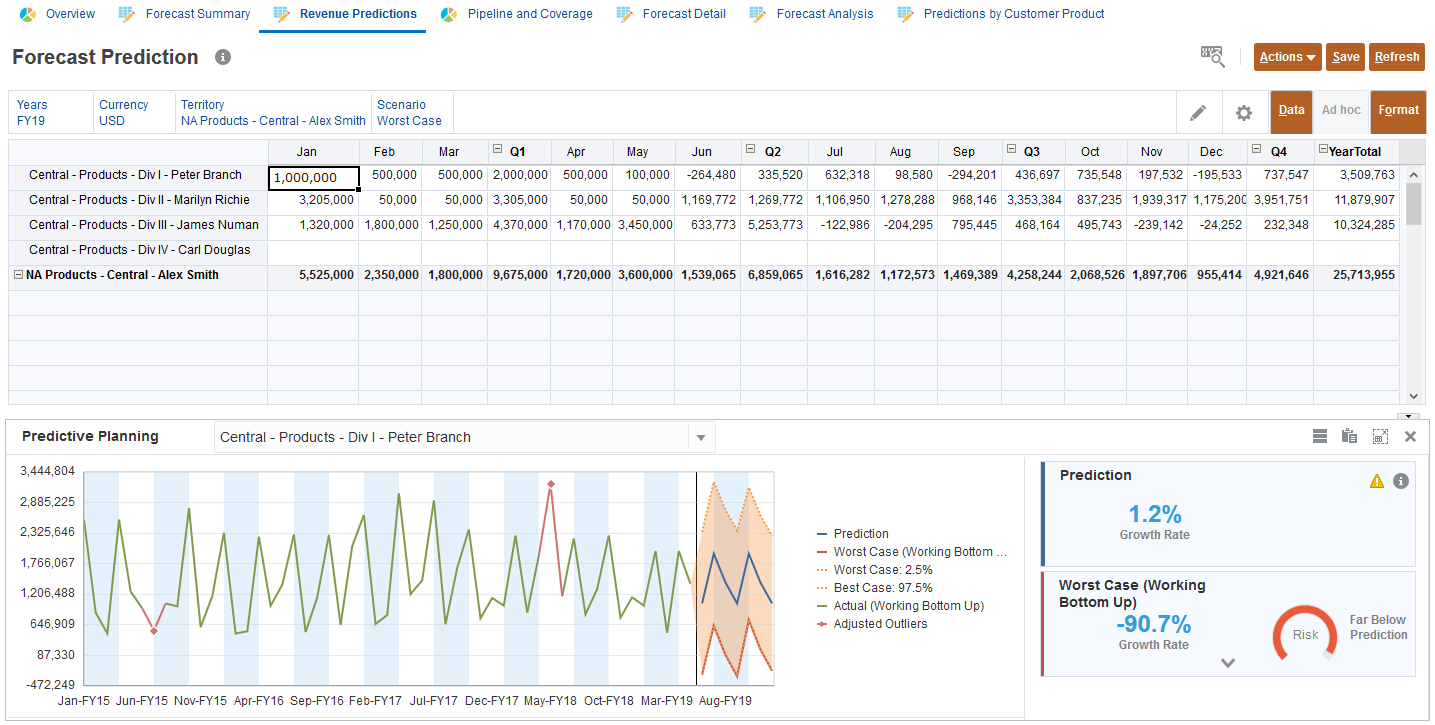
- In the POV, click Scenario, and under What-Ifs, select Worst Case, and click OK.
- Click (Go).
The prediction is run. Worst Case predicts an annual forecast of just 25 million. This is way too low.
Reviewing pipeline coverage
In this section, you review the pipeline coverage and the historical trend of the Gross Pipe. You also review the forecast summary to see the target, predicted revenue, forecast commitment, and forecast adjustments.
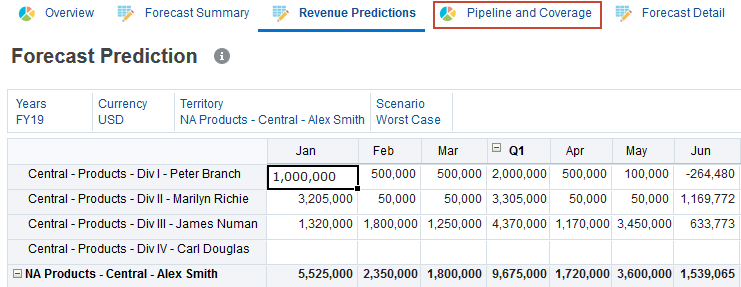
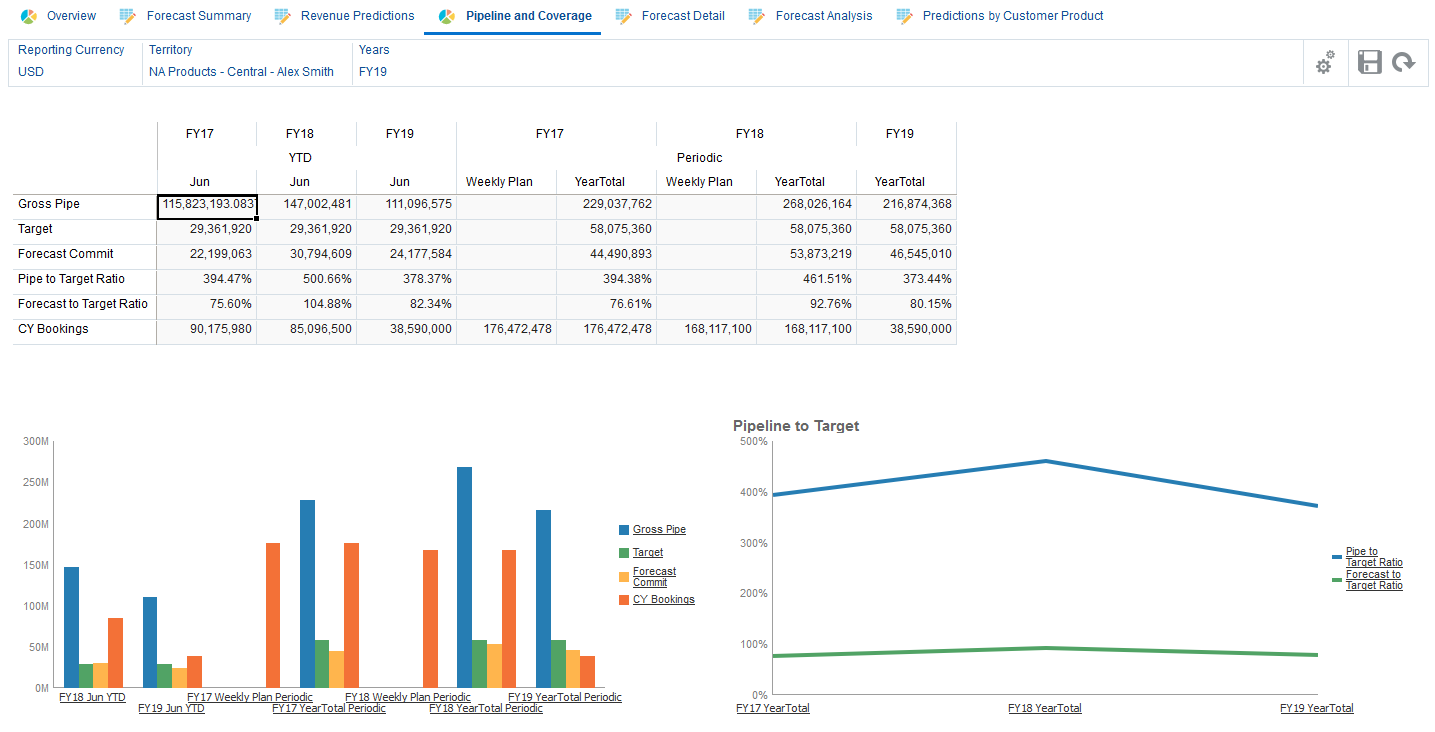
- Click the Pipeline and Coverage horizontal tab.
- Review the pipeline coverage and the historical trend of the Gross Pipe.
There is a dip in the current year's YTD pipeline. The team can either bring in the necessary pipe, or seek to get more opportunities.
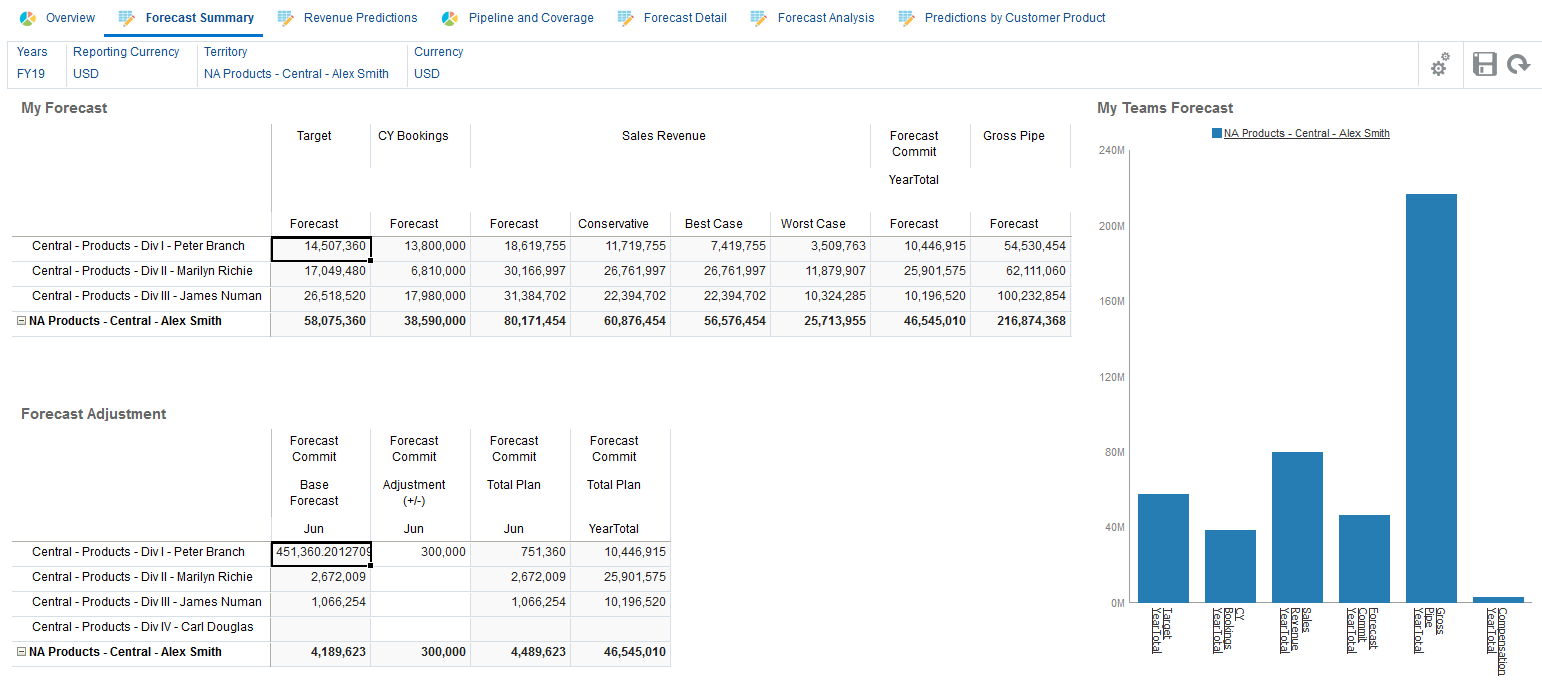
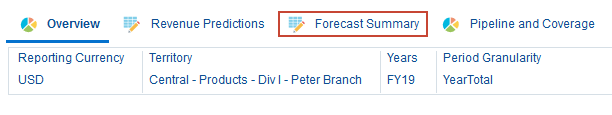
- Click the Forecast Summary tab.

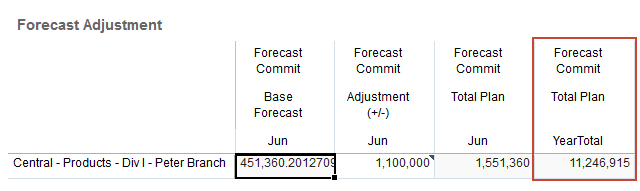
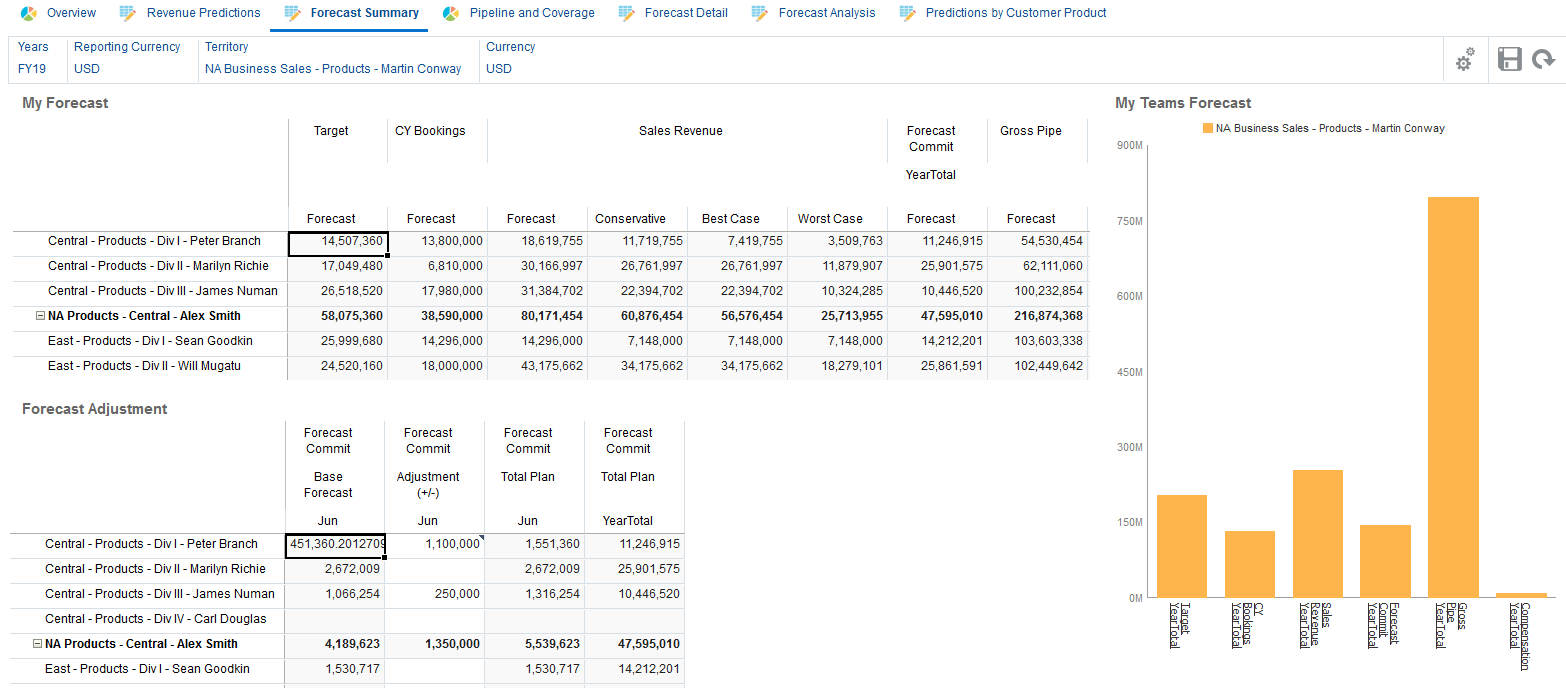
The dashboard summarizes all of the information in one place for the sales manager and sales reps to have a meaningful discussion and collaboration around the numbers. The base forecast was loaded from CRM in a summarized form which is displayed for each of the sales reps. There is a column for forecast adjustments that can be either done by the rep or the sales manager. The view shows other information such as Target, Predicted Revenue, and Forecast Commit.
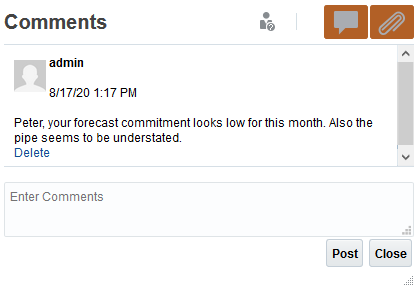
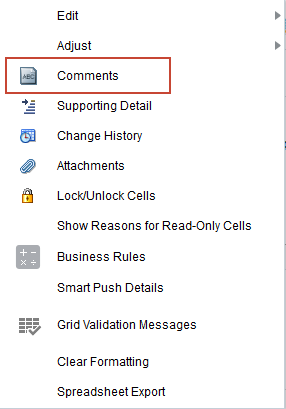
- In Forecast Adjustment, right-click Forecast Commit Adjustment for Peter Branch, and select Comments.
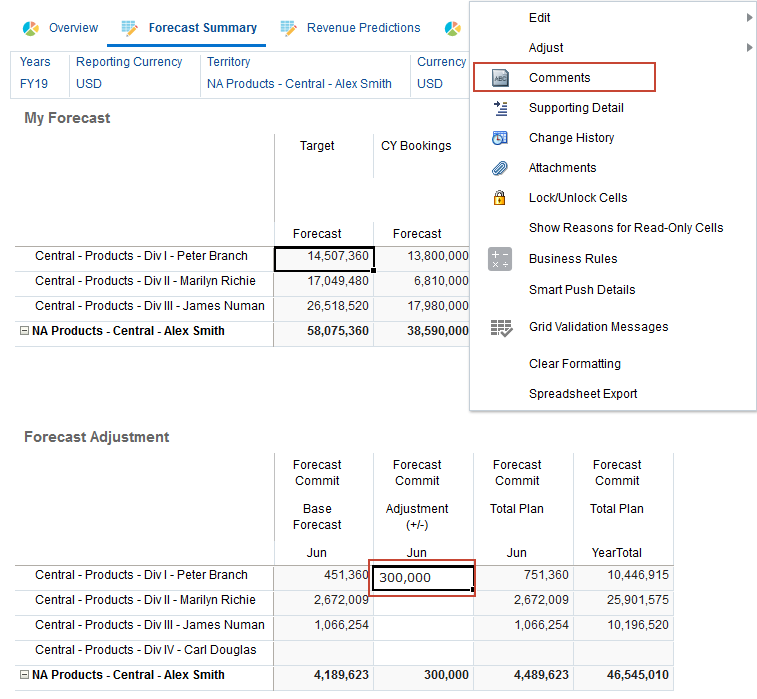
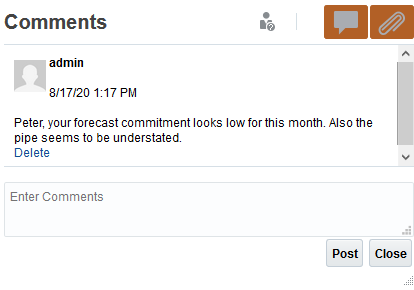
- In Comments, perform the following tasks:
- Enter the following text: Peter, your forecast commitment looks low for this month. Also the pipe seems to be understated.
- Click Post.
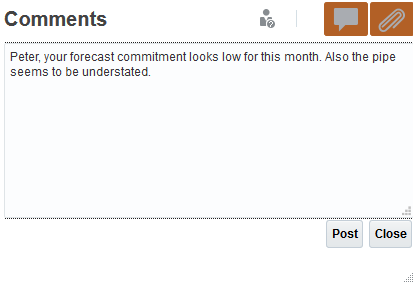
- Click Close.
Reviewing forecast details
You review manager feedback and make adjustment to the forecast commitment.
Reviewing manager feedback
In this section, you switch to the Quota Sales Rep navigation flow to simulate the sales rep reviewing and modifying forecast commitment.
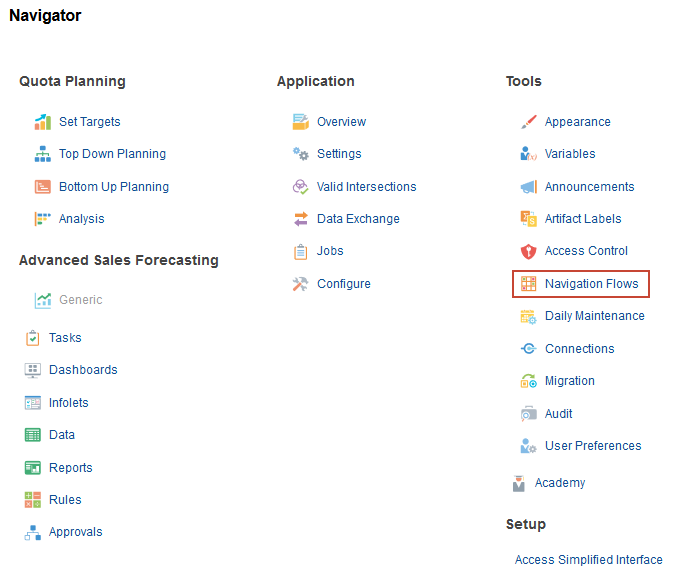
- Click (Navigator), and under Tools, select Navigation Flows.
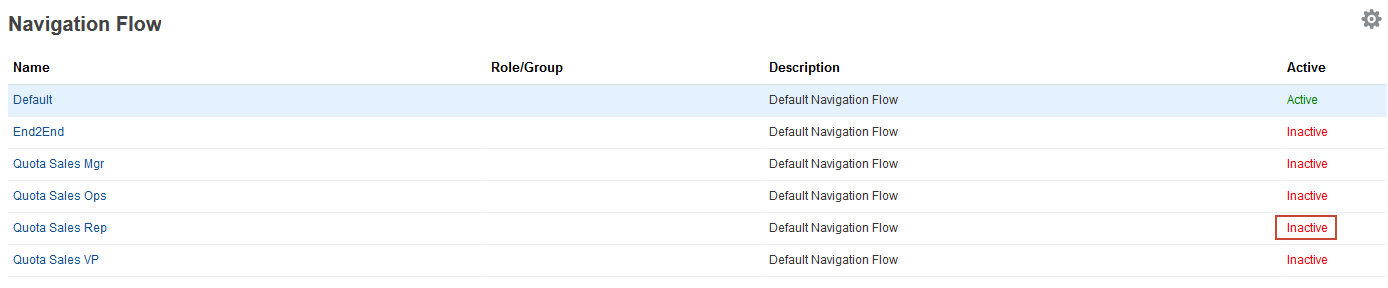
- For the Quota Sales Rep navigation flow, click Inactive to activate the navigation flow:
- Return to the home page. Click (Home).
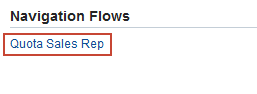
- In the upper right, to the left of your user name, click
 (Select Navigation Flow) and select Quota Sales Rep.
- On the home page, click Advanced Sales Forecasting, then Generic.

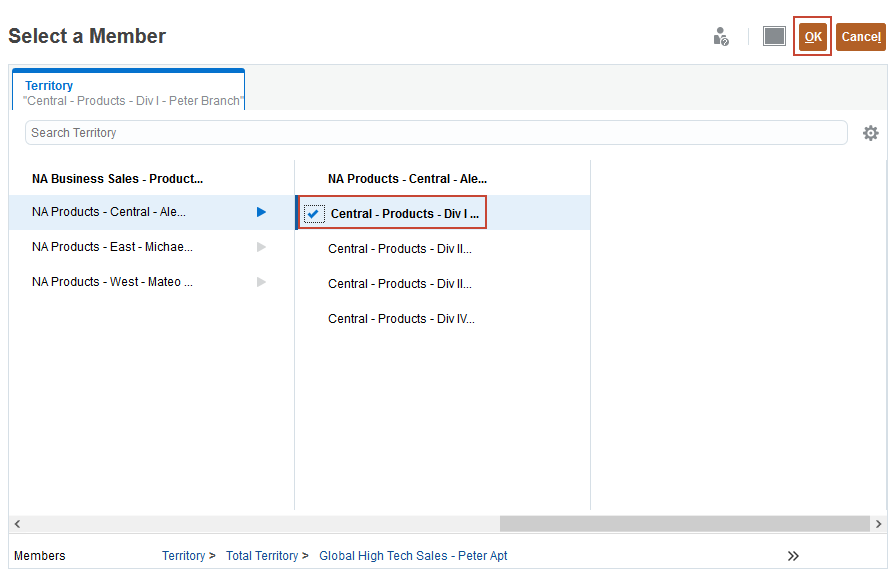
- In the POV, click Territory, select Central - Products - Div I - Peter Branch, and click OK.
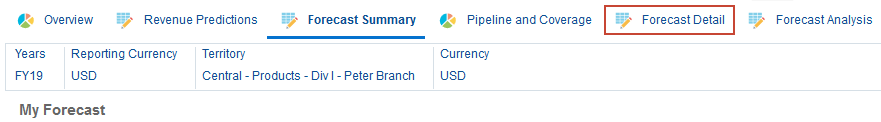
- Click the Forecast Summary tab.
- In Forecast Adjustment, right-click Forecast Commit Adjustment for Peter Branch, and select Comments.
- Review the comments, and click Close.
Reviewing forecast details by product segment and customer
As Peter, you check details about the forecast by Product / Account before you respond to Alex. Review the numbers on the Forecast Detail dashboard. You want to commit an extra 800K for Feb. You can enter forecast adjustments at the detail level or at the territory level. In this section, you adjust at the territory level.
- Click the Forecast Detail tab.
- Ensure the POV includes the following:
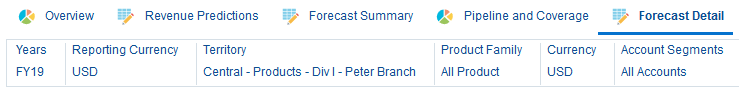
- In the lower form, in Adjustment, ensure the POV includes territory: Central - Products - Div I - Peter Branch, Measures: Sales Revenue, and Sales Channel: Direct.
If you have to select members in Adjustment, make sure you refresh by clicking
(Go). - Click the Forecast Summary tab.

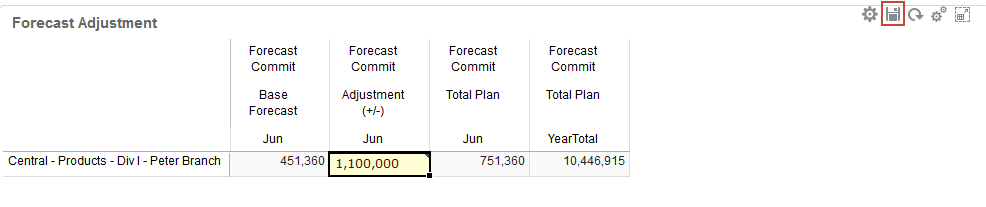
- In the Forecast Commit Adjustment for Jun column, enter 1.1m, and click
 (Save).
- In the Information message, click OK.
The forecast commitment is updated.
- Right-click Forecast Commit Adjustment Jun for Peter Branch, and select Comments.
- In Comments, enter the following: Adjusted committed forecast to 1.1 million, and click Post.
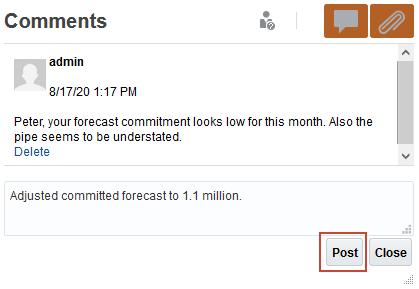
- Click Close.
Reviewing the regional forecast
You want to review the forecast as the sales manager so you change the POV to the Sales Manager, and review the forecast, and make additional adjustments.
- On the Forecast Summary form, in the POV, click Territory, select Alex Smith, and click OK.
- In Forecast Adjustment, for James Numan's Forecast Commit Adjustment Jun, enter 250k, and click (Save).

- In the Information message, click OK.
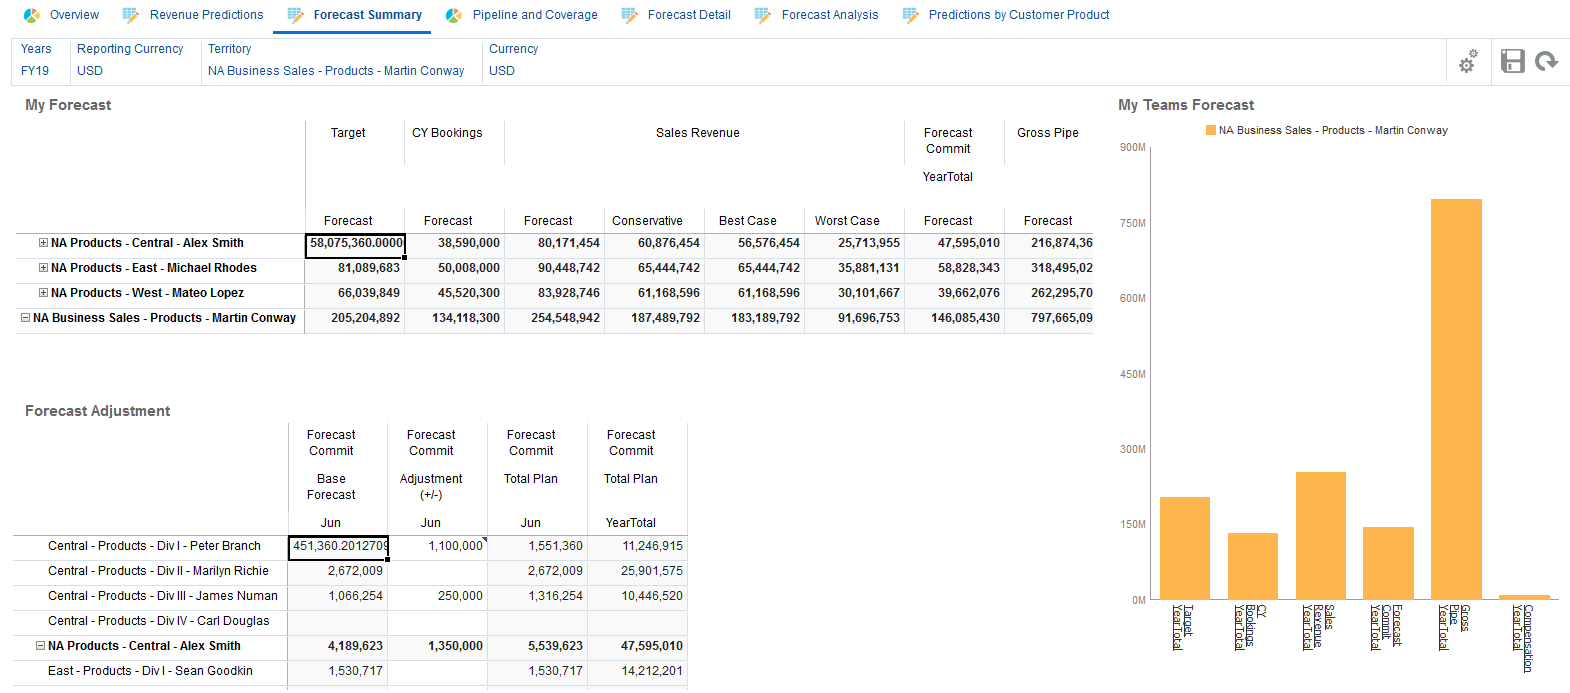
- The forecast is ready to send to Alex's manager, Martin Conway. In the POV, click Territory, select Martin Conway, and click OK.

- Review the Forecast Commitments.
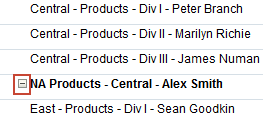
- For each of the Sales Managers, collapse the hierarchy by clicking
 (collapse). Collapse information for Alex Smith, Michael Rhodes, and Mateo Lopez.
Data is summarized by sales manager.
- Click the Overview tab.
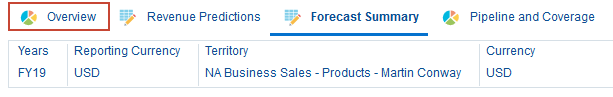
- Review the Overview Dashboard to get a complete picture of forecast commitment to target and other key performance indicators.