Before you begin
This 15-minute hands-on tutorial shows you how to analyze accounts by drilling down on output data to notice how values are calculated in Strategic Modeling, a solution provided by Oracle EPM Enterprise Planning. You investigate the details for calculations and you notice how account values roll up into parent accounts. You also make changes to input data and notice the impact on the output data. The sections build on each other and should be completed sequentially.
Background
Strategic Modeling provides on-the-fly scenario analysis and modeling with financial forecast modeling so that your operational plans, long range plans and financial strategy align.
The Strategic Modeling business process is comprised of one or more models. You perform long-term strategic planning within those models. Models contain predefined reporting and modeling standards, and are populated with a hierarchical chart of accounts, a time structure, reports, dataviews, account groups, and all the metadata from the template or the model from which it was created.
Every account uses a unique forecast method to project account values in future (forecast) time periods. Use Account Forecast to review or define the forecast method for accounts.
You can investigate the components that contribute to cell values. You determine how a value is calculated by using Audit Trail. From any cell, you can drill to notice the values that contributed to the cell value.
What do you need?
An EPM Cloud Service instance allows you to deploy and use one of the supported business processes. To deploy another business process, you must request another EPM Enterprise Cloud Service instance or remove the current business process.
- Have Service Administrator access to EPM Enterprise Cloud Service. The instance should not have a business process created.
- If you haven't already, register for a free Oracle Cloud Customer Connect account so you can access the required files. Upload and import this snapshot into your Planning instance.
For more information on uploading and importing migration snapshots, refer to the Administering Migration for Oracle Enterprise Performance Management Cloud documentation.
Reviewing data
Opening a model
You open a model to perform long-term strategic planning within that model.
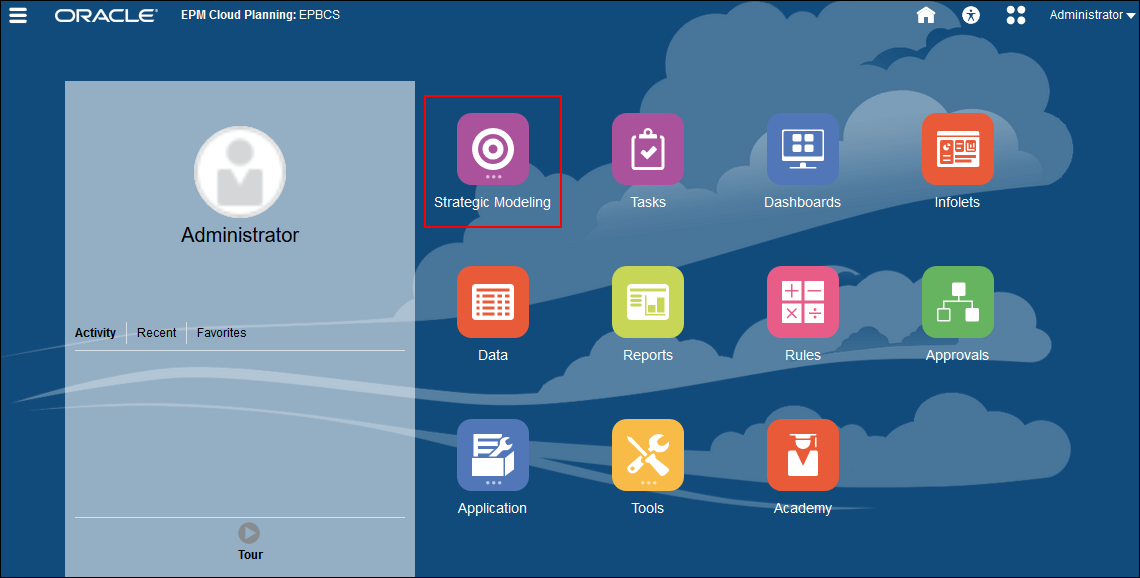
- On the Planning home page, click Strategic Modeling.
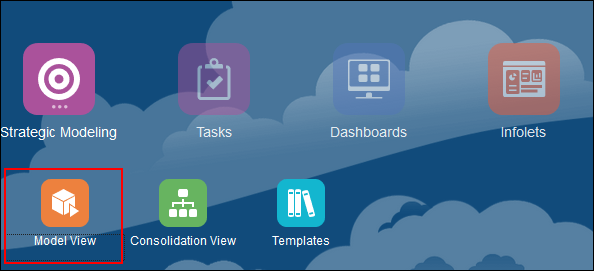
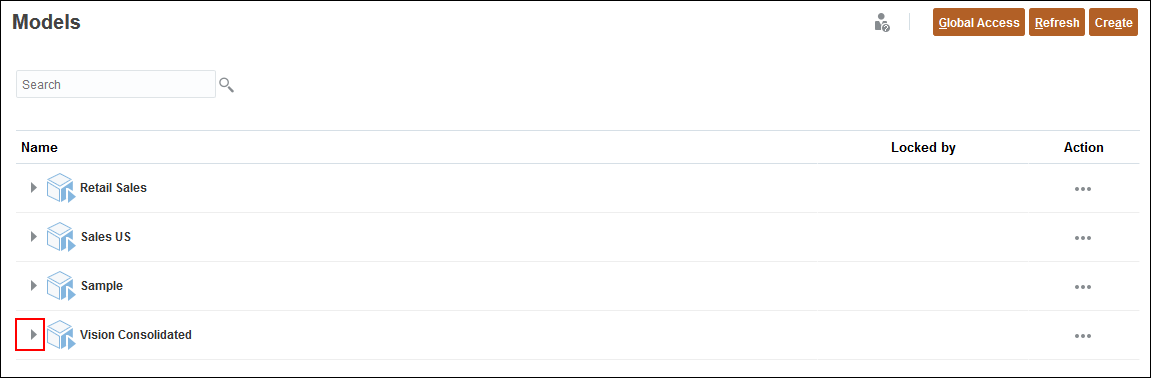
- Click Model View.
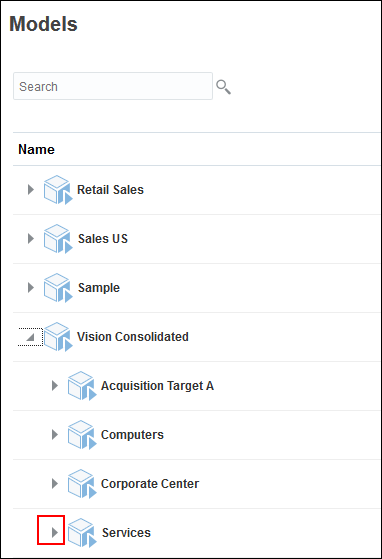
- Expand Vision Consolidated.
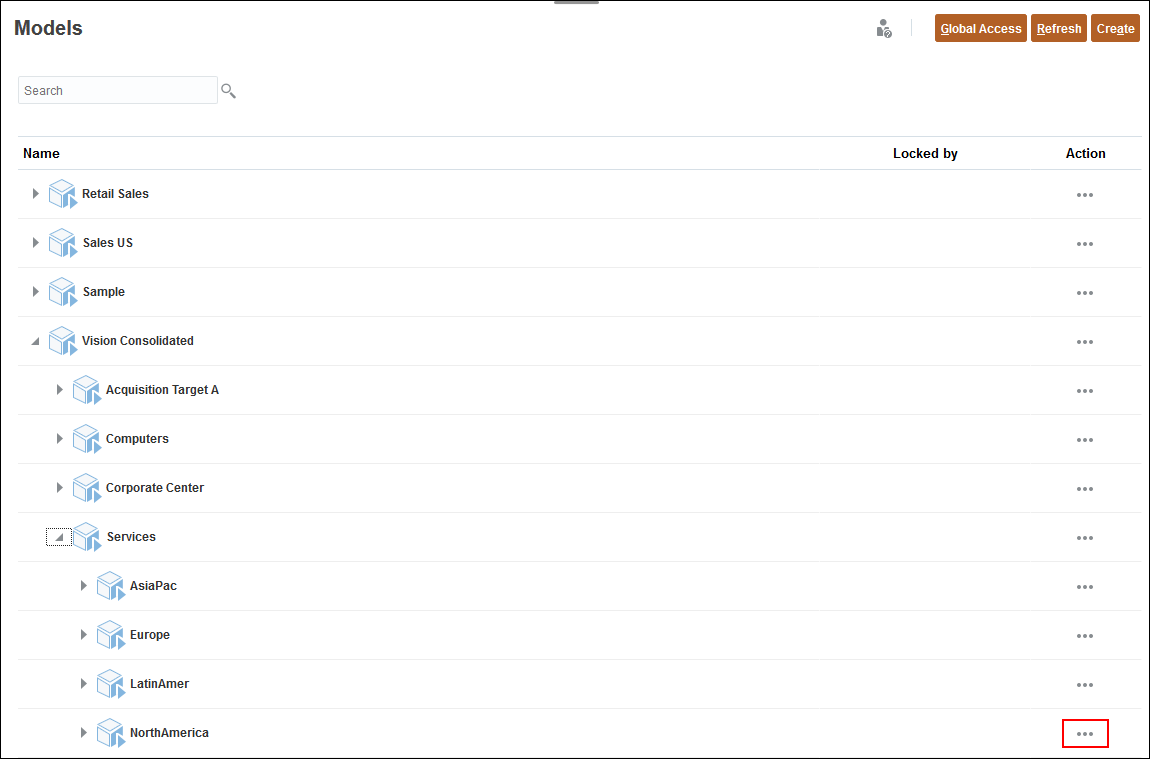
- Expand Services.
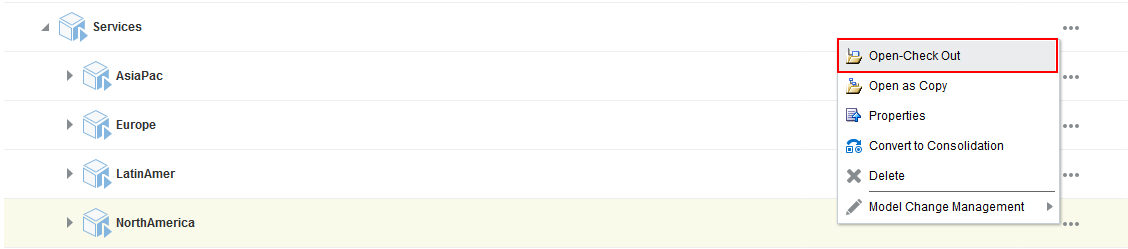
- For North America, click (...) Action.
- Select Open-Check Out.
Setting the POV
You set the POV to define the context for data.
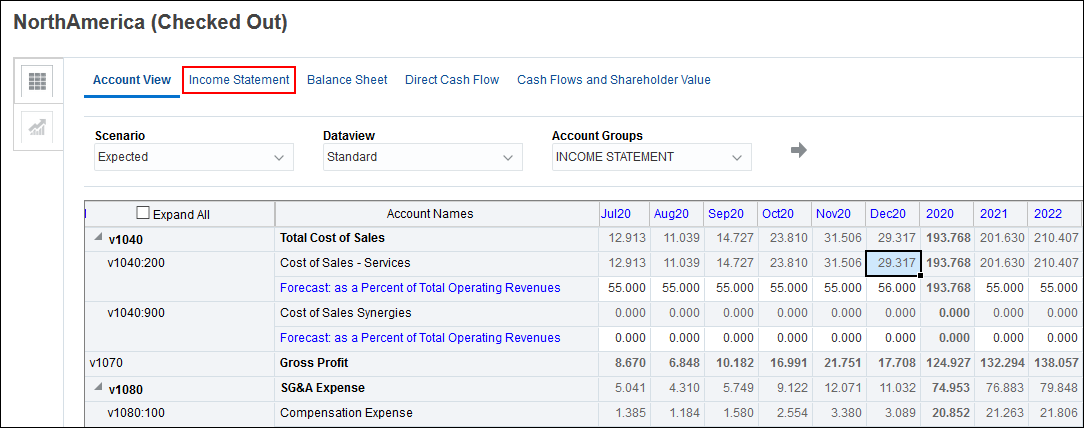
- On the Account View tab, ensure that the selected scenario is Expected, and the Dataview is Standard.
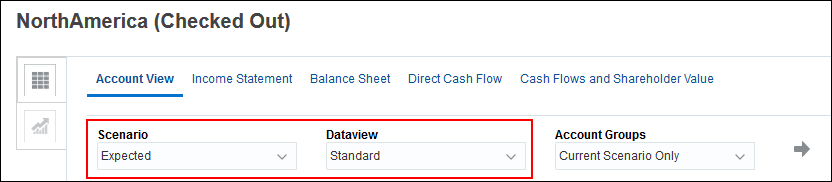
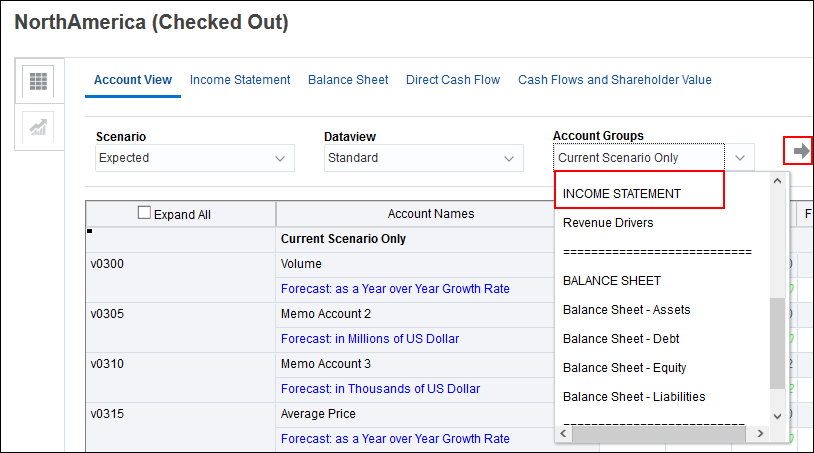
- For Account Groups, select INCOME STATEMENT and click
 (Refresh).
Drilling down on output values
You can drill down on the output value by selecting Audit Trail. You can audit accounts from a report or from the Account View.
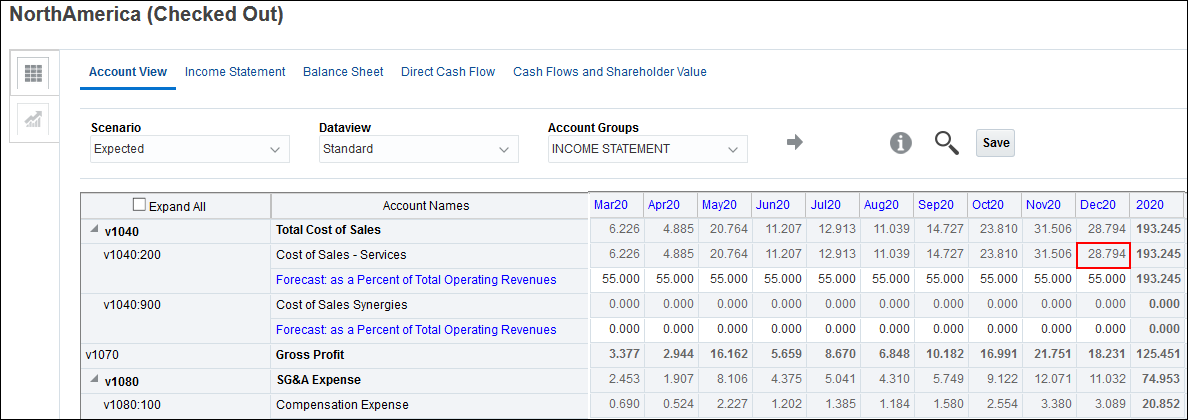
- Scroll down and right so that v1040 is close to the top, and so that 2023 is visible as the right-most column.
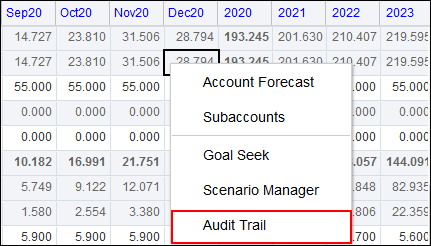
- Right-click Cost of Sales – Services (v1040.200) for Dec 20 (28.794).
- Select Audit Trail.
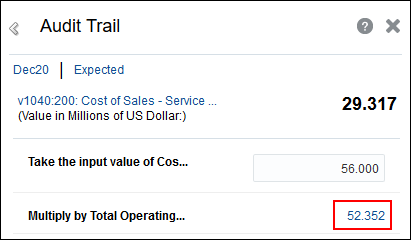
- Notice that Cost of Sales is calculated by multiplying the input value of cost of sales by the total operating revenue.
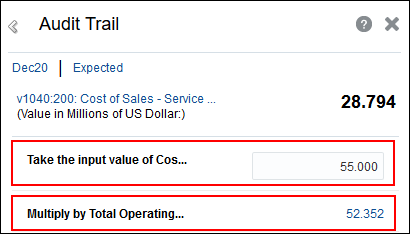
The input value of Cost of Sales is defined as a percentage. So if you multiply Total Operating Revenues by that input value, you can calculate Cost of Sales – Services.
Modifying data
When you analyze your data, you can also make changes to your input data.
Changing input values
Changing input values impacts any calculations for which that value is included.
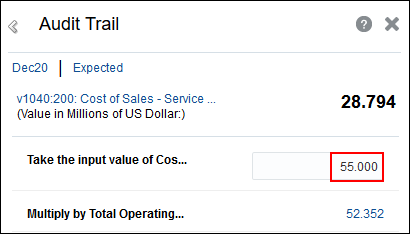
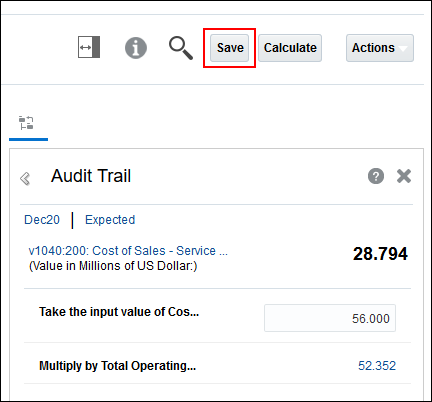
- Click on the input value of Cost of Sales – Services (55), and change 55 to 56 and enter.
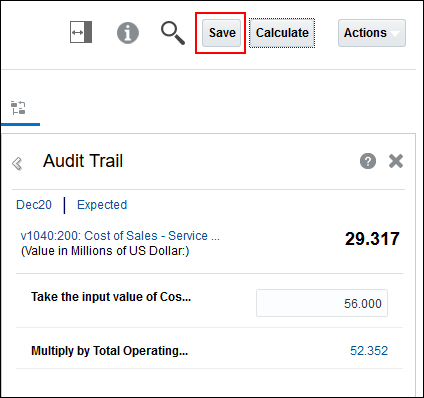
- Click Save.
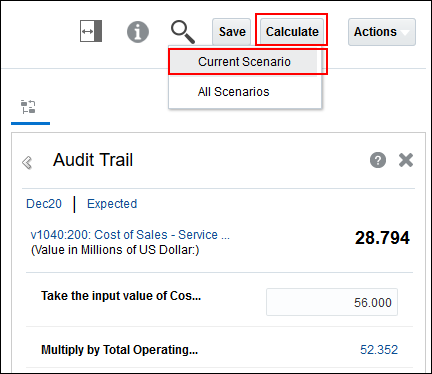
- Click Calculate and select Current Scenario.
- Click Save.
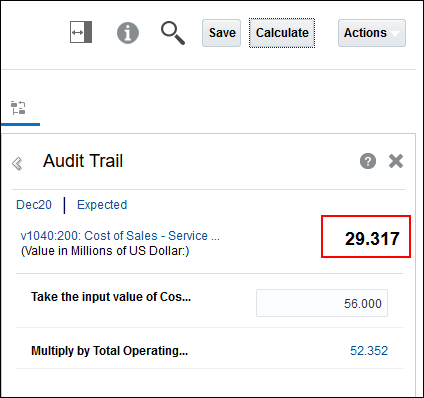
- Review the updated output data.
Analyzing Operating Revenue
You can drill down further on an account to notice how it is calculated.
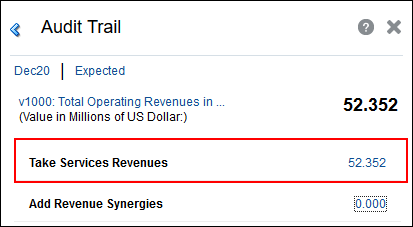
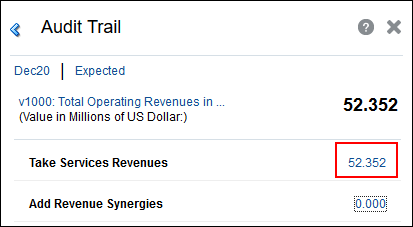
- Click the value 52.352 for Total Operating Revenue.
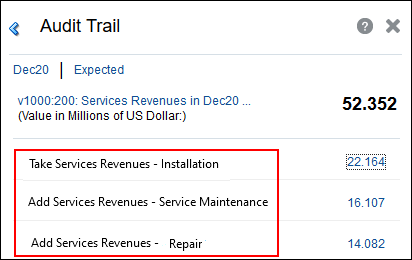
- Click 52.352 for Services Revenue.
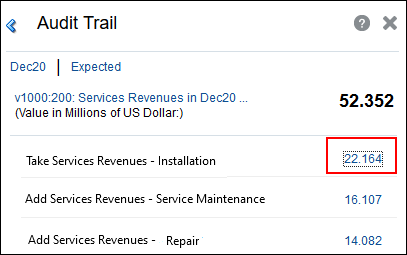
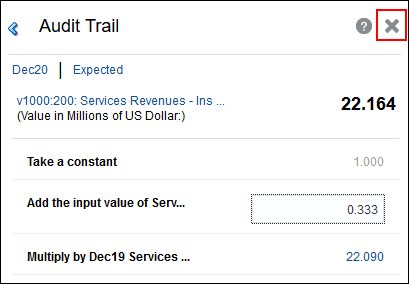
- Click on 22.164 for Services Revenue – Installation.
- Click X to close the Audit Trail dialog box.
When you drill down on Total Operating Revenue, notice that Services Revenues is a component of the calculation.
When you audit Services Revenues, notice that it has three components – Installation, Service Maintenance, and Repair.
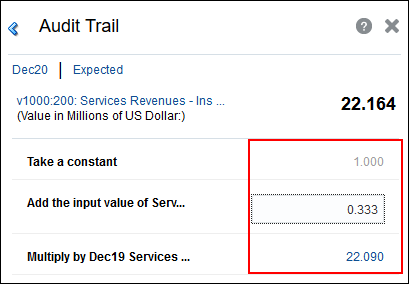
Installation Revenue for 2020 is calculated by taking the 2019 value for the same account and increasing it by .00333. (1/3 of 1%).
Analyzing data from reports
You can also analyze data from a report such as the Income Statement.
- Click the Income Statement tab.
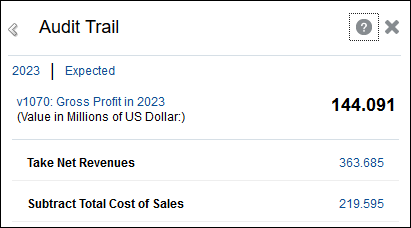
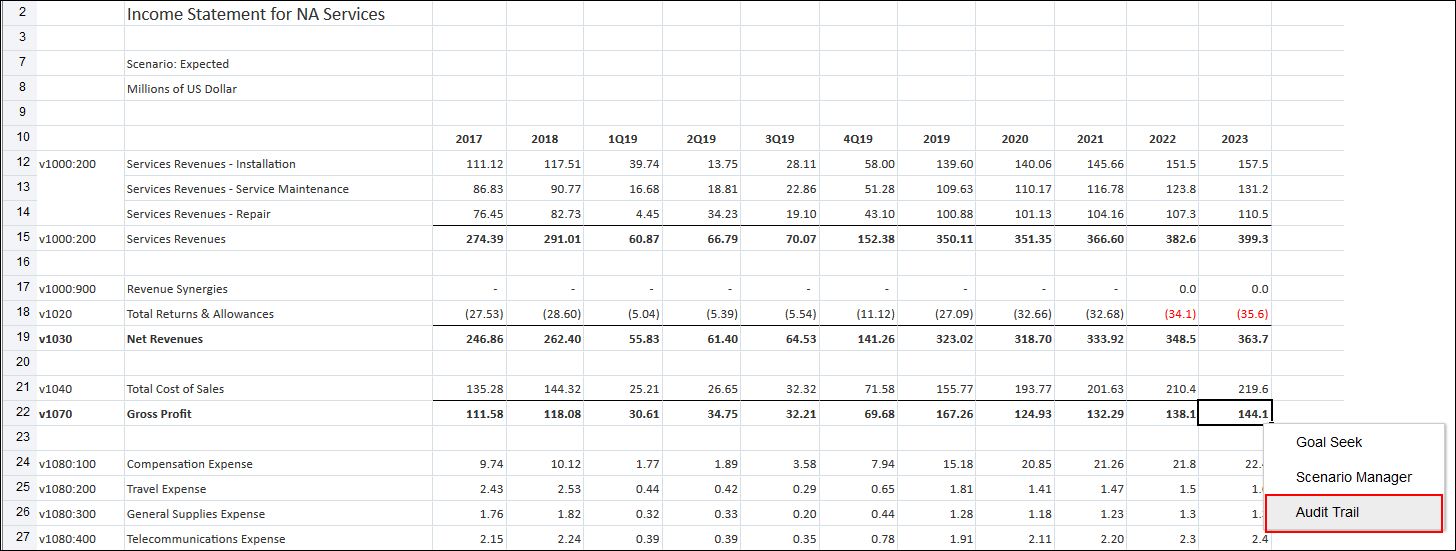
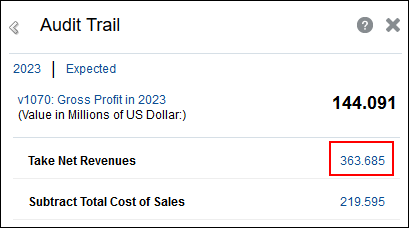
- Right-click Gross Profit for the year 2023, and select Audit Trail.
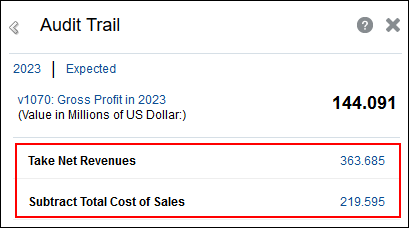
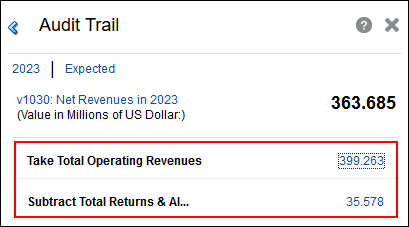
- Drill down on Net Revenues by clicking its value (363.685).
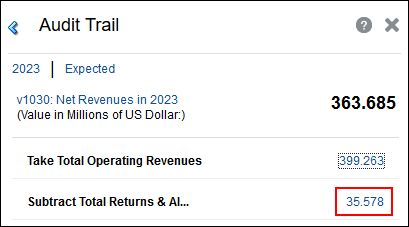
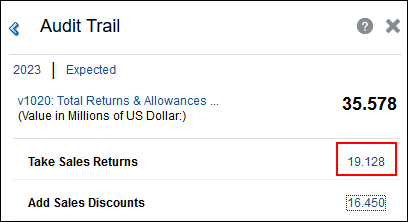
- Drill down on Total Returns and Allowances (35.578).
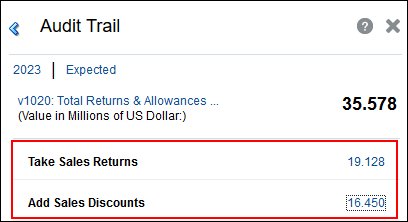
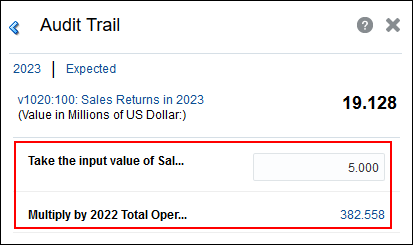
- Drill down on Sales Returns by clicking on 19.128.
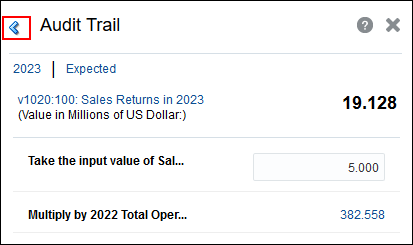
- Click the blue left arrow to review and return to any step you took while drilling down.
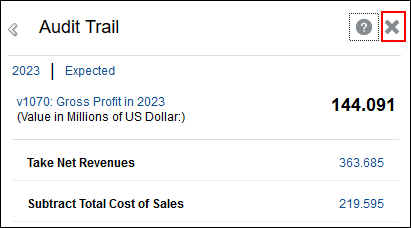
- Click v1070: Gross Profit in 2023.
- Click X to close the Audit Trail dialog box.
Gross Profit is calculated by subtracting total cost of sales from net revenues.
Net Revenue is comprised of Total Operating Revenues minus Total Returns and Allowances.
Total Returns and Allowances is comprised of Sales Returns and Sales Discounts.
Sales returns are a percentage of the previous year’s total operating revenue.
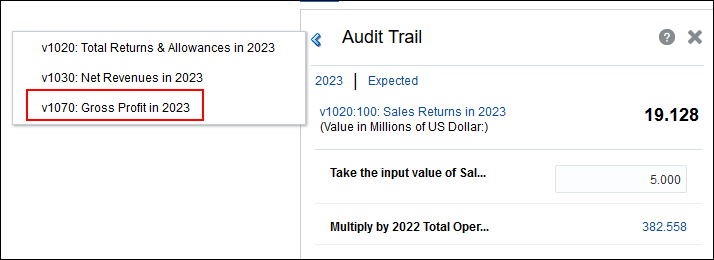
You navigated back to the audit trail for Gross Profit.