Before You Begin
Purpose
You can create a cube from data in a Microsoft Excel spreadsheet. You build the Essbase cube using the Cube Designer Transform Data option. From Oracle Smart View for Office, you connect to Oracle Analytical Cloud - Essbase. You also analyze the cube using Smart View ad hoc analysis.
Time to Complete
30 minutes
Background
The data is transformed on the Oracle Essbase sever, used by Oracle Analytics Cloud - Essbase, when you select the Cube Designer Transform Data option. The data from Excel spreadsheet is changed into hierarchical multi-dimensional data. The transform data option automatically identifies relationship among columns, and assists in building an Essbase cube with the relevant dimensions and their hierarchies. The transform identifies mesaures and creates dimensions.
What Do You Need?
You need the following to complete the steps in this tutorial:
Oracle Smart View for Office
Oracle Analytics Cloud - Essbase
Oracle Smart View Cube Designer extension for Oracle Analytics Cloud - Essbase
Microsoft Excel
Windows operating system
You need the following to connect to Oracle Analytics Cloud - Essbase to support Cube Designer:
Service URL for Oracle Analytics Cloud - Essbase Service
User Name
You must have a Power User or Administrator role.
Password
Connecting to Oracle Analytics Cloud - Essbase
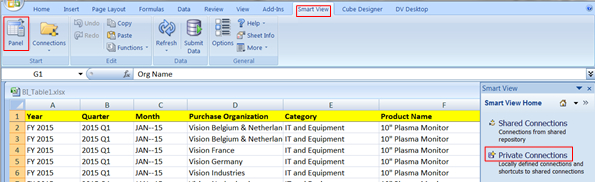
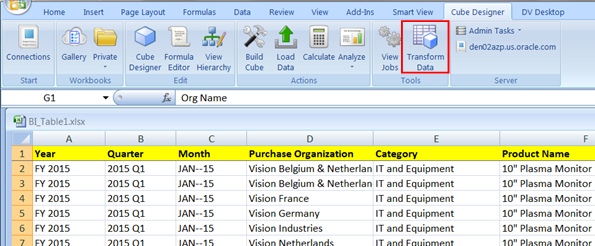
Download and save the B1_Table1.xlsx spreadsheet to your hard drive.
Open B1_Table1.xlsx with Microsoft Excel.

Description of this image Click the Smart View ribbon, and click Panel. In the Smart View Home panel, select Private Connections.
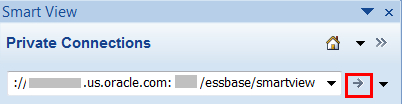
Description of this image In the Private Connection field, enter the URL for your Oracle Analytics Cloud - Essbase service with essbase/smartview appended to the URL, and click the arrow.
The URL in the image is only an example. However, you must append essbase/smartview to your service URL.
Description of this image Sign in to Oracle Analytics Cloud - Essbase with your User name and Password.

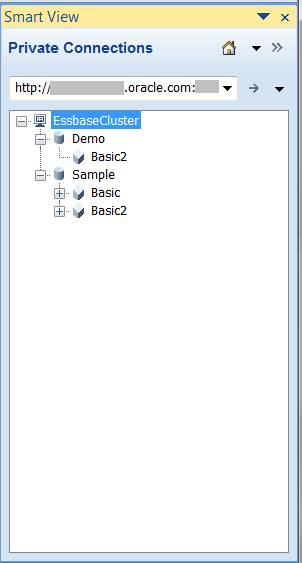
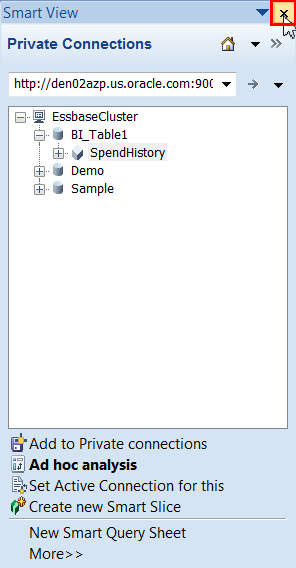
Description of this image The Essbase cluster in your environment is displayed in the Smart View Private Connections panel.
Description of this image
Creating a Cube
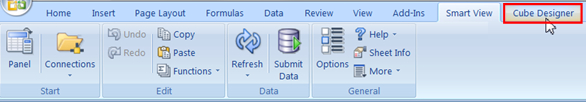
Click the Cube Designer ribbon.
Description of this image In the Cube Designer ribbon, click Transform Data.
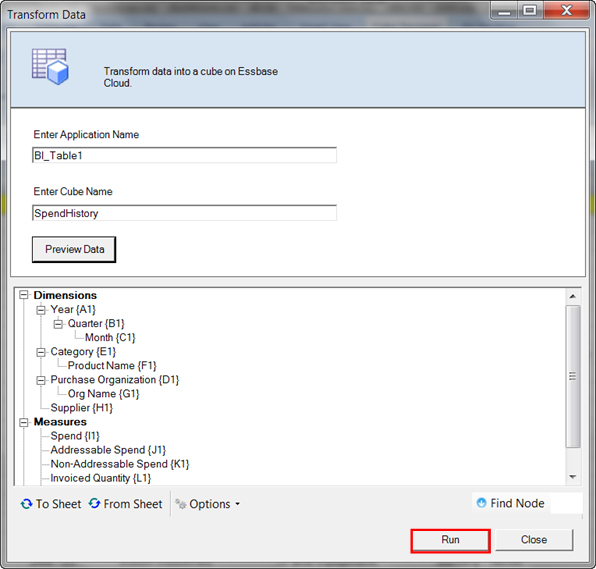
Description of this image In the Transform Data dialog, verify that the B1_Table1 spreadsheet is listed in the Enter Application Name field. In Enter Cube Name use SpendHistory as the name, and then click Preview Data.

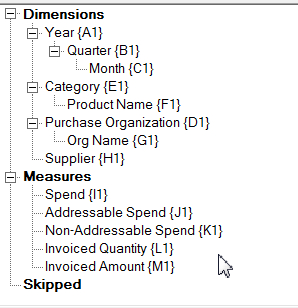
Description of this image The data transformation preview results show the measures and dimensions.
Description of this image In Transform Data, click Run.
Description of this image In the Transform Data message dialog that asks, Do you wish to build this cube?, click Yes.

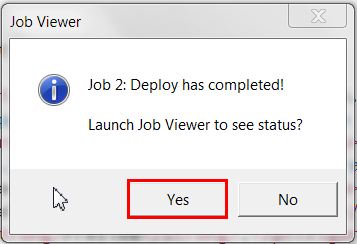
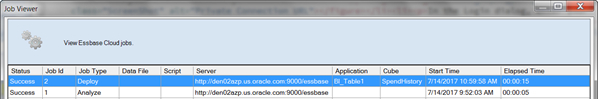
Description of this image In the Job Viewer dialog, click Yes to launch the Job Viewer and to see the job status.
Description of this image The Job Viewer shows that the Deploy and Analyze data tasks were successful.
Description of this image The SpendHistory cube is added to the Essbase cluster.

Description of this image
Querying the Cube
In this section, you continue to use the SpendHistory cube that you created in the previous section, create an ad hoc query grid, and zoom in on the dimensions.
Add a new sheet to the B1_Table.xslx spreadsheet, and then select the SpendHistory cube in the Essbase cluster.

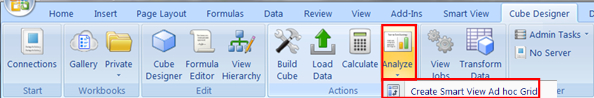
Description of this image Click the Cube Designer ribbon, click Analyze, and select Create Smart View Ad hoc Grid.
Description of this image There are no visible changes to the spreadsheet or cube as the result of this step.
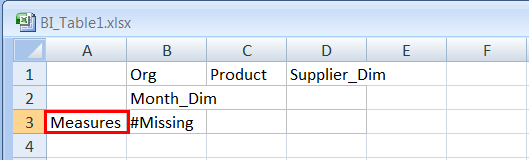
In the Smart View panel, select the SpendHistory cube, and click Ad hoc analysis.

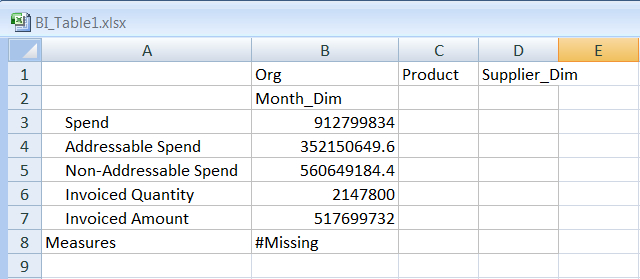
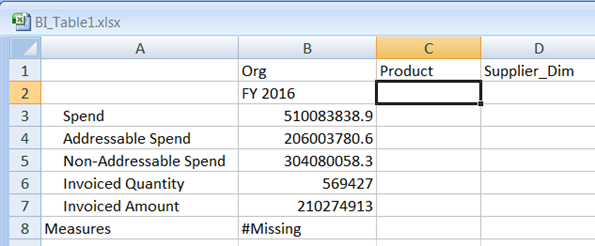
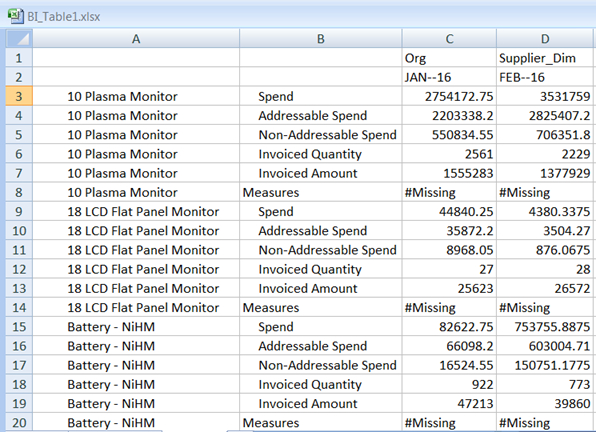
Description of this image The results show #Missing in the Measures row.
Description of this image Close the Smart View panel.
Description of this image In the spreadsheet, double-click Measures.
Description of this image The spreadsheet shows values for amounts spent and invoiced.
Description of this image In the spreadsheet, double-click Month_Dim.
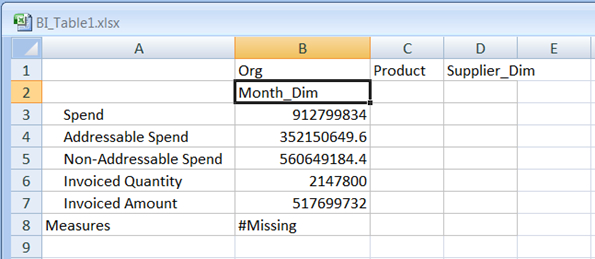
Description of this image The spreadsheet shows values for the fiscal year (FY) 2015 and 2016, and month dimension values.
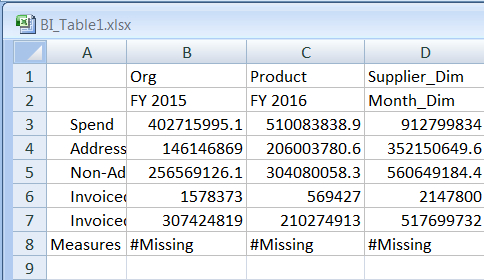
Description of this image Select the cell containing FY 2016, and then select the Essbase tab.

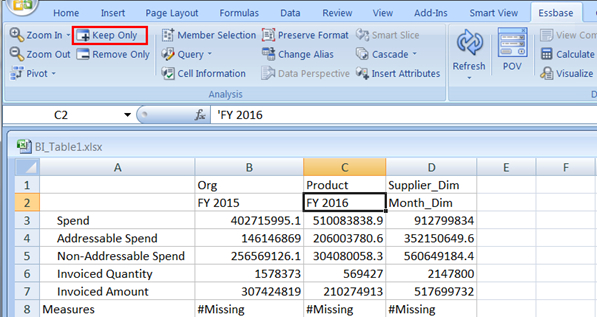
Description of this image In the Essbase ribbon, click Keep Only.
Description of this image If prompted, sign in to Oracle Analytics Cloud - Essbase.
The result shows the remaining FY 2016 values, while the FY 2015 and the month dimension values are no longer in the spreadsheet.
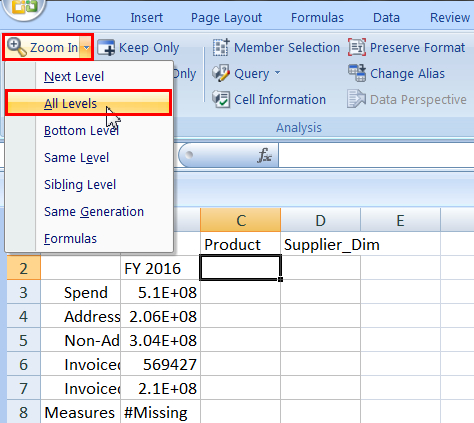
Description of this image Select the FY 2016 cell, then in the Essbase ribbon, select the Zoom In list, and click All Levels.
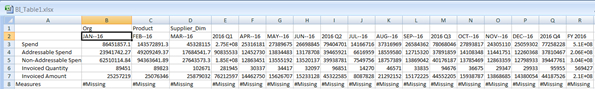
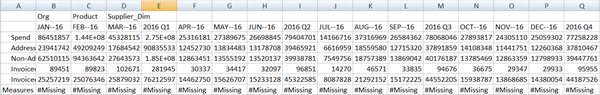
Description of this image The results show values for each month and quarter of fiscal year 2016.
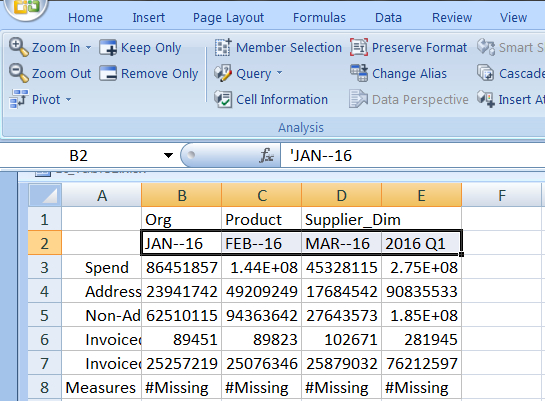
Description of this image Select the cells, Jan-16 through 2016 Q1, and then click Keep Only.
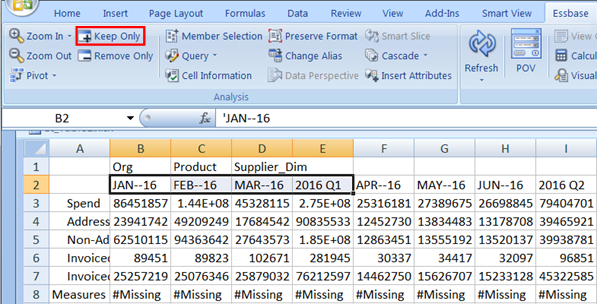
Description of this image The Keep Only command preserves the selected columns and removes the columns that weren't selected.
Description of this image To undo the query, select the Smart View tab, and click Undo.

Description of this image Undo reverses the last change that you made to the data.
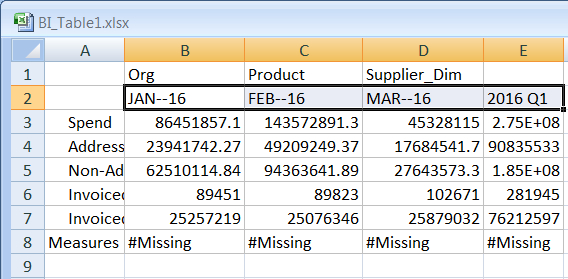
Description of this image In the Smart View ribbon, click Redo.

Description of this image After selecting Redo, your results should shows the months in Q1 and the Q1 rollup column.
Description of this image To save your data, connect to Oracle Analytics Cloud - Essbase, click the Smart View ribbon, and click Submit Data.
If prompted to log in, enter your credentials.
Getting Multidimensional Views of Data
In this section continue using B1_Table1 application and the SpendHistory cube.
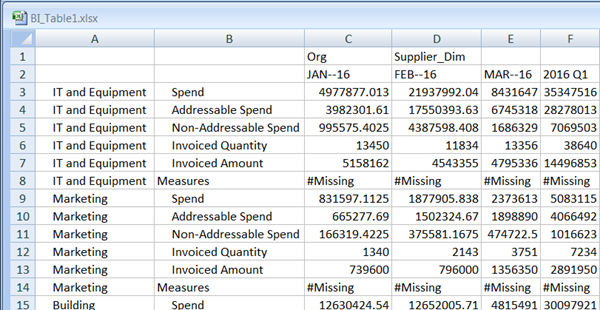
Click the Essbase ribbon, and double-click Product.

Description of this image Column A shows the results from using double-click to zoom in on Product.
Description of this image Select IT and Equipment, and then on the Essbase ribbon, click Zoom In.

Description of this image Column A reflects the results from zooming in on IT and Equipment.
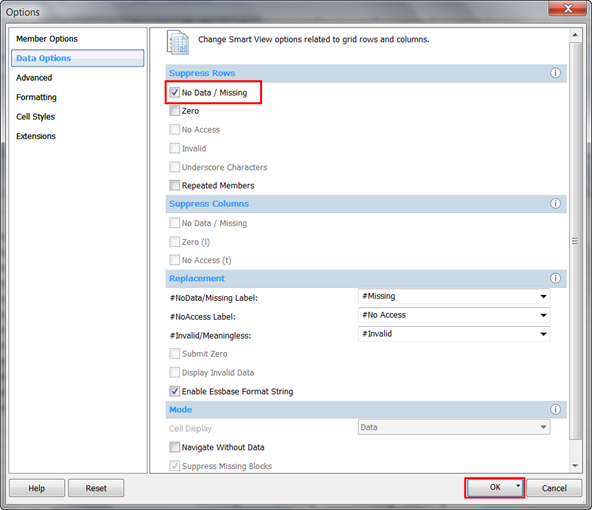
Description of this image To suppress rows that contain missing data, select the Smart View tab, and click Options.
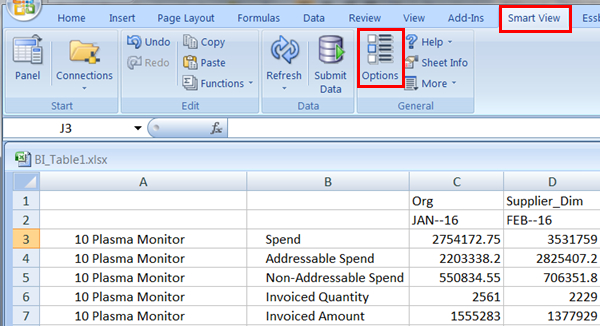
Description of this image In Options, under Suppress Rows, select No data/Missing, and then click OK.
Description of this image On the Smart View ribbon, click Refresh.

Description of this image
Selecting and Examining POV Members
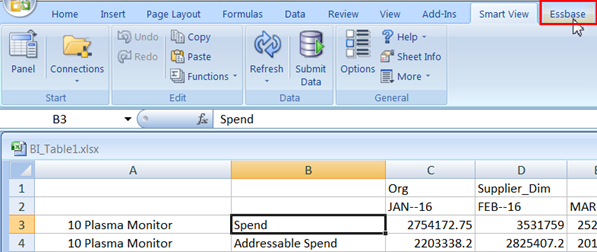
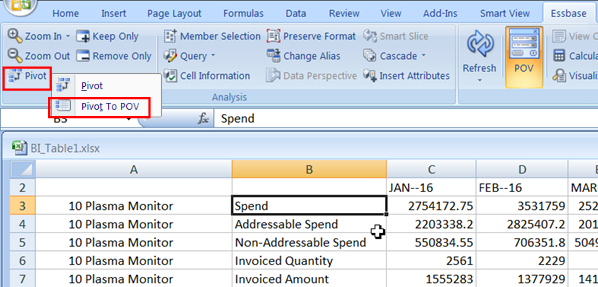
Select Spend, and select the Essbase ribbon.
Description of this image On the Essbase ribbon, click the Pivot list, and select Pivot to POV.
Description of this image Select the 2016 Q1 cell, and then click Keep Only.
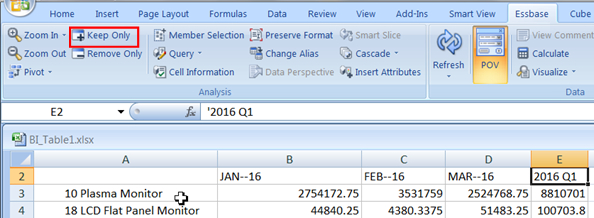
Description of this image The results show the totals for the first quarter.
Description of this image In the POV, select and highlight Org.
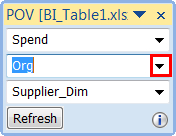
Description of this image Drag Org to the Q1 2016 cell, and then release.

Description of this image Org sits below the Q1 2016 when you drop the dimension.
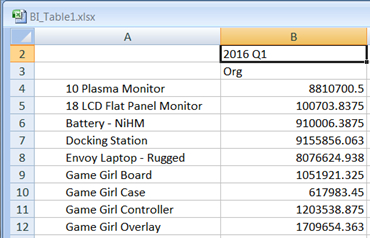
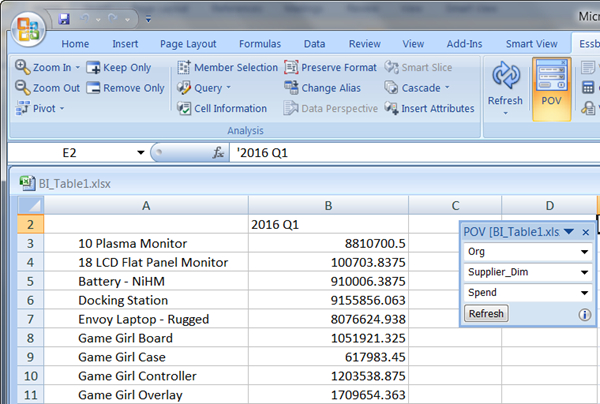
Description of this image Double-click Org.
The results show the various organizations that comprise the Org dimension.
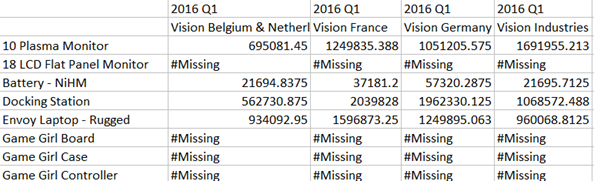
Double-click Vision Industries to zoom in to cost centers for the Purchasing Org.
Description of this image The Vision Industries cost center didn't have any expenditures for the quarter.
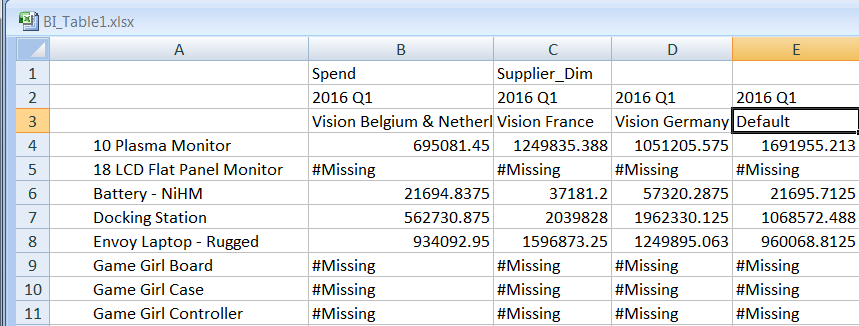
Select Supplier_Dim, and click Member Selection.
Description of this image In Member Selection for the Supplier_Dim, use the right arrow
 to move JKS National and PC Systems to the panel on the right, and click OK.
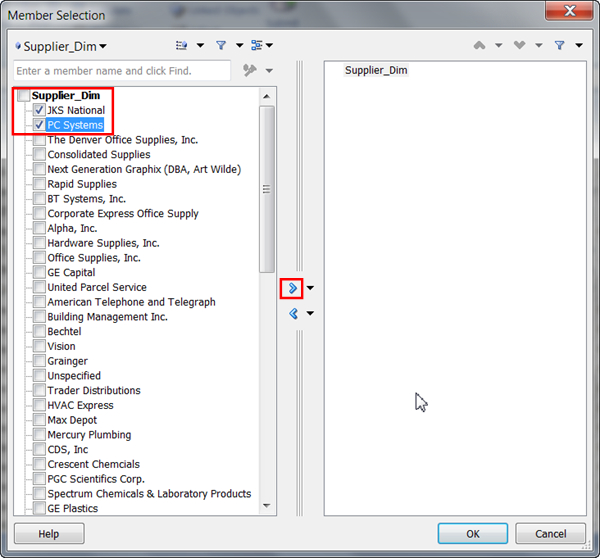
Description of this image JKS National and PC Systems are added to the available Supplier_Dim list.
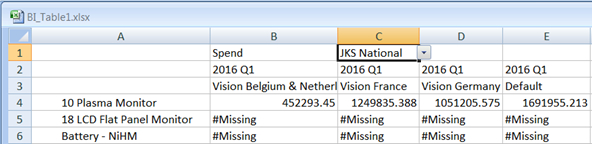
Click the Supplier_Dim list, and select JKS National, and click Refresh.
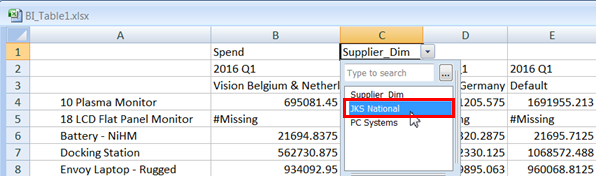
Description of this image The results for JKS National show that the company supplied plasma monitors and didn't supply LCD flat monitors.
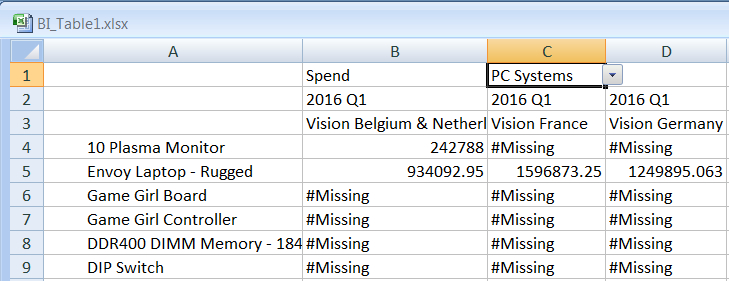
Description of this image Click the Supplier_Dim list, and select PC Systems.
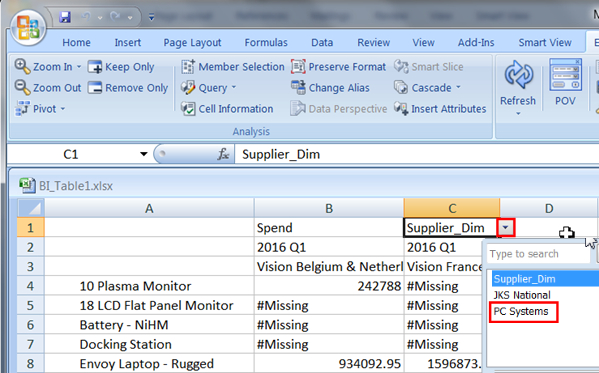
Description of this image The results for PC Systems show that the company supplied Envoy rugged laptops.
Description of this image