Monitoring a Java Cloud Service
Overview
- An Oracle.com account
- Already completed the Oracle by Example tutorial titled Signing Up for a Java Cloud Service
Purpose
This tutorial covers monitoring a Java Cloud Service.
Time to Complete
Approximately 30 minutes
Introduction
Oracle customers interested in the Oracle Cloud can work through this tutorial to see how to check the status of their account and how to monitor their Java Cloud Service.
Scenario
This tutorial assumes you are an Oracle customer. It also assumes you have completed the Oracle by Example tutorial titled Signing Up for a Java Cloud Service.
Prerequisites
Before starting this tutorial, you should have:
Checking Your Account Status
To view the status of your account, perform the following steps:
Open a web browser and enter the URL for the Oracle Cloud:
On the Oracle Cloud screen click the Sign In button.

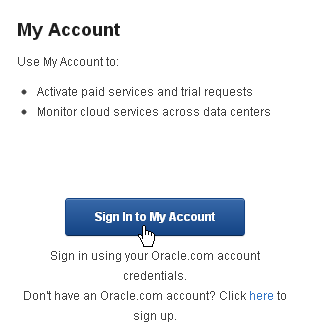
On the next screen, under My Account, click the Sign In to My Account button.
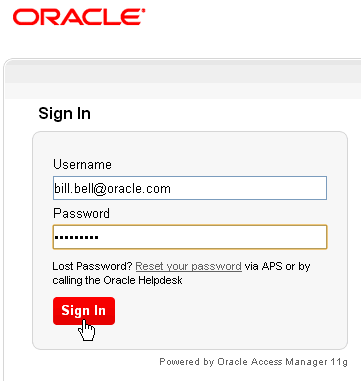
On the Sign In screen, enter your Oracle.com Username and Password, and click Sign In.
On the left are tabs which allow you to view different aspects of your account.
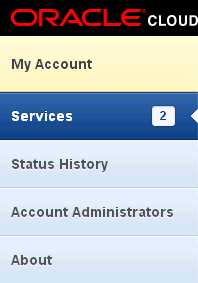
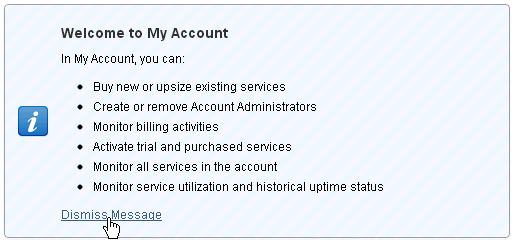
Ensure Services is selected. To the right there is a welcome message (if you have not previously removed it). To remove the message, click the Dismiss Message link.
On the Services page, the table lists your services. To see the details about a service, click either the service name or the magnifying glass icon.
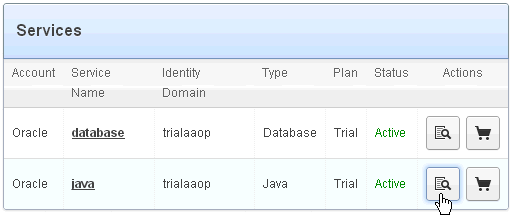
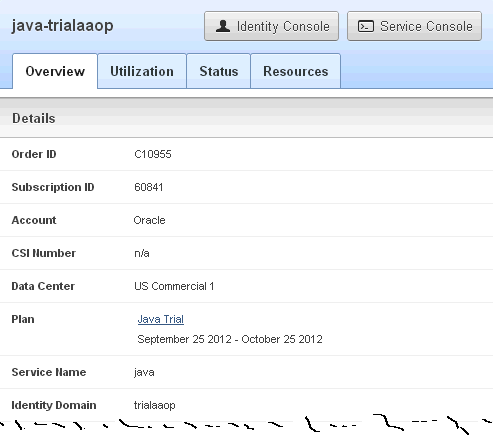
On the details screen, under the Overview tab, you are given general information about the service: its Data Center, Service Name, Identity Domain, and so on.
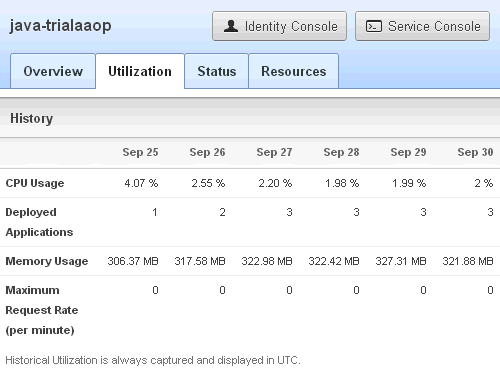
Click the Utilization tab to view a summary of current usage, including CPU Usage, the number of Deployed Applications, Memory Usage, and Maximum Request Rate (per minute). Use this page to monitor the basic health of the service.
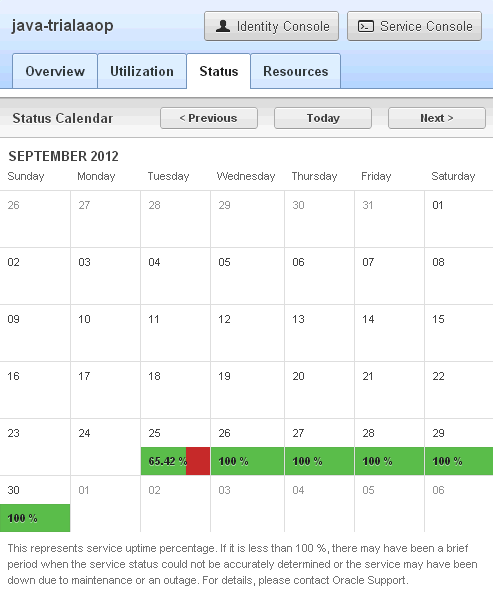
Click the Status tab to view your service uptime percentage per day.
Click the Resources tab to access links to resources related to the service you are viewing.
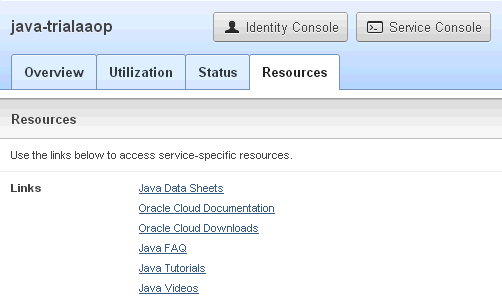
Notice above the tabs there are buttons to access the Identity Console and the Service Console.

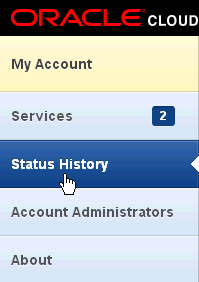
On the left, select the Status History tab.
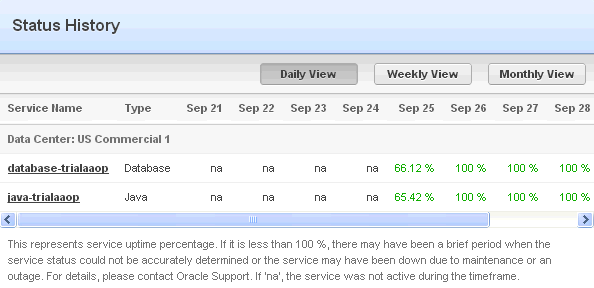
The Status History page displays the uptime percentage of all your services. The information is the same as under the Status tab of a particular service, except that this view lists all your services, and allows you to select the time frame by clicking either the Daily View, Weekly View, or Monthly View buttons.
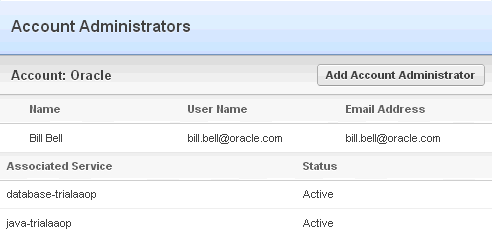
On the left, select the Account Administrators tab.
The Account Administrators screen displays the administrators of the account and the services associated with the account. New administrators can be added by clicking the Add Account Administrator button.
When you have finished, log out by clicking the Logout button.

Monitoring a Java Service by Using Java Cloud Services Control
- A Performance Summary chart
- General information including the version of the Java Cloud Service and the megabytes of disk usage
- Information about Servlets and JSPs, including the number of Active Sessions, the Request Processing Time in milliseconds, and the Requests (per minute)
- JDBC usage, including the number of open JDBC connections and the number of connections created per minute
- Deleted (stopped and removed from the configuration), by clicking the Delete Application button
- Redeployed, by clicking the Redeploy button
- Started (if it is not running), by clicking the Start button
- Stopped (if it is running), by clicking the Stop button
To check the status of your Java Cloud Service, perform the following steps:
Go to the welcome email and click the link for the Java Service console. Alternatively, click the Service Console button while viewing information about your Java Cloud Service, as shown in the previous section of this tutorial.
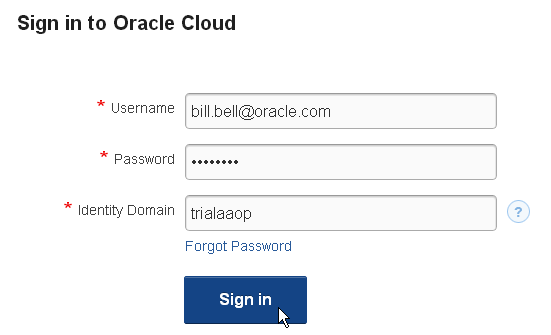
Sign in using the Service Administrator's credentials, which in this tutorial is the same as the Identity Domain Administrator's credentials.
Enter the Username (which in this tutorial is bill.bell@oracle.com).
Enter the Password.
Enter the Identity Domain (which in this tutorial is trialaaop, yours will be different).
Click the Sign In button.
After signing in, you will see the Java Cloud Services Control console for your Java Cloud Service. In this tutorial, the Java Cloud Service name is java.
Displayed on the Java Cloud Service home page is a lot of information about the service. We will look at each part of this page for the remainder of this tutorial.
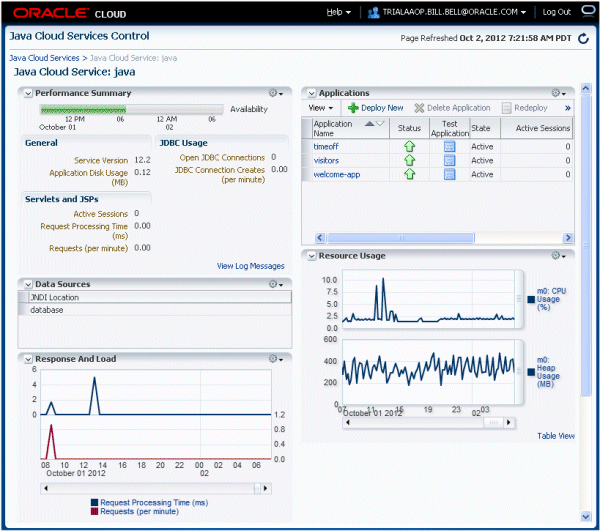
First, some general information about this page.
Notice the down-arrow button to the left of each section title. This allows you to collapse that area. Once collapsed, click there again to expand the area.

To the right of each area there is a gear icon and a drop-down list. This allows you to change the order of the areas.

At the top of the page, on the right, is the refresh button. Click this to refresh the screen.

Finally, let's look at the title area. Here you find the Help menu, a drop-down next to the Identity Domain name to select accessibility options, and the Log Out button.

The general information area displays:
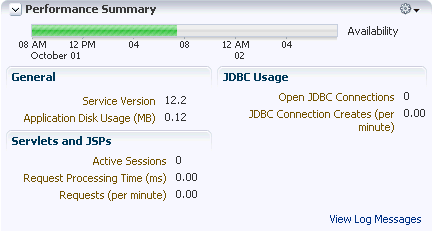
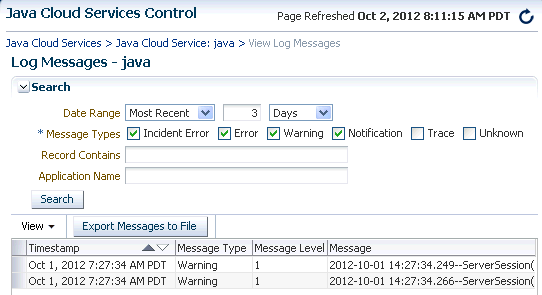
Notice in the general information area the View Log Messages link. Click this to be taken to a screen that allows you to search the log files.
Once there, use the Date Range drop-down list to select either Most Recent or Time Interval. If Most Recent is selected, enter a number and use the drop-down list to select a time unit (Minutes, Hours, or Days). If Time Interval is selected, the fields change to Start Date and End Date.
Next, use the check boxes to select the Mesage Types to display.
The Record Contains field allows you to search for a particular string in the messages.
The Application Name field allows you to specify messages dealing with a particular deployed application.
The View drop-down list allows you to select the columns displayed in the table.
The Export Messages to File button allows you to save the messages in a file in various formats.
After all criteria have been entered, click the Search button and the messages that match are displayed in the table.
Select a row in the table to see the details of the message.
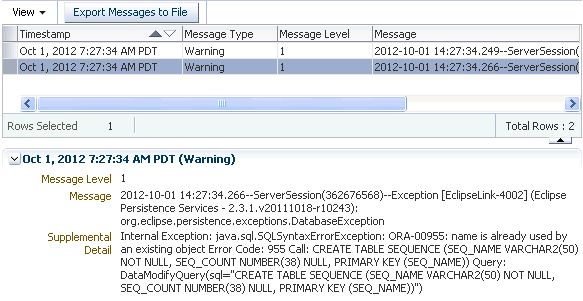
Use the breadcrumb link at the top of page to return to the Java Cloud Services Control console.

The Data Sources area lists the names of the Database Services linked to this Java Service.

The Response and Load graph displays the Request Processing Time in milliseconds and the number of Requests per minute.

Click the Table View link to see a table of the data, displayed in a pop-up window.
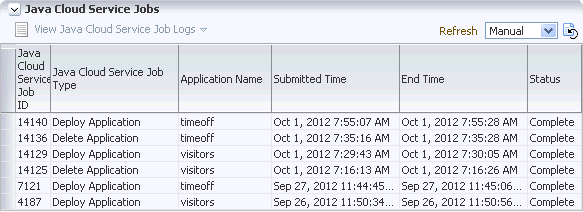
The Java Cloud Service Jobs table displays various jobs performed, like deployment and undeployment, when they occurred, and their Status.
The Refresh drop-down list lets you select to refresh the table manually, or have it automatically refreshed every 1, 3, or 5 minutes.
The Applications table lists applications deployed to the Java Cloud Service, their Status, State, the number of Active Sessions, the Request Processing Time (in milliseconds), and Requests (per minute). The Test Application icon opens a pop-up window with a link to call the application.
The View drop-down list lets you select which columns to display and also allows you to reorder those columns.
The Deploy New button takes you to the deployment wizard to deploy a new application.
Once an application is selected, it can be:

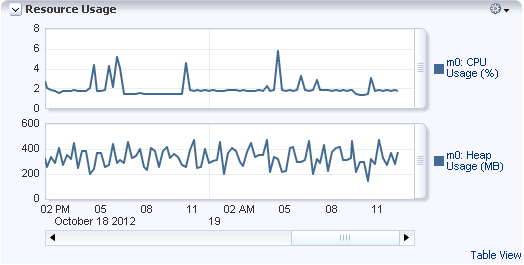
The Resource Usage charts show the percentage of CPU Usage and the Heap Usage in megabytes.
Click the Table View link to see a table of the data, displayed in a pop-up window.
When you have finished with the console, log out by clicking Log Out at the top-right of the screen.

Summary
- Check the status your account
- Monitor your Java Cloud Service
- Oracle Java Cloud Service
- Oracle Cloud Tools
- Using the Oracle Java Cloud Service
- To learn more about the Oracle Cloud or the Java Cloud Service, refer to additional OBEs in the OLL website.
- Lead Curriculum Developer: Bill Bell
In this tutorial, you have learned how to:
Resources
Credits
To help navigate this Oracle by Example, note the following:
- Hiding Header Buttons:
- Click the Title to hide the buttons in the header. To show the buttons again, simply click the Title again.
- Topic List Button:
- A list of all the topics. Click one of the topics to navigate to that section.
- Expand/Collapse All Topics:
- To show/hide all the detail for all the sections. By default, all topics are collapsed
- Show/Hide All Images:
- To show/hide all the screenshots. By default, all images are displayed.
- Print:
- To print the content. The content currently displayed or hidden will be printed.
To navigate to a particular section in this tutorial, select the topic from the list.