Before You Begin
Purpose
This tutorial is an introduction on how to monitor Oracle Java Cloud Service (JCS) instances using the Fusion Middleware Control Console.
Time to Complete
Approximately 45 minutes.
Introduction
Oracle Java Cloud Service is built on top of Oracle WebLogic Server. Oracle WebLogic Server provides a wide range of built-in monitoring and management features and tools that allow to easily monitor, manage, troubleshoot, diagnose and fine-tune JCS instances.
Among those tools Oracle Fusion Middleware Control is arguably the most comprehensive and feature-rich of all. It is also the common monitoring and management console for all Fusion Middleware products. Last but not least, Fusion Middleware Control shares a common user interface and data model with Oracle Enterprise Manager Cloud Control which provides the only complete, integrated and business-driven enterprise cloud management solution in the industry.
In this tutorial we will show how to get started with Fusion Middleware Control to monitor and manage JCS instances.
The whole range of monitoring and management features is out of the scope of this tutorial. Readers that would like to expand on those please refer to Oracle Java Cloud Service Monitor and Tune guide.
Software Requirements
This tutorial has no software requirements beyond that of a web browser.
Prerequisites
Before starting this tutorial, you should have:
- A JCS instance already available.
Monitoring JCS Instances Using Fusion Middleware Control
Log into the Fusion Middleware Control Console
-
Sign in to the My Services application at https://cloud.oracle.com/sign_in after selecting the appropriate Public Cloud Services Data Center option. The My Services Dashboard appears.
-
In the Oracle Java Cloud Service section, click Open Service Console. The Oracle Java Cloud Service Console page is displayed.
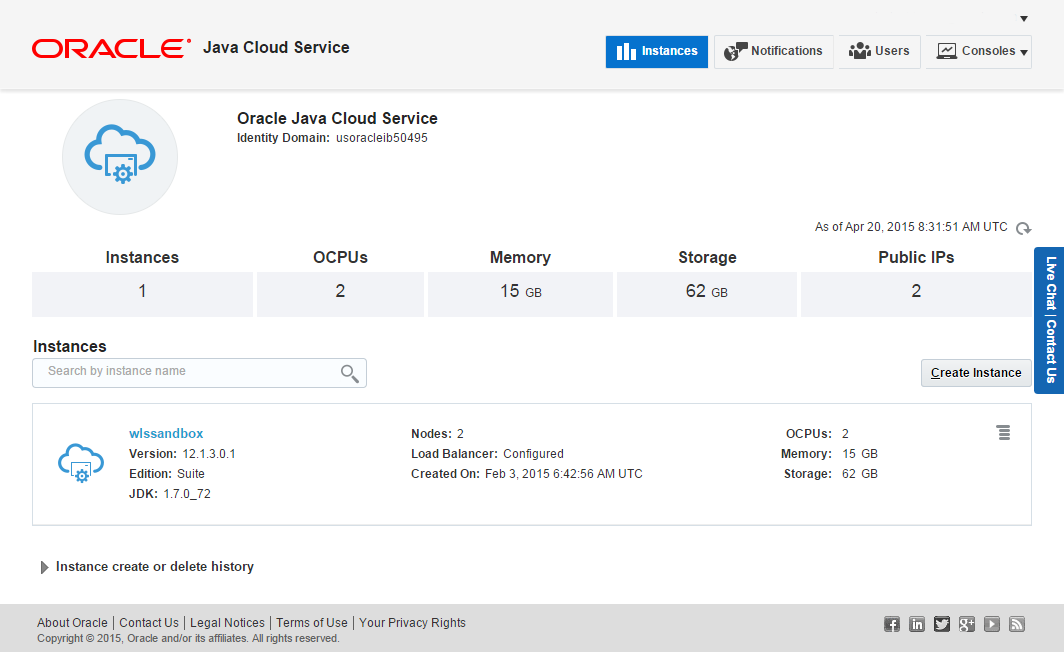
Description of this image -
On your Oracle Java Cloud Service Console, click the icon for the service instance that you want to manage, and then click Open Fusion Middleware Control Console.
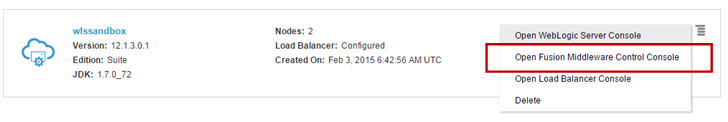
Description of this image -
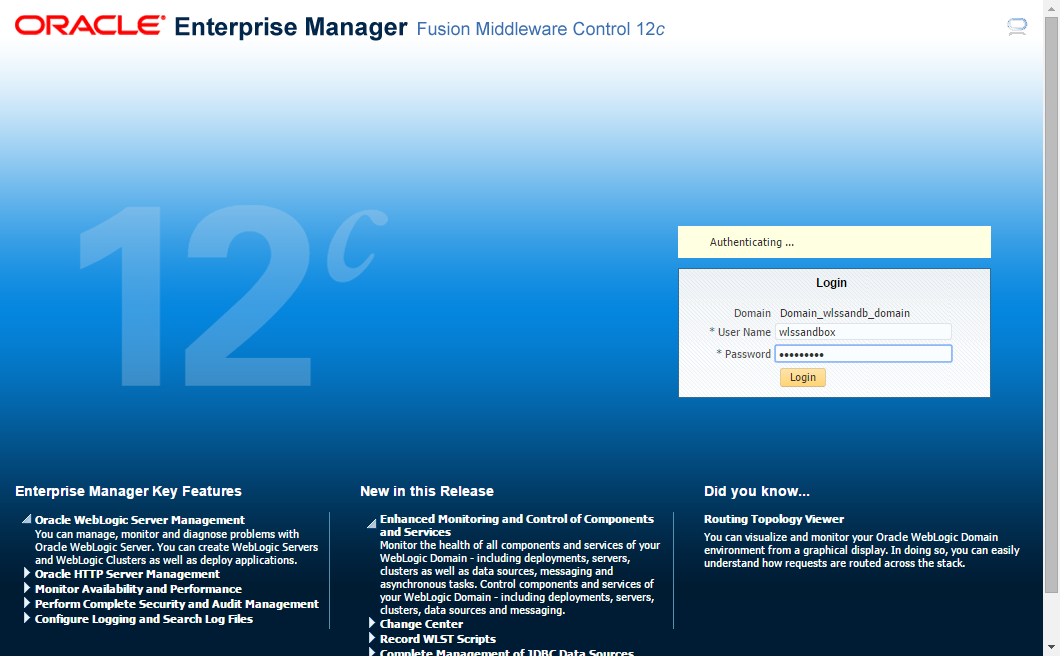
The Fusion Middleware Control Console login page is displayed. Use a valid WebLogic Server administrative user name and password to log into the console. You may want to use the WebLogic Administrator username and password that you provided when creating the service instance (for example wlssandbox/Welcome#1).
Description of this image -
The Fusion Middleware Control Administration Console home page is displayed.

Description of this image
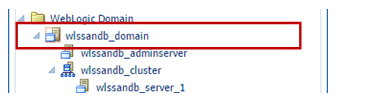
Browse the Target Navigation tree
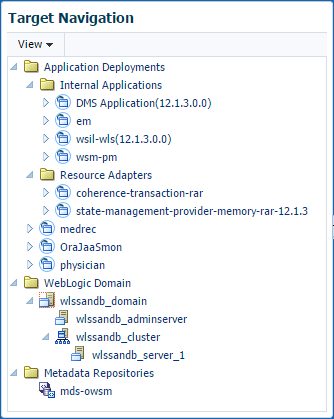
Each monitored/managed item within Fusion Middleware Control is called a target. The Target Navigation tree shows the hierarchy of targets. By clicking over one of those targets the user navigates to the target home page.
Explore the WebLogic Domain home page
-
In the Target Navigation tree, expand WebLogic Domain node and click on the domain name link.
Description of this image -
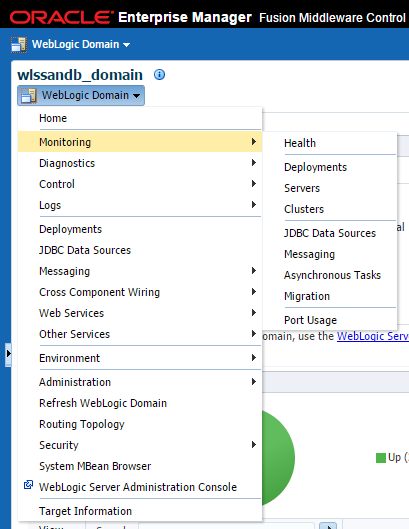
At the top-left corner of the workspace area, right below the target name, you will find the target menu. Navigate through the target menu to access pages that show information and status of specific resources and services that make up the domain, such as clusters, servers, JDBC data sources, JMS servers and modules, and so on.
Description of this image
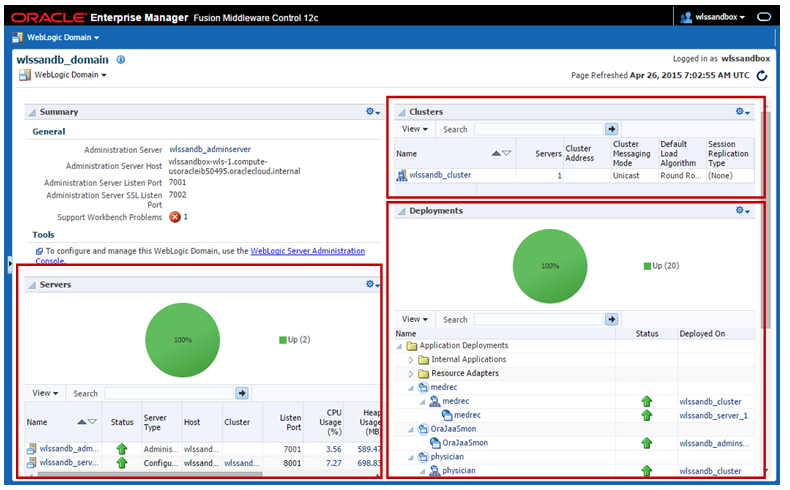
The WebLogic Domain home page is rendered. It presents different sections showing information about the clusters, servers and deployments in the domain.
Monitoring WebLogic Servers
Log into the Fusion Middleware Control Console
If not already signed in to the My Services application at https://cloud.oracle.com/sign_in, do so again after selecting the appropriate Public Cloud Services Data Center option. The My Services Dashboard appears.
Access Target Navigation tree
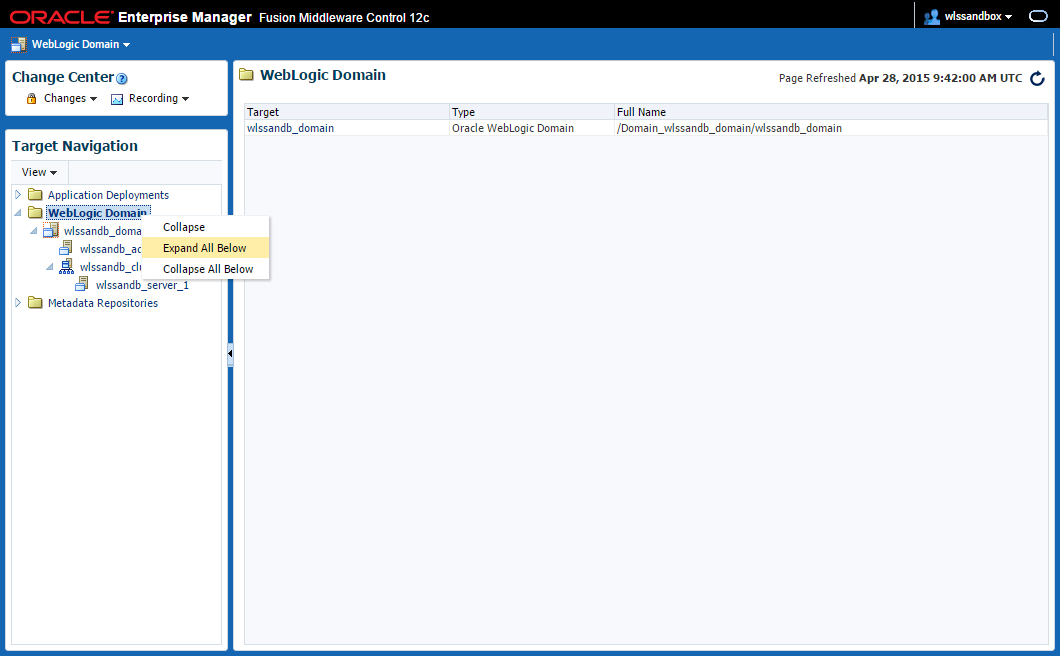
In the Target Navigaton tree, Right Click the WebLogic Domain node and select Expand All Below to see all servers in the domain.
Description of this image -
Access the server home page by clicking over the tree node representing server you want to monitor.
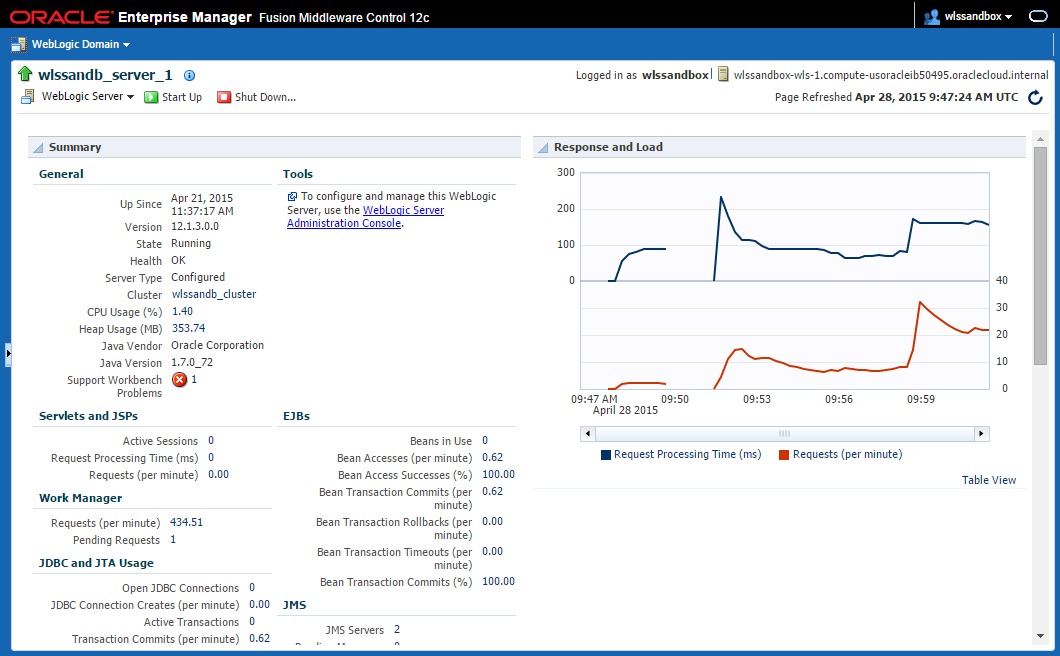
Explore the Server home page
At the top of the workspace area you will find the Summary section, showing information about the current status of the server. Next to the Summary section, the Response and Load chart provides you with data about server throughput and response time.
-
Click the Table View link to switch from the chart to a list representation of collected metric values.
Description of this image -
Scroll down the page to see the Application Deployments and Most Requested sections.
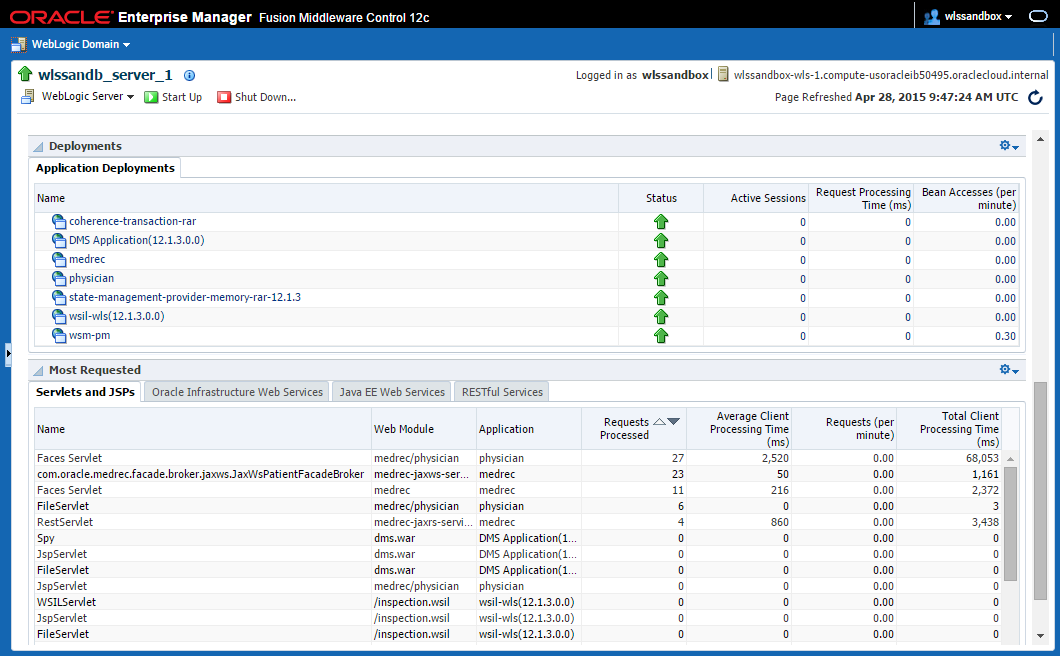
Description of this image
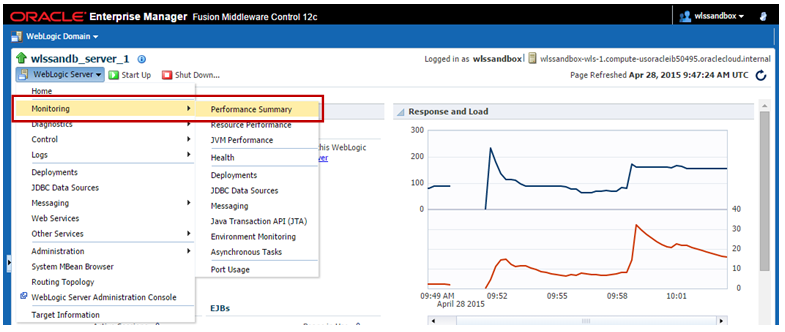
Access the Performance Summary page
-
Using the target menu select Monitoring > Performance Summary to access the Performance Summary page.
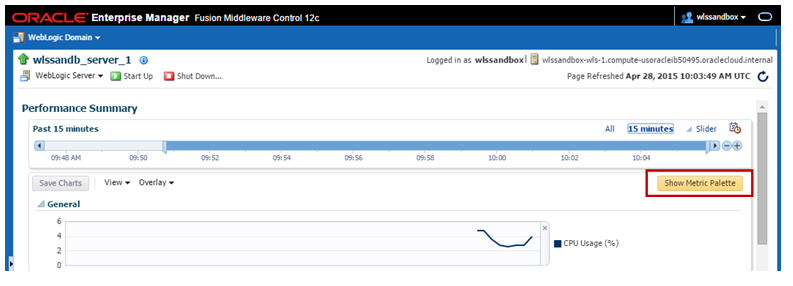
Description of this image The Performance Summary page shows a list of charts, each one presenting the evolution over time of one or more metrics. The default layout includes metrics like CPU and memory consumption, number of active sessions, response and load and JVM memory management among others.
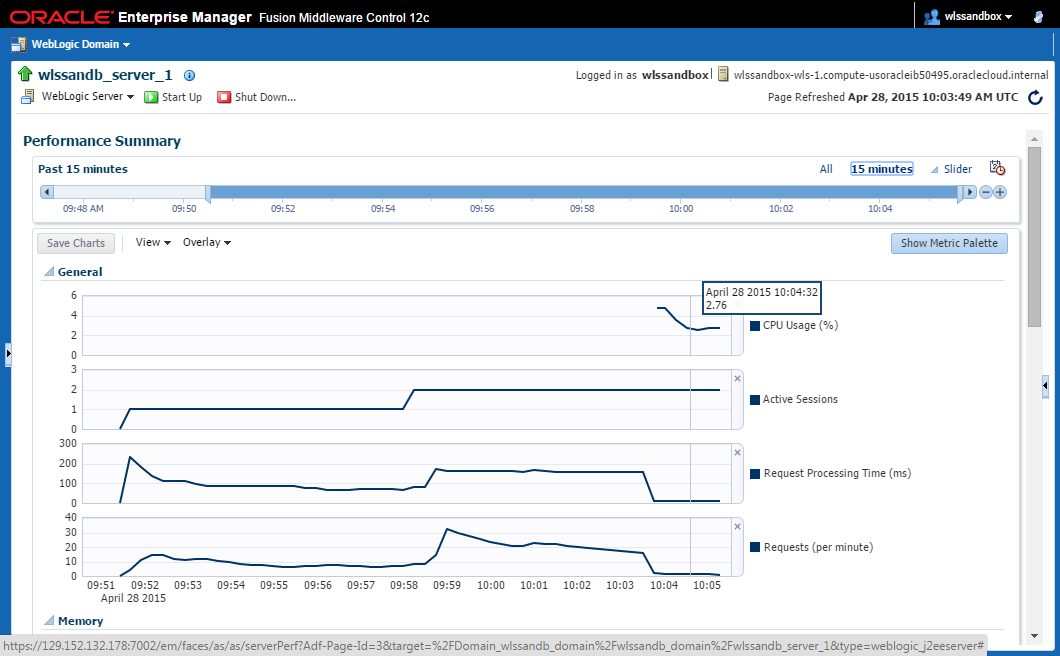
Description of this image -
The Performance Summary view comes in very handy to create custom dashboards. Clicking the Show Metric Palette button the tree of available metrics will show up. You can either check the metrics you want to include in your custom dashboard to create a new chart or drag & drop them over an existing chart so that multiple metrics are presented together to allow for better correlation and analysis.
Description of this image 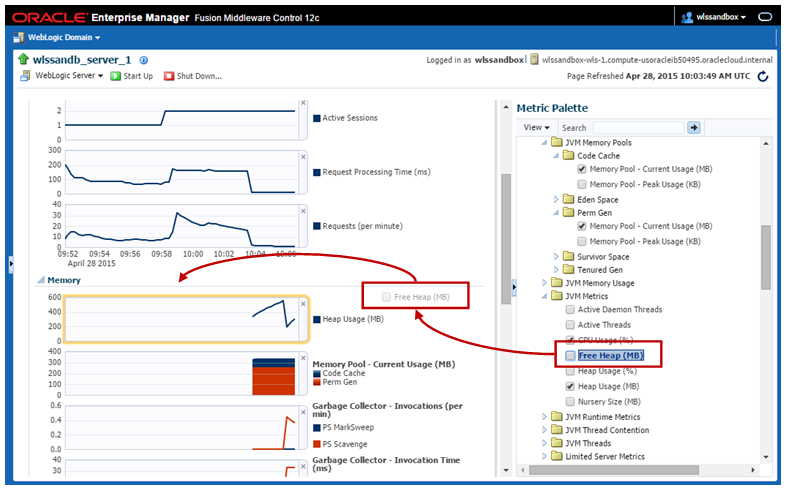
Description of this image -
Once you have your custom dashboard created you may want to save it by clicking on the Save Charts button and providing a name. That way you will be able to switch between different layouts focused on different monitoring perspectives. Use the Slider control to choose the time window you want to analyze.
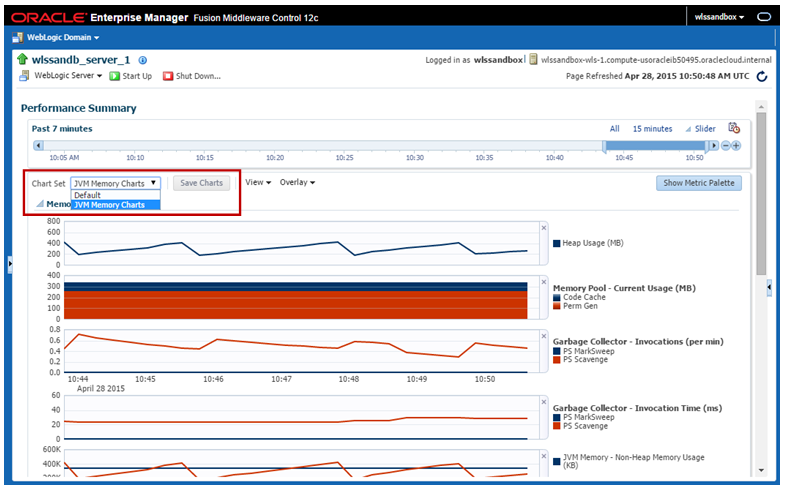
Description of this image -
Finally, the Overlay menu allows you to compare the current behavior with:
- Another server
- A previously saved baseline
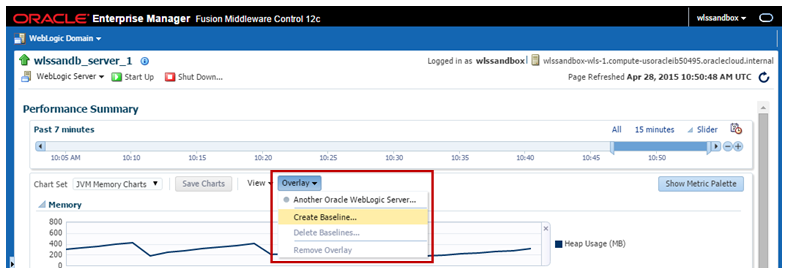
Description of this image
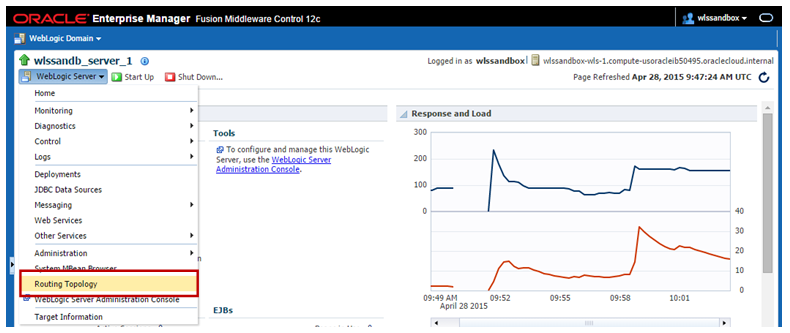
Explore the Routing Topology page
The Topology Viewer is a graphical representation of routing relationships across components and elements of the domain. You can easily determine how requests are routed across components. For example, you can see how requests are routed a Managed Server, to a data source and finally to the database.
-
From the target menu select > Routing Topology to access the Routing Topology page
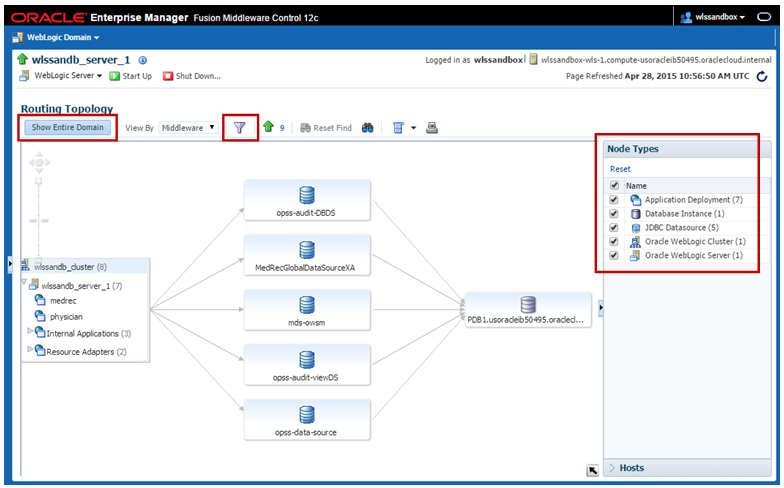
Description of this image - Click the filter icon
 to have the Node Types section show up. Select the type of components you want to be part of the topology view. Then click the Show Entire Domain button to include the whole domain in the topology view
Description of this image
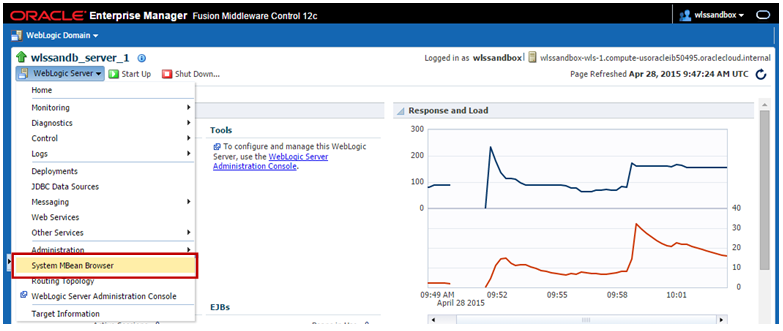
Navigate MBean tree
You may still want to access the single source of truth that originates most of the information we have talked about so far. If that is the case you may want to explore the raw data that is accessible as system MBeans.
-
From the target menu select > System MBean Browser to access the MBean tree.
Description of this image -
In the MBean tree you can look for specific MBeans and/or filter the tree using MBean patterns by clicking
 or
or icons respectively. Select the MBean of your choice in the MBean navigation tree and see how the workspace area gets updated with information, attributes and operations exposed by that MBean.
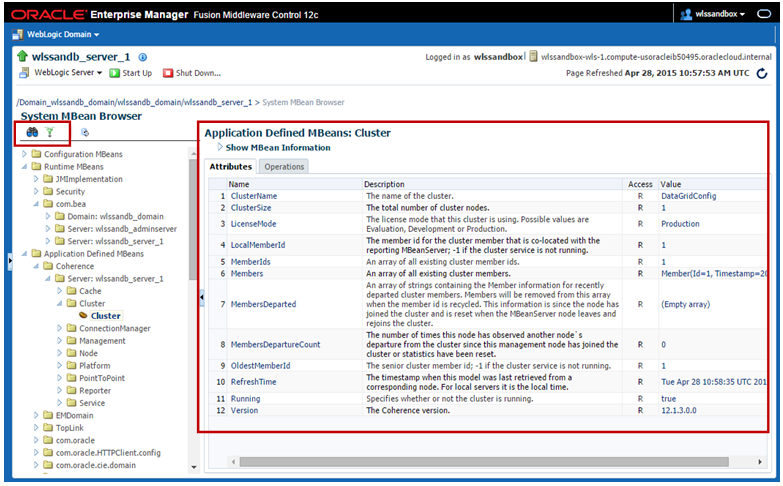
Description of this image