Before You Begin
Purpose
This tutorial shows you how to build, use, and customize an Interactive Report in Oracle Application Express.
Time to Complete
Approximately 60 minutes.
Overview
Oracle Application Express (Oracle APEX) is a rapid web application development tool for the Oracle database. Using only a web browser and limited programming experience, you can develop and deploy professional applications that are both fast and secure. Oracle Application Express is available with the Oracle Database, whether it's on-premises or in an Oracle Database Cloud Service.
In this tutorial, you use Oracle Application Express Release 5.0 to create, use, and customize an Interactive Report. For more information on Interactive Reports, please refer to Using Interactive Reports on Oracle Help Center.
Please keep in mind the following while running this tutorial:
- Logging into your Oracle Application
Express workspace: Your Oracle
Application Express workspace may reside in an
on-premises Oracle Database or in Oracle Database
Cloud Services. The login credentials differ
depending on where your workspace is located:
- Logging into Oracle Application Express in a Oracle Database Cloud Service: Reference the Oracle Help Center for your Oracle Database Cloud Service. To do this, go to the Oracle Help Center for Cloud, and select Platform and Infrastructure. From here, select your Database Cloud Service and the Get Started page will appear.
- Logging in to Oracle Application Express on-premises: From your browser, go to the location of your on-premises installation of your Oracle Application Express workspace provided by your Workspace Administrator.
- Application ID: Screenshots in this tutorial show a blurred Application ID. Your Application ID can be any value assigned automatically while creating the application.
- Schema: If you are accessing an Oracle Application Express workspace in Database Schema Service, you have one schema assigned to you with a schema name that you cannot change. If you are accessing the workspace in an on-premises Oracle database, you may have more than one schema assigned to your workspace by the Oracle Application Express Instance Administrator.
What Do You Need?
Before starting this tutorial, you should:
- Have access to an Oracle Database 11g or later release, either on-premises or in a Database Cloud Service.
- Install Oracle Application Express Release 5.0 into your Oracle Database (for on-premises only).
- Provision at least one Oracle Application Express user. See Creating New User Accounts in Oracle Application Express Administration Guide.
Creating an Application with an Interactive Report
-
From the Oracle Application Express home page, click the Application Builder icon.

Description of this image -
Click Create >.

Description of this image -
Click the Desktop icon.

Description of this image -
Enter Interactive Reports OBE for Name, and click Next >.

Description of this image -
By default, the Home page gets created. To add another page, click Add Page.

Description of this image -
Select Report and Form for Page Type. Select Home(1) for Parent Page, DEMO_PRODUCT_INFO for Table Name, Interactive for Report Type. Click Add Page.

Description of this image -
Click Next >.

Description of this image -
Accept the default, and click Next >.
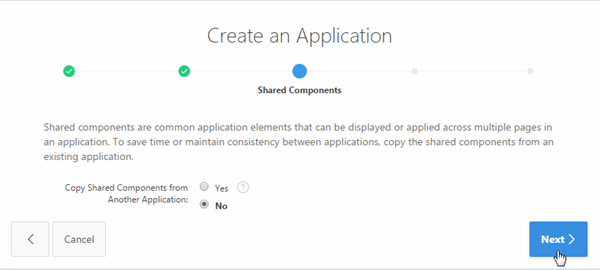
Description of this image -
You want to specify the type of authentication used to access this application. Select Application Express Accounts for Authentication Scheme. Also, you can specify a Date Format for the entire application. Click the List of Values icon for Date Format.
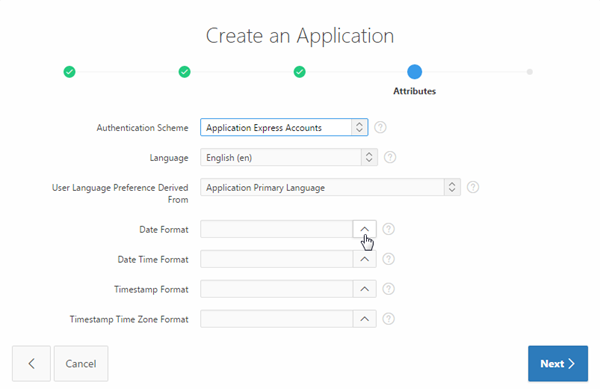
Description of this image -
Select 12-JAN-2004.
Note: By setting the date format when you create the application, the same date format will be used for all report columns and items.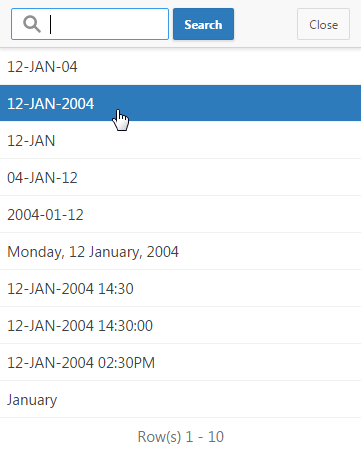
Description of this image -
Click Next >.

Description of this image -
Click Create Application.
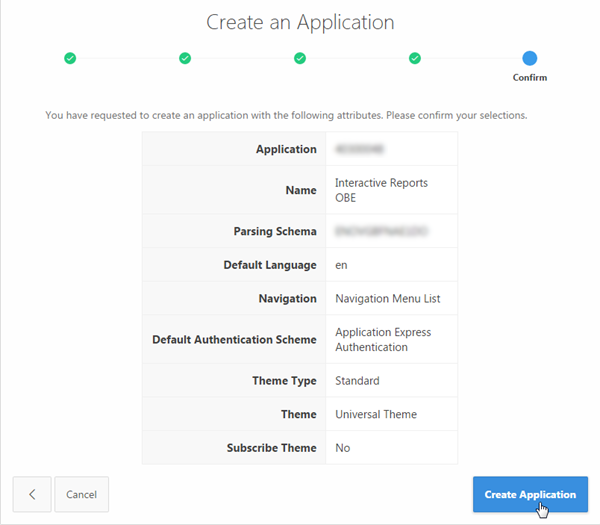
Description of this image -
Your application is created. Click Run Application.

Description of this image -
The Log In screen appears. Enter your Oracle Application Express credentials, and click Log In.

Description of this image -
The Home page is displayed. Select Demo Product Info in the navigation menu.

Description of this image -
The Report is displayed. Notice that the date format is set according to the date you specified when you created the application. In the next section, you examine some of the Interactive Report features.Click Edit Page 2 in the developer toolbar.

Description of this image
Adding Images to Your Interactive Report
-
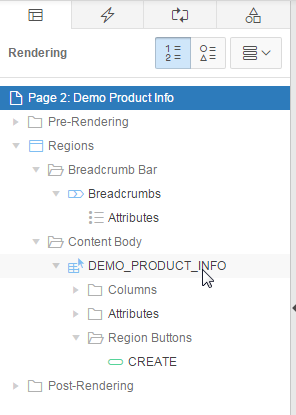
You want to change your query for this interactive report. In the Rendering tab, click DEMO_PRODUCT_INFO.
Description of this image -
In the property editor, under Source, click the Code Editor: SQL Query icon.

Description of this image -
The Code Editor - SQL Query opens. Replace the existing SQL query with the following SQL query, and click the Validate icon.
select
                                  p.product_id,


                                  p.product_name,


                                  p.product_description,


                                  p.category,


                                  p.product_avail,


                                  p.list_price,

                                         (select
                                  sum(quantity) from demo_order_items


                                  where product_id = p.product_id) units,

                                         (select
                                  max(o.order_timestamp) od from demo_orders o,
                                  demo_order_items i


                                  where o.order_id = i.order_id and i.product_id
                                  = p.product_id) last_date_sold,


                                  p.PRODUCT_ID image

                                  from demo_product_info p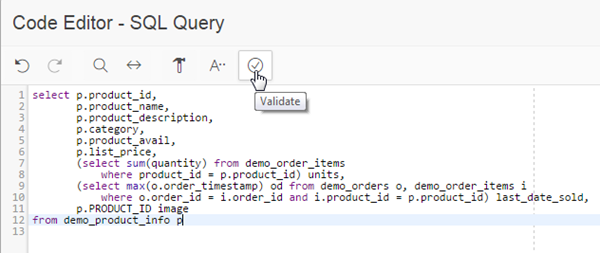
Description of this image -
A message is displayed as "Validation Successful". Click OK.

Description of this image -
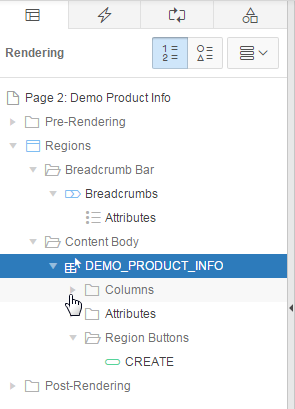
You also want to make some changes to the report column headings. In the Rendering tab, under DEMO_PRODUCT_INFO, expand Columns.
Description of this image -
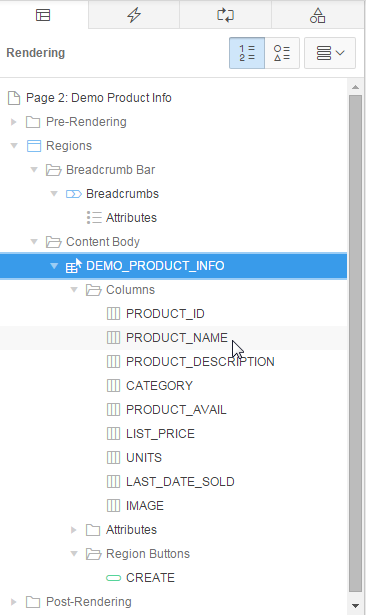
Under Columns, click PRODUCT_NAME.
Description of this image -
In the property editor, under Heading, change Heading to Name.

Description of this image -
Under Columns, click PRODUCT_DESCRIPTION.
Description of this image -
In the property editor, under Heading, change Heading to Description.

Description of this image -
Under Columns, click PRODUCT_AVAIL.

Description of this image -
In the property editor, under Heading, change Heading to Available.

Description of this image -
Under Columns, click LIST_PRICE.
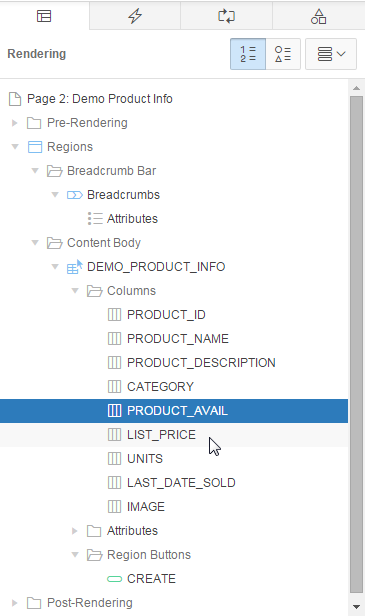
Description of this image -
In the property editor, under Heading, change Heading to Price.

Description of this image -
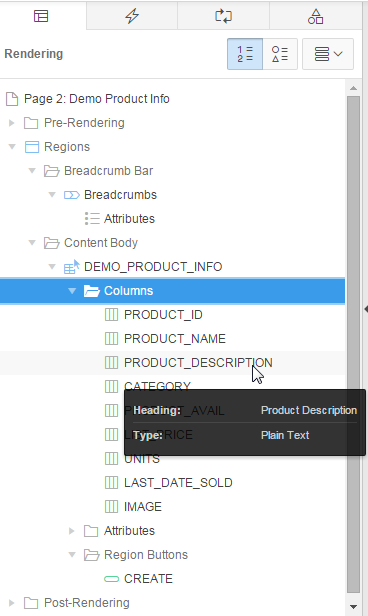
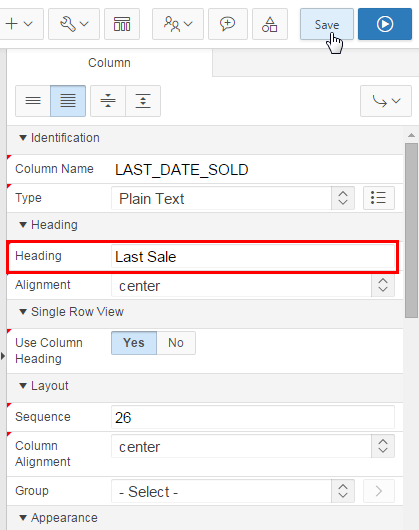
Under Columns, click LAST_DATE_SOLD.

Description of this image -
In the property editor, under Heading, change Heading to Last Sale.
Description of this image -
Under Columns, click IMAGE.
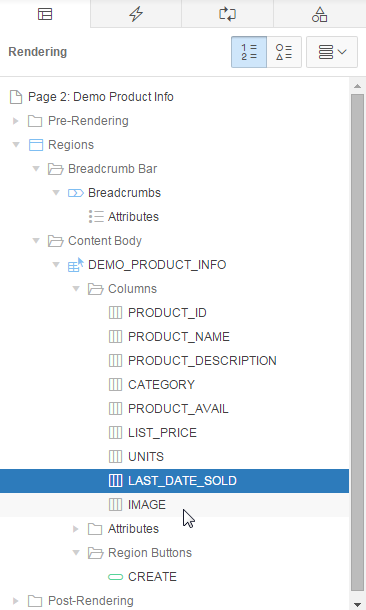
Description of this image -
In the property editor, under Identification, select Display Image for Type.

Description of this image -
Under BLOB Attributes, click the List of Values:Table Name icon.

Description of this image -
Click the DEMO_PRODUCT_INFO link.

Description of this image -
Under BLOB Attributes, select PRODUCT_IMAGE for BLOB Column.

Description of this image -
Under BLOB Attributes, select PRODUCT_ID for Primary Key Column 1.
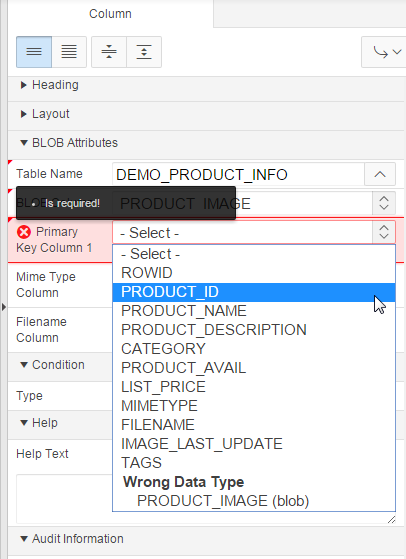
Description of this image -
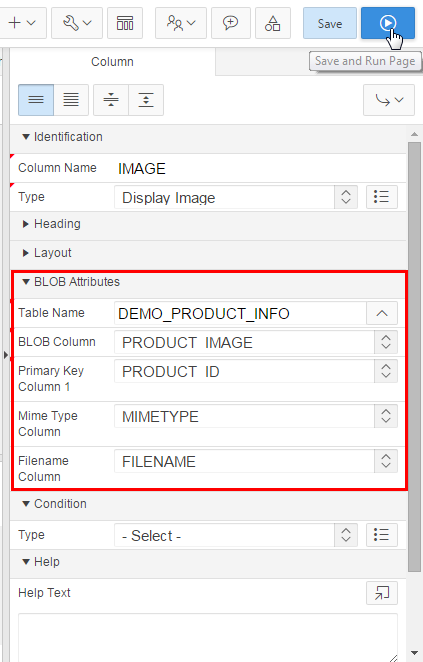
Under BLOB Attributes, select MIMETYPE for Mime Type Column, FILENAME for Filename Column, and click Save and Run Page.
Description of this image -
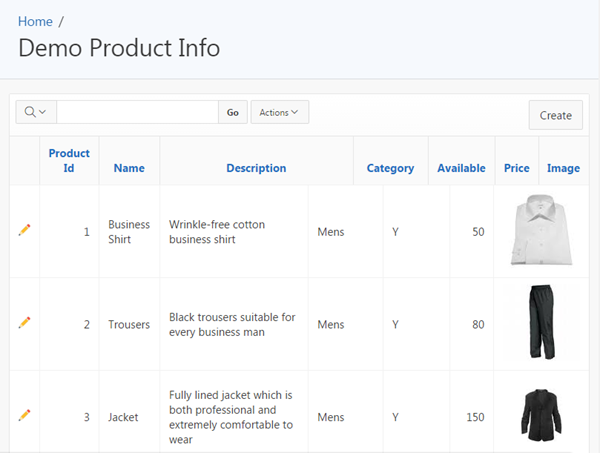
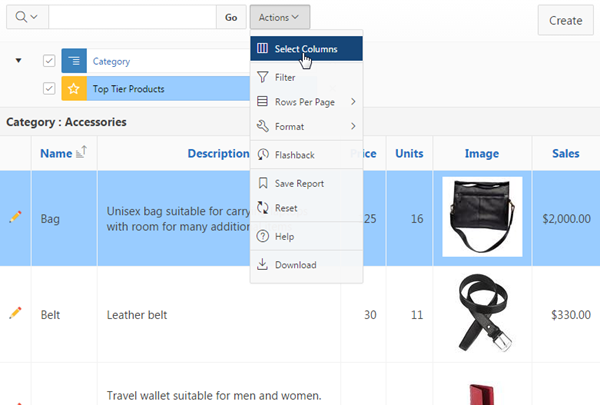
The report now displays image column along with other information. You can show or hide any columns on the report using the Actions menu. Click Actions, and click Select Columns.

Description of this image -
Select Units and Last Sale. Click < (Remove).

Description of this image -
Both the selected columns are moved to Do Not Display area. Click Apply.

Description of this image -
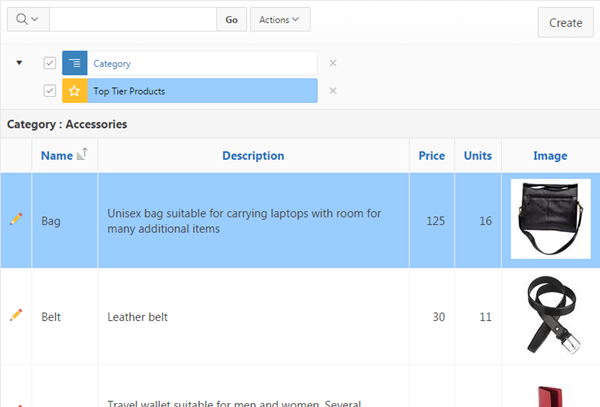
Notice that the report no longer displays the Units and Last Sale columns.
Description of this image
Manipulating Your Interactive Report
-
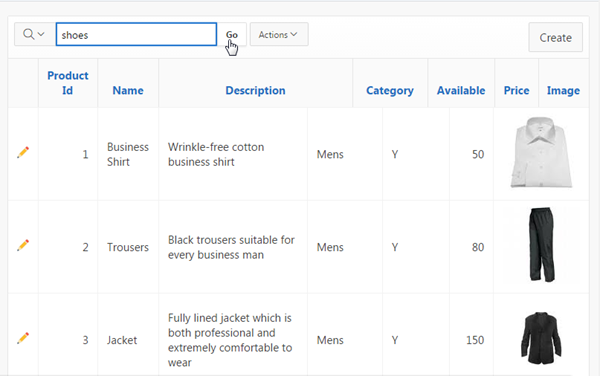
You can search for values in the report. Enter shoes in the search bar, and click Go.
Description of this image -
Notice that only the rows where 'shoes' is found are listed. A filter was also created above the report data.

Description of this image -
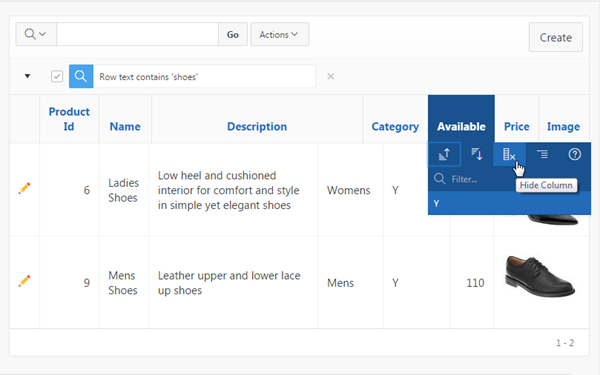
To hide a column, you can select the column header link and then click the hide column icon. Alternatively, from the Actions pull down, you can select Select Columns and move the column to the Do Not Display area. In this case, click Available, and select the Hide Columns icon.
Description of this image -
Notice that the Available column is no longer displayed on the report.
Note: You can show the column again by clicking Select Columns from the Actions menu.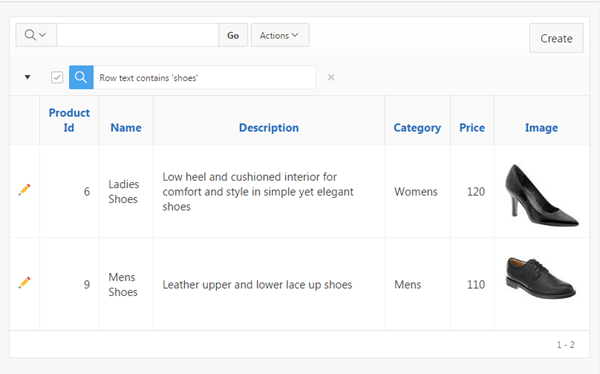
Description of this image -
You can remove a filter by selecting the Remove Filter icon next the to filter or deselect a filter by unchecking the check box next to the filter.
In this case, click the Remove Filter icon next to the filter.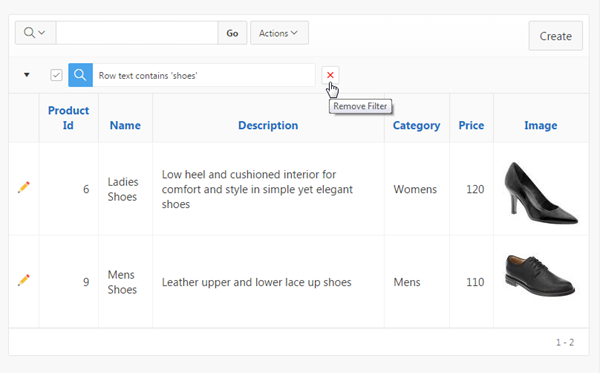
Description of this image -
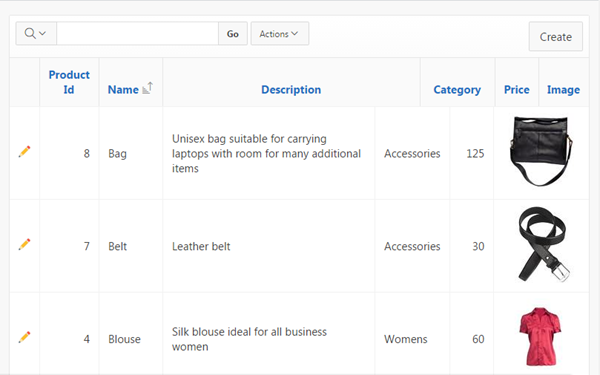
To sort on a column, click the header you want to sort on and select the Sort Ascending or Sort Descending icon. Select the Name column and select the Sort Ascending icon.
Alternatively, from the Actions menu, you can select Format > Sort, and select multiple sort levels.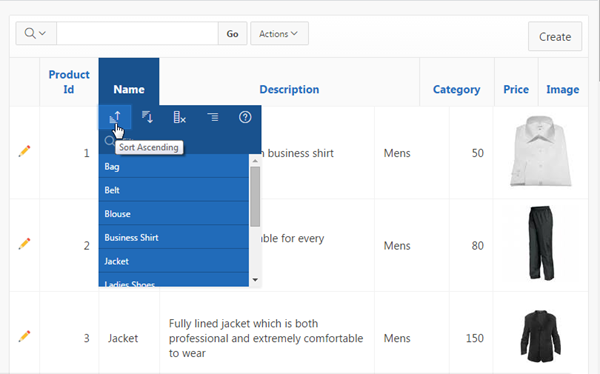
Description of this image -
The report is now sorted on Name.
Description of this image -
You can create a control break on a column. Click the Category header, and select the Control Break icon.
Alternatively, from the Actions menu, select Format, and then select Control Break.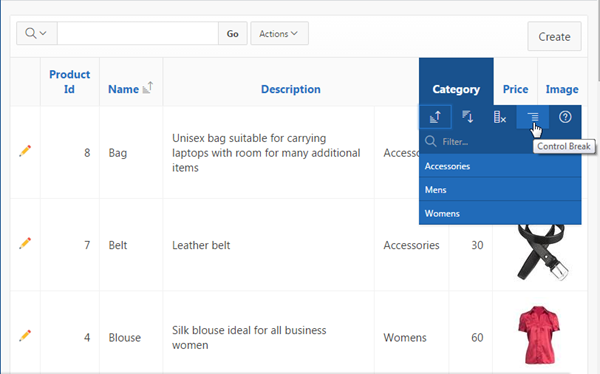
Description of this image -
The control break is created. Notice the Category column is eliminated in the list and now appears before each break point in the report.
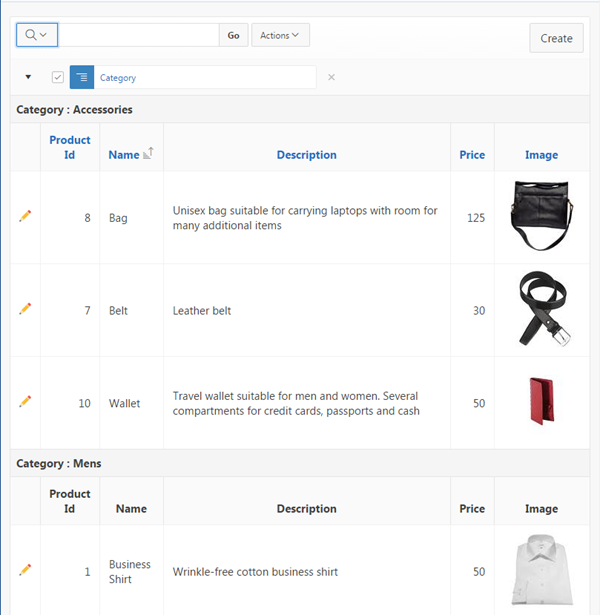
Description of this image -
Scroll down to the bottom of the report. Notice that there are 10 rows on this page. You can set the rows per page to be displayed.

Description of this image -
Scroll to the top of the page. From the Actions menu, select Rows per Page, and select 5.

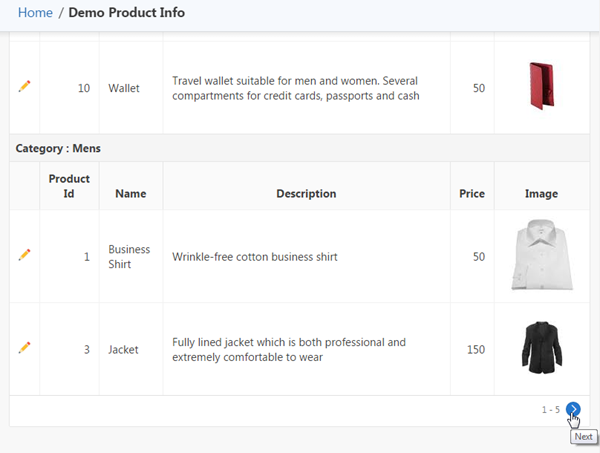
Description of this image - Scroll to the bottom of the page again and
notice that only 5 rows are displayed. In order to
go to the next page, you can select the Next
icon. In this case, scroll
to the top of the page again.
Description of this image -
You can also highlight a particular cell or row in the report based on some criteria. Click the Actions menu, select Format, and select Highlight.

Description of this image -
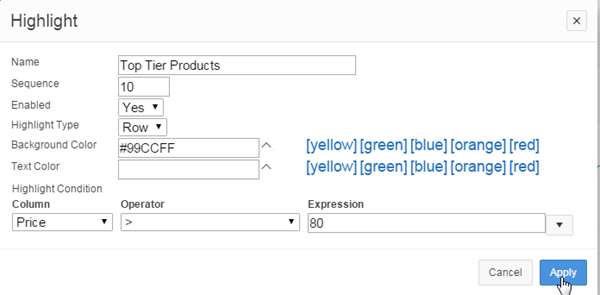
You want to highlight the row of a product if its price is higher than $80. Enter Top Tier Products for Name, make sure Enabled is set to Yes, Highlight Type is set to Row, and select [blue] for Background color. Under Highlight Condition, select Price for the Column, select > for the Operator and 80 for the Expression, and click Apply.
Description of this image -
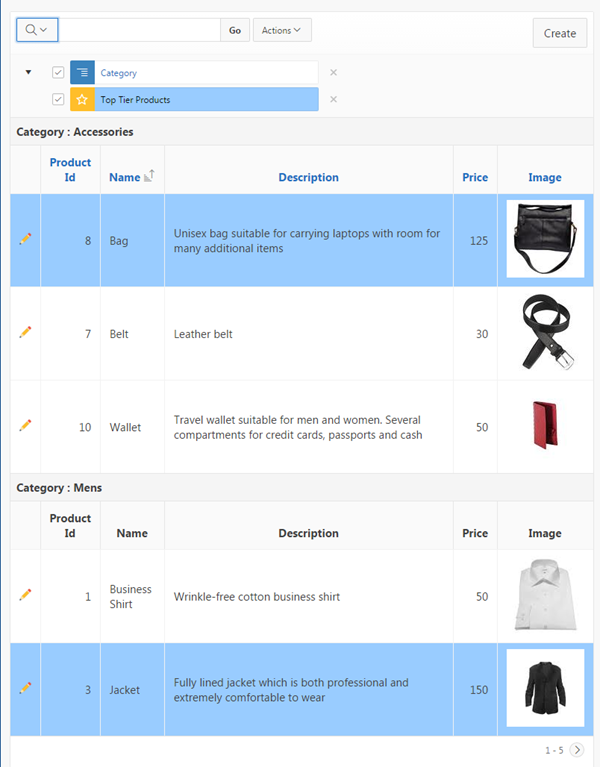
Notice that a highlight rule is created at the top of the report and the rows that meet the criteria are highlighted.
Description of this image -
You can reorder or add additional columns to the report. From the Actions menu, select Select Columns.

Description of this image -
Select Units in the Do Not Display region, and click > ( Move ) icon.

Description of this image -
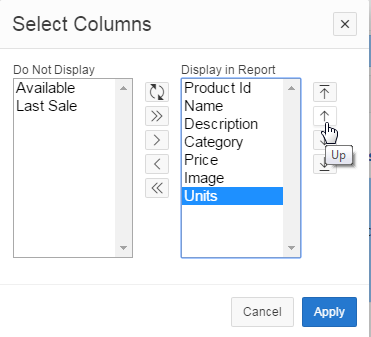
Units is moved to the Display in Report area. You want to move the Units column above the Image column. Select Units, and click the Up icon.
Description of this image -
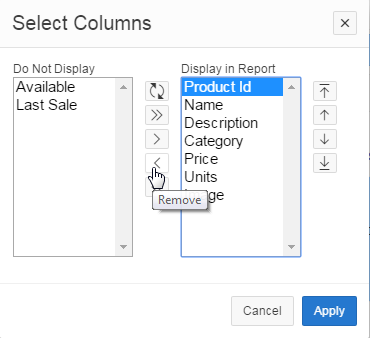
You want to remove the Product Id column from the report. Select the Product Id column from the list of Display in Report columns, and click the Remove icon.
Description of this image -
Click Apply.

Description of this image -
Notice that the Units column is displayed in the report and Product Id column is removed.
Description of this image -
You can create a computed column. In this case, you want to create a column that shows the sales for each product. Click the Actions menu, select Format, and select Compute.
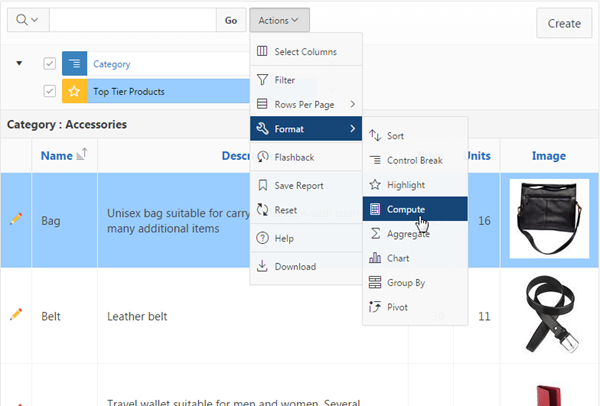
Description of this image -
Enter Sales for Column Heading, and select $5,234.10 for Format Mask.

Description of this image -
Under Columns, select Price.
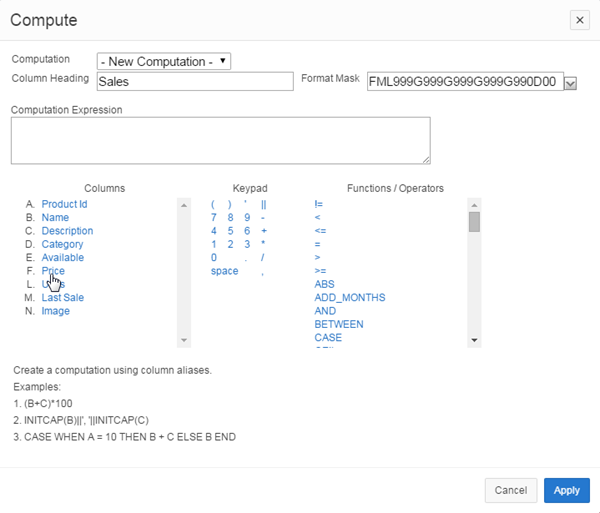
Description of this image -
Notice that the letter corresponding to the selected column appears in the computation area. Select * from the Keypad area.

Description of this image -
Now, select Units under Columns.

Description of this image -
Notice that the computation expression is created. Click Apply to create the Sales column.
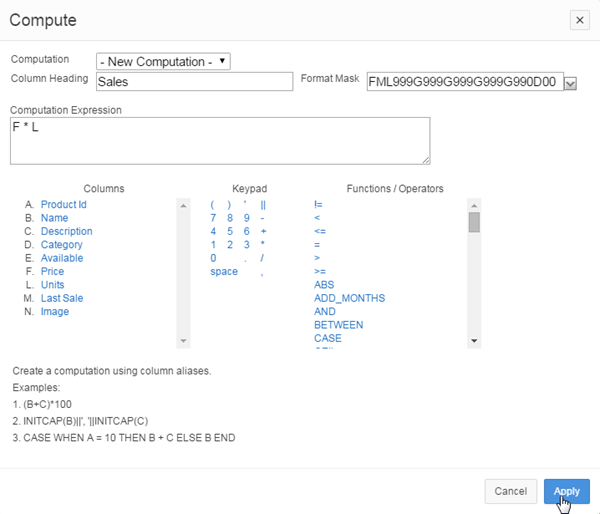
Description of this image -
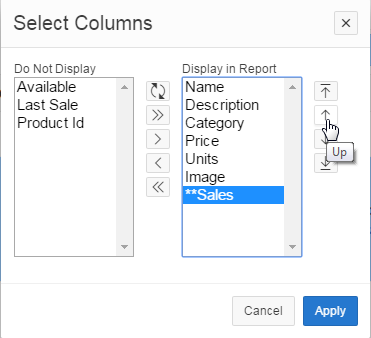
Notice that the computed Sales column now appears in the report. If you want to reposition this computed column on the report, click Actions, and select Select Columns.
Description of this image -
Select **Sales from the Display in Report area, and click the Up icon.
Description of this image -
Click Apply.
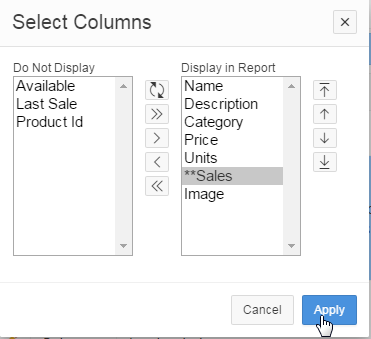
Description of this image -
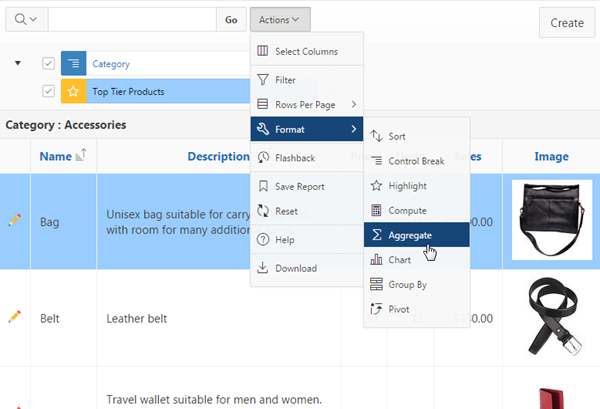
Notice that the **Sales column is now displayed before the Image column. You can also aggregate a particular column. Click the Actions menu, select Format , and select Aggregate.
Description of this image -
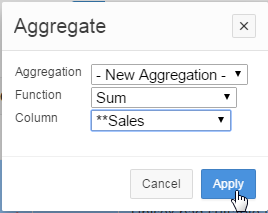
You want to total the Sales column. Select Sum for Function, **Sales for Column, and click Apply.
Description of this image -
You now see total sales for each category.
Note: The aggregated column inherits any formatting from the base column.
Description of this image -
You can also create a group by report. From the Actions menu, select Format, and select Group By.

Description of this image -
Specify the following and click Apply.
Field Value Add Group By Column Name Functions Percent of Total Sum
Column **Sales
Label Total Percent of Sales
Sum <Check the check box> 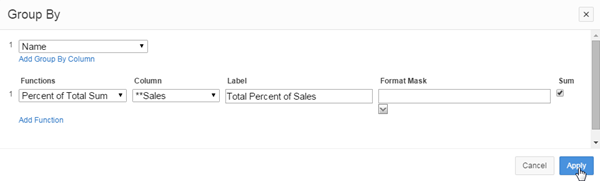
Description of this image -
The Group By Report is displayed. It shows the Total Percent of Sales for each Product. Notice that it displays only 5 rows in the report. You want to change this setting to show all the records. From the Actions menu, select Rows Per Page, and select All.

Description of this image -
All the rows are displayed. To return to the Report view, select the View Report icon.

Description of this image -
You can save all the customizations you made to a saved report. Click the Actions menu and select Save Report.

Description of this image -
Enter My Report for the Name, and click Apply.
Note:- Save as Named Report is available to all authenticated end users (when saving reports is enabled for the region). The report settings are displayed as a tab above the report, with the name you provide, and is visible only for the APP_USER who saved it.
- Save as Default Report Settings is only available to developers. These settings are applied to anyone who comes to the page for the first time in a session.

Description of this image -
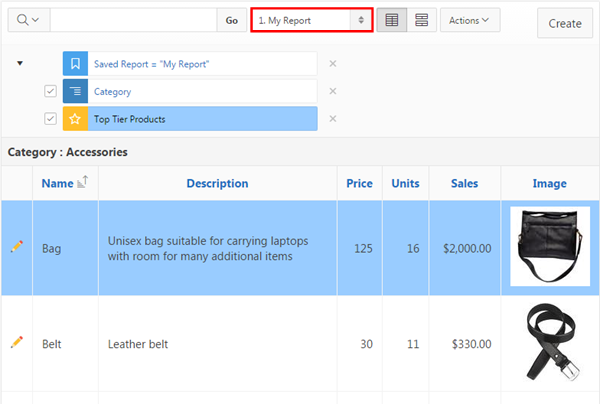
You just created a private report called My Report. Notice that you now see a drop down list of the reports you have created. This customized view will be available each time you log in.
Description of this image -
To go back to the other view, select Primary Report from the list of reports.

Description of this image -
With the Primary Report selected, select Reset from the Actions menu.

Description of this image -
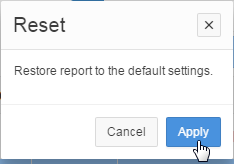
Click Apply.
Description of this image -
Note that the report has been reset back to the original version of the report. To go back to the report you formatted, select your private report, My Report from the list.

Description of this image -
The formatted report is displayed. In the next section, you will examine some additional customization options. Select Edit Page 2 in the developer toolbar.

Description of this image
Customizing Your Interactive Report
-
In the Rendering tab, under DEMO_PRODUCT_INFO, click Attributes.

Description of this image -
In the property editor, under Actions Menu, select the following values:
Property Value Highlight No
Save Public Report Yes
Subscription Yes

Description of this image -
Under Download, ensure that all the check boxes are selected for Download Formats, and click Save and Run Page.

Description of this image -
Select Save Report from the Actions menu.

Description of this image -
Enter Product Report by Category for Name and check the Public check box and click Apply.

Description of this image -
Select the drop down list of Reports and notice that you now have a public report which can be accessed by anyone. The private report can only be accessed by the person who created it.

Description of this image -
From the Actions menu, select Format. Notice that the Highlight option is no longer available because you deselected it from Actions Menu, in the property editor.
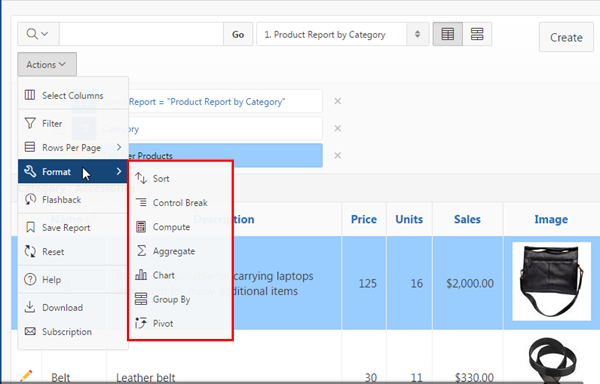
Description of this image -
From the Actions menu, select Download.
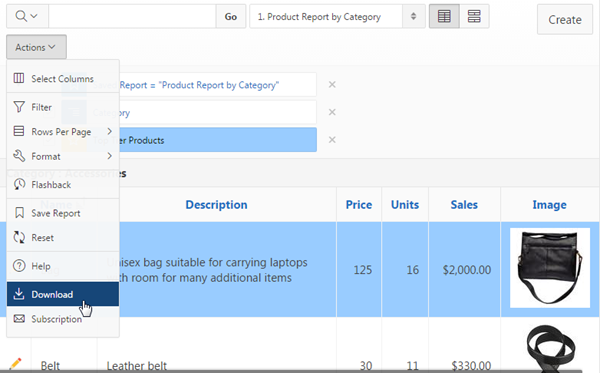
Description of this image -
Select the Email format.

Description of this image -
To send the report via email, you can enter an email ID in the To field and click Send. In this case, you click Cancel.

Description of this image -
Below is a view of the report that appears in the email message.

Description of this image -
To set up an automatic email of the report to be sent on a scheduled basis, select Subscription from the Actions menu.
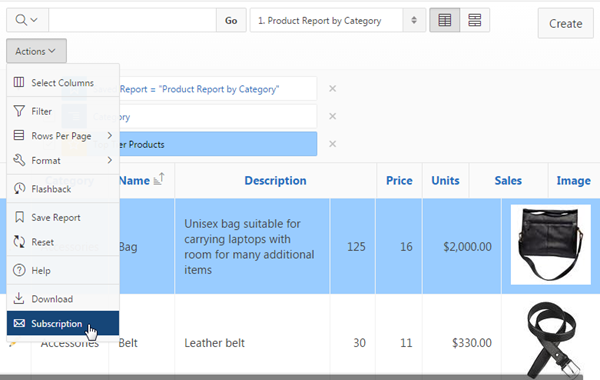
Description of this image -
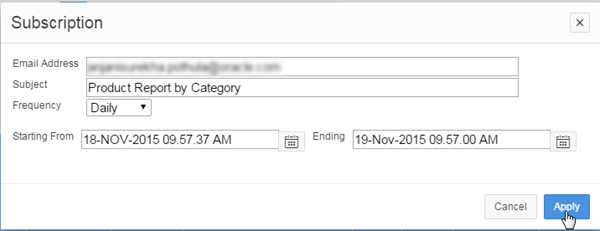
Enter your email ID for Email Address, Product Report by Category for Subject, Daily for Frequency. You only want the subscription to last 1 day. So, select the next day's date for Ending, and click Apply.
Description of this image -
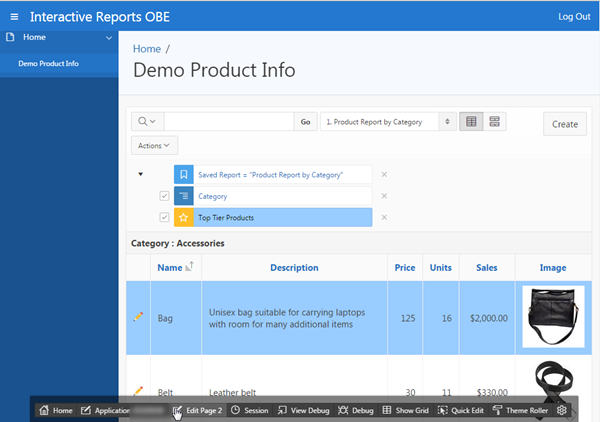
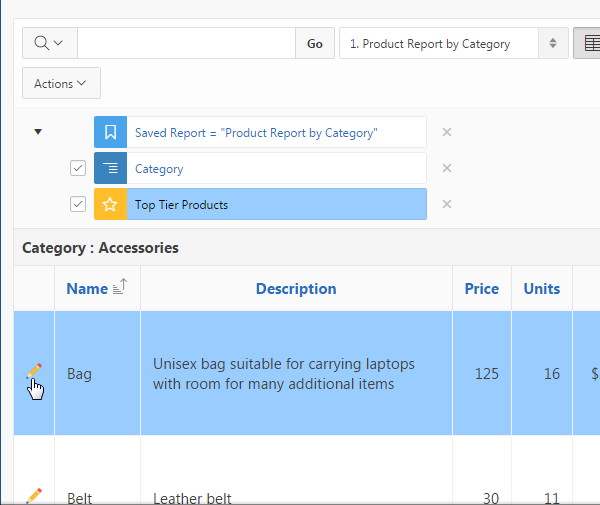
Your subscription is created. To edit a row, click the edit icon in front of any row. In this case, click the edit icon in front of Bag.

Description of this image -
The form is displayed. This form allows you to change the values for this product. You may not want to allow people to change the product information.
In this case, you can exclude the column that allows you to view this form from the report. Click Cancel.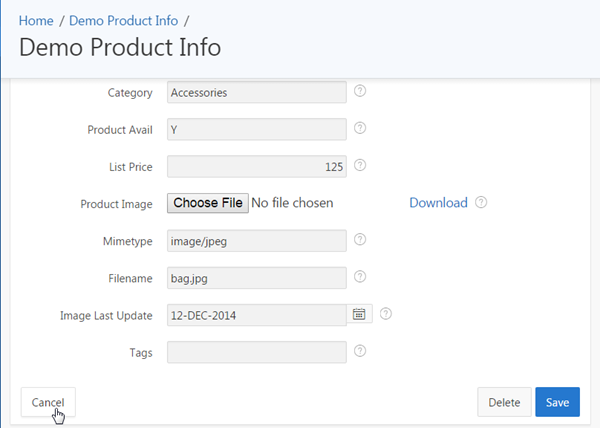
Description of this image -
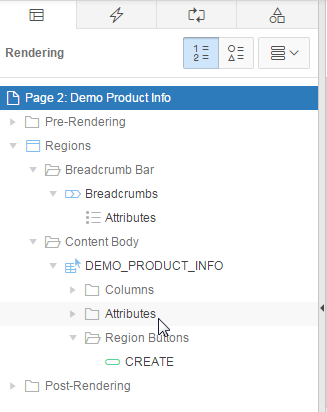
Click Edit Page 2 in the developer toolbar.
Description of this image -
In the Rendering tab, under DEMO_PRODUCT_INFO, click Attributes.
Description of this image -
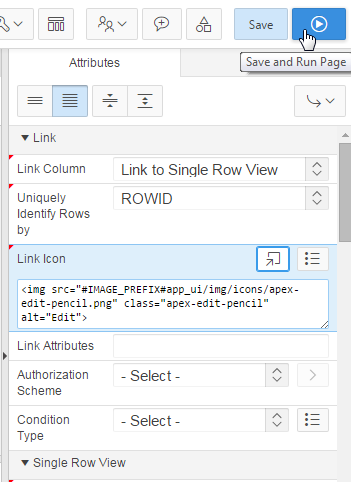
In the property editor, under Link, select Link to Single Row View for Link Column.
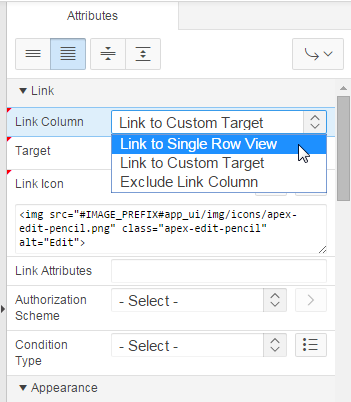
Description of this image -
Click Save and Run Page.
Description of this image -
Click the edit icon in front of Bag.
Description of this image -
The single row view is displayed. You can display the next row by clicking the > icon or click Report View to return to the report.
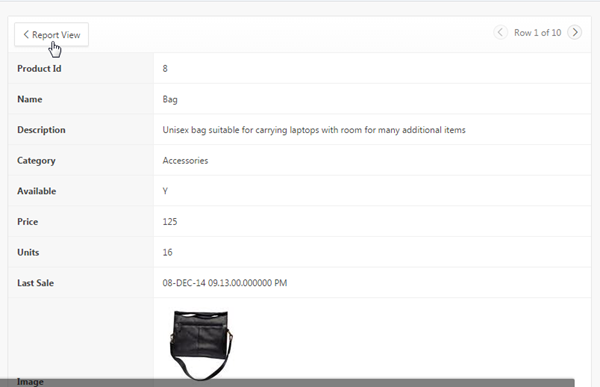
Description of this image
Summary
In this tutorial, you have learned how to:
- Create an Application with an interactive report
- Add an image to your interactive report
- Manipulate and customize your interactive report
Want to Learn More?
- Other tutorials on Oracle Database Cloud Service - Database Schema Service
Credits
-
Curriculum Developer: Anjani Pothula
- Other Contributors:Drue Swadener