Creating Navigation Pages for Mobile Apps with Oracle BI Mobile App Designer
Overview
- Oracle BI EE 11.1.1.7.x. with patch # 18794832
- The default Sample App Lite repository should be available
- Optional: a tablet with a QR code scanner to preview applications on a mobile device
Purpose
This tutorial covers how to create navigation pages for phone apps with Oracle BI Mobile App Designer, introduced in Release 11.1.1.7.x of Oracle Business Intelligence Enterprise Edition (Oracle BI EE). This tutorial is based on V2 release of BI Mobile Apps, released early June, 2014.
Time to Complete
Approximately 20 minutes
Introduction
Oracle BI Mobile App Designer enables you to design purposeful apps for mobile phones and tablets. Navigation pages for phone apps enable you to create a hierarchical list of filters that you can use to investigate your data.
Hardware and Software Requirements
The following is a list of hardware and software requirements:
Prerequisites
None
Starting the Oracle BI Mobile App Designer
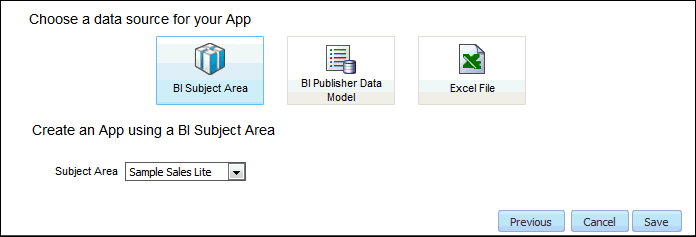
- Under "Choose a data source for your App," select BI Subject Area.
- In the Subject Area drop-down list, select Sample Sales Lite.
In this topic, you sign in to Oracle BI EE and open the Mobile App Designer.
Open a web browser and enter the URL for your instance of Oracle BI EE. Note: The default URL is http://<servername>:7001/analytics, but your URL may vary).
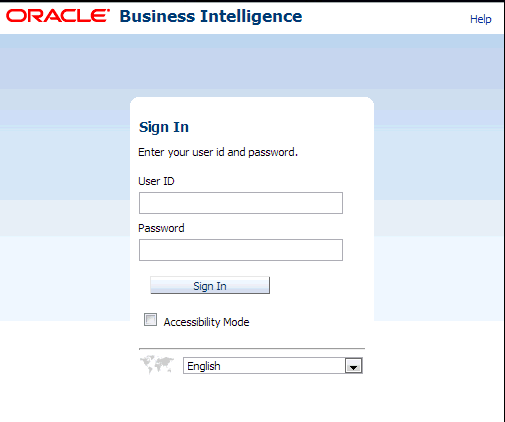
The Oracle Business Intelligence Sign In page is displayed.
Enter the user name and password of a user with BI Author privileges or higher, and then click Sign In.
Click Home to display the default Oracle Business Intelligence home page.
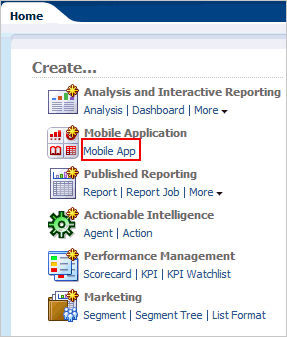
In the left navigation pane, under Create, click Mobile App to start the Mobile App Designer.
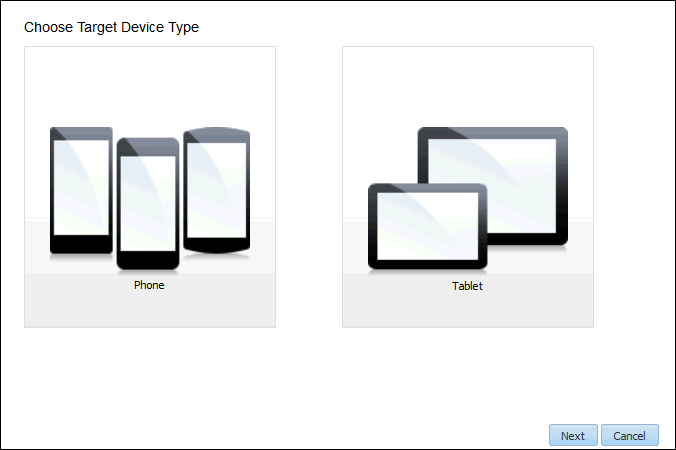
The Create App dialog box is displayed. Under "Choose Target Device Type," click Phone.
On the next page, select the data source:
Click Save to open the Save As dialog box.
Under My Folders, create a new folder. Click the new folder icon  .
.
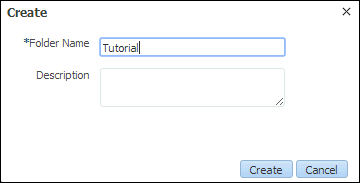
Save the app as OBE_Navigation_Demo in the Tutorial folder, and then click Save.

The Mobile App Designer is displayed.
Creating Navigation Pages for Investigating Data
- In the aggregation function drop-down list, select SUM.
- In the data field drop-down list, select Revenue.
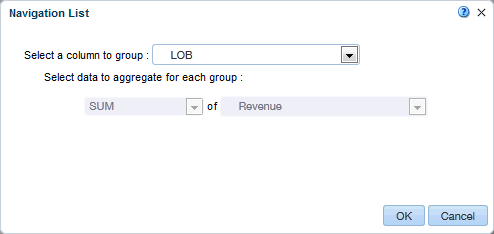
- With Revenue by Year selected in the page sidebar, click New Page and from the Subpage section, select Navigation.
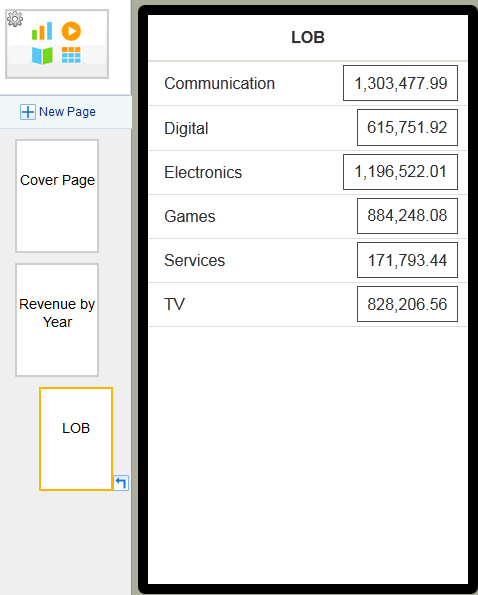
- In the drop-down list, select LOB.
- Click OK. The LOB subpage is displayed.
- Click New Page, and from the Subpage section, select Navigation.
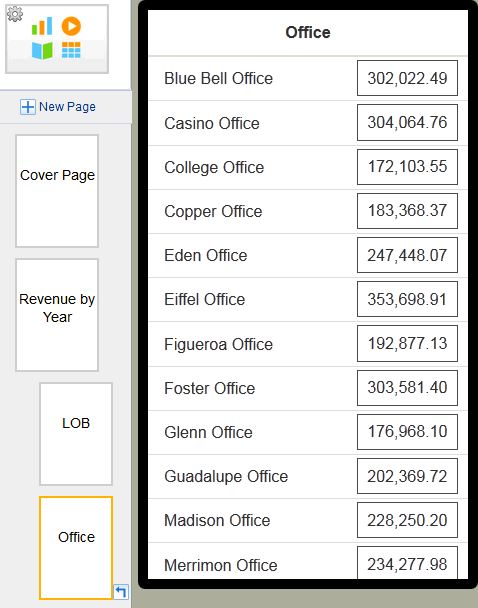
- In the drop-down list, select Office.
- Click OK. The Office subpage is displayed.
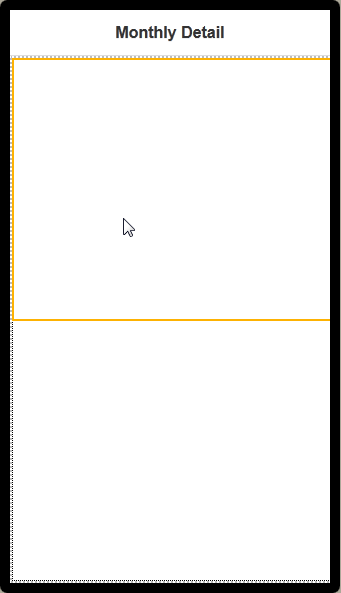
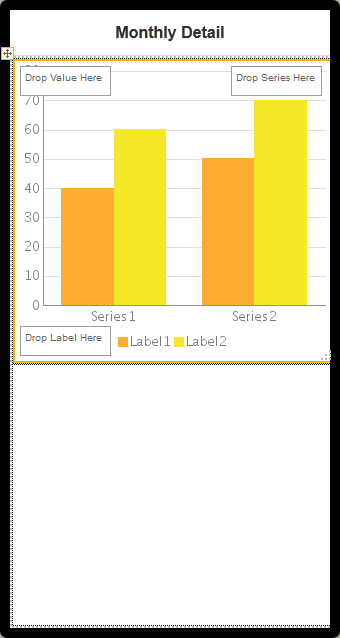
- On the Monthly Detail page, select the top row.
- Click the add component icon
 , and then drag and drop the Chart to the top row.
 - Drag the following columns from the Data Source into the chart:
- Value area: Revenue (located under Sample Sales Lite > Base Facts)
- Label area: Per Name Month (located under Sample Sales Lite > Time)
- Per Name Month (located under Sample Sales Lite > Time)
- Revenue (located under Sample Sales Lite > Base Facts)
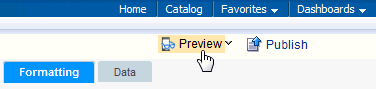
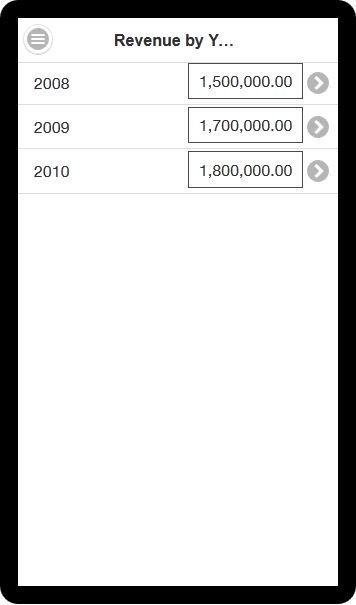
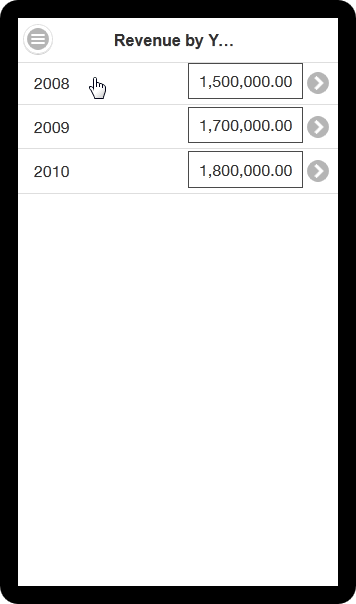
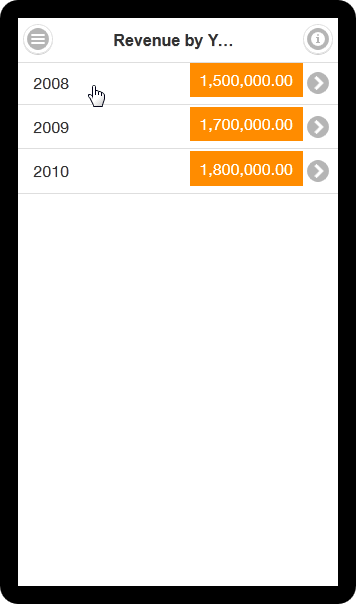
- In the page sidebar, select the Revenue by Year page, and then click Preview.
- Wait for the template to load. The Revenue by Year page is displayed.
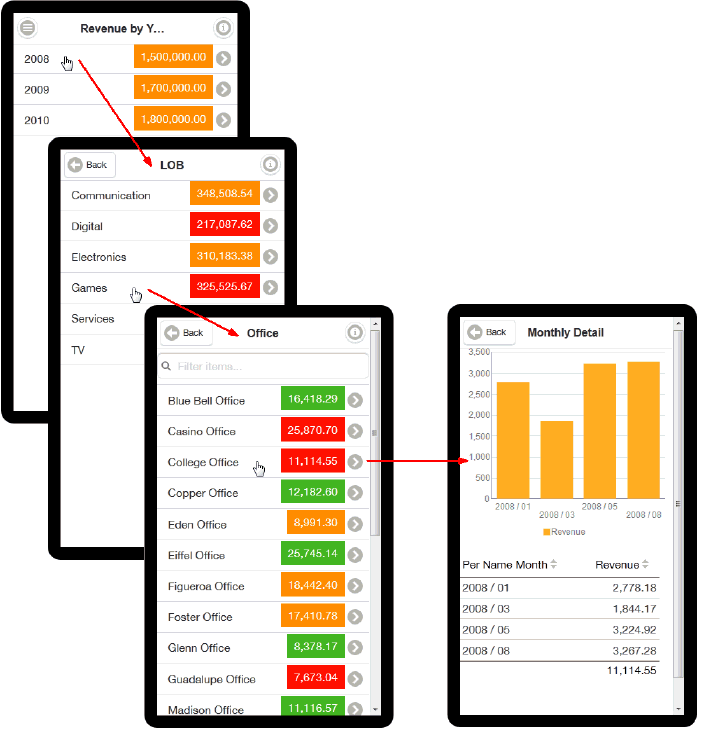
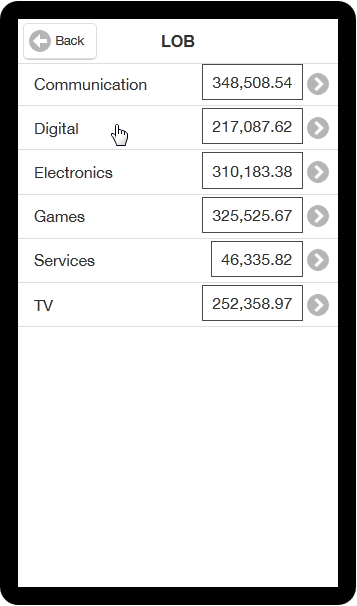
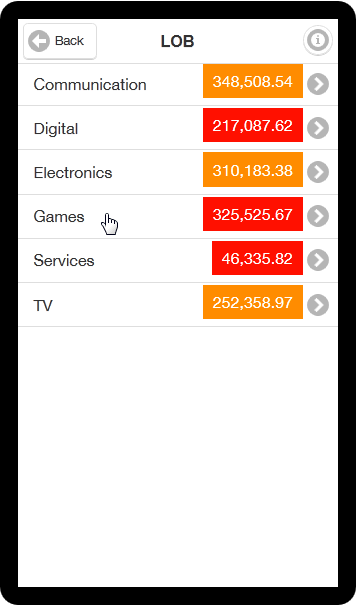
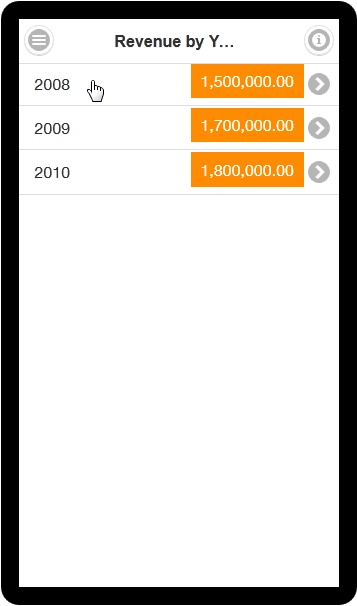
- Tap 2008 to view only 2008 data and navigate to the LOB subpage.
- The LOB subpage is displayed, showing only 2008 data. Tap Digital to view only data for the Digital LOB and navigate to the Office subpage.
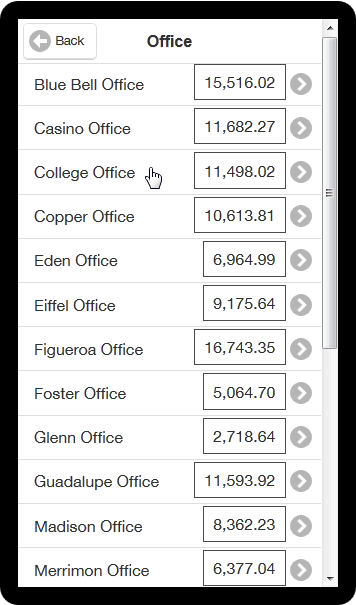
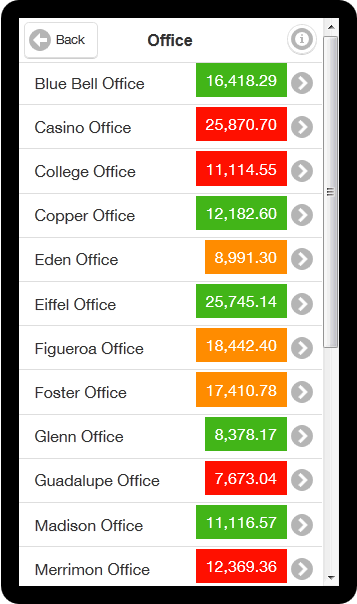
- The Office subpage is displayed, showing only data for 2008, for the Digital LOB. Tap College Office to navigate to the Monthly Detail subpage.
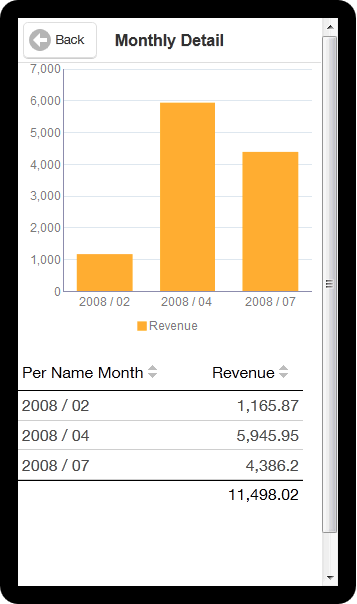
- The Monthly Detail page is displayed, showing revenue data for only the College Office, for the Digital LOB, in 2008.
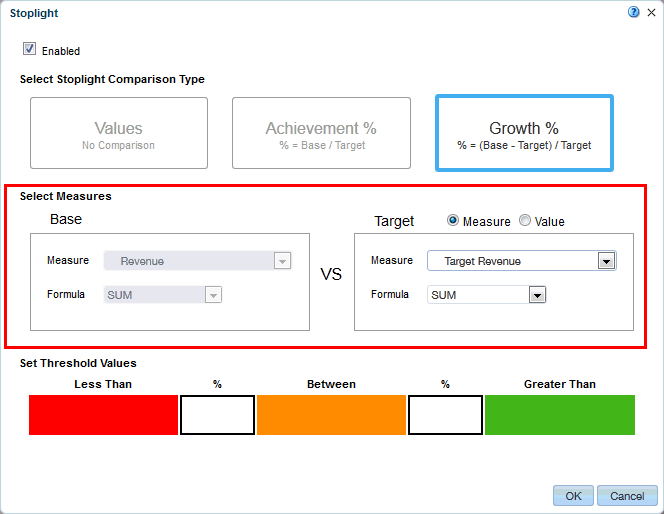
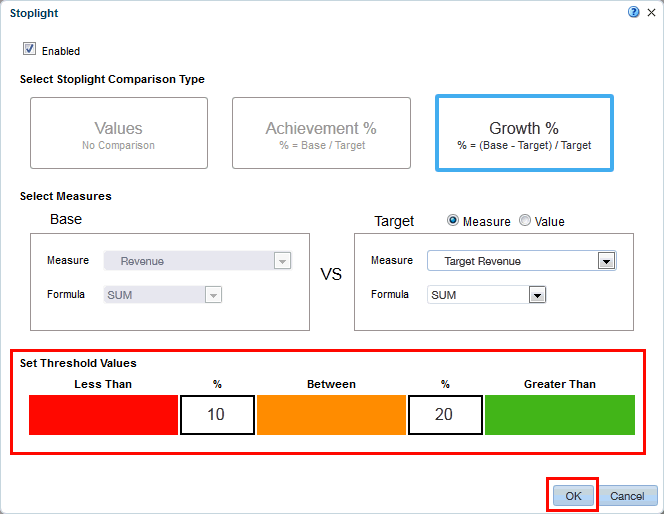
- Target: Measure
- Target Measure: Target Revenue
- Target Formula: SUM
- Less Than: 10
- Greater Than: 20
- Click Preview, and then wait for the page to load in the previewer.
- Tap 2008 to view only 2008 data and navigate to the LOB subpage.
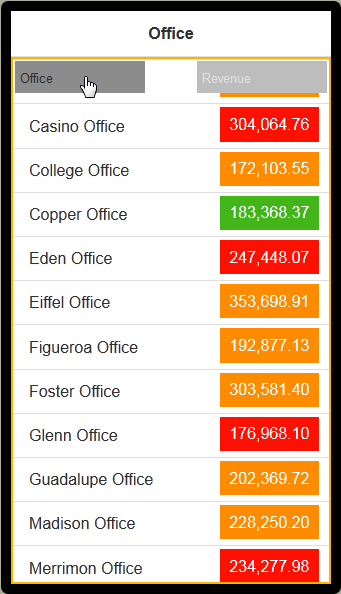
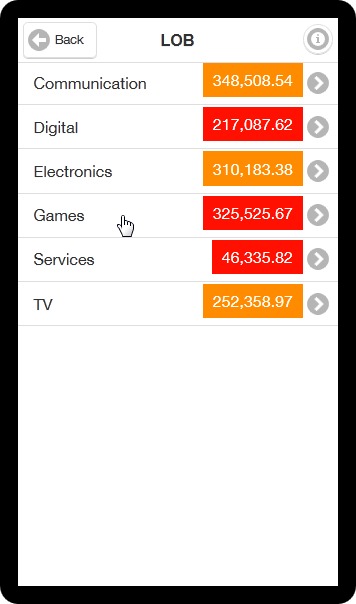
- Notice that in the LOB list, the Stoplight formatting shows that revenue growth for Digital, Games, and Services is below the 10% growth threshhold, compared to target revenue. Tap Games to investigate the data.
- Notice that the Stoplight formatting enables you to see at a glance where the revenue growth for an office is below the 10% growth threshhold compared to target revenue. Also notice that the list of offices does not fit on a single page; you have to swipe to scroll through the list.
- Select the Revenue by Year page.
- Click Preview, and wait for the page to load in the previewer.
- In the navigation area, tap 2008 to view only 2008 data navigate to the LOB subpage.
- Notice that in the LOB list, the Stoplight formatting shows that revenue growth for Digital, Games, and Services is below the 10% growth threshhold, compared to target revenue. Tap Games to investigate the data.
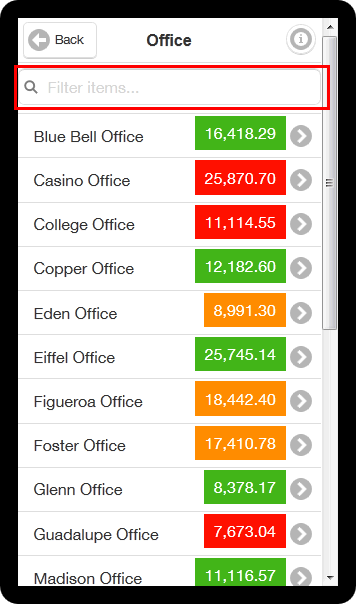
- Notice that a data filter is displayed at the top of the list of offices.
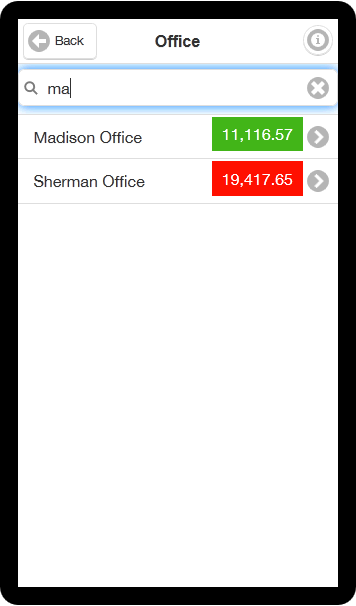
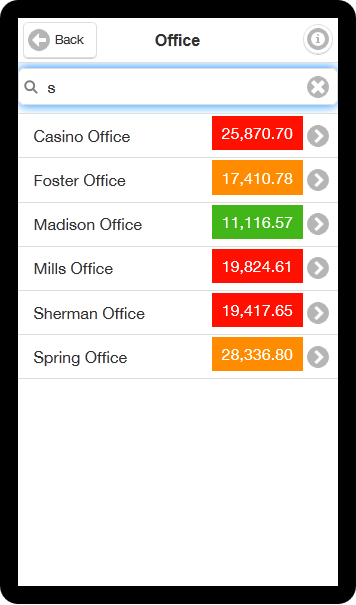
- Experiment by entering text strings into the data filter. For example, entering ma returns "Madison Office" and "Sherman Office," and entering s returns every office with an s in its name.
Navigation pages enable you to define a navigable set of filters that you can use to filter the data visualized on the page. The navigation area of the page contains a hierarchy of dimensions that you tap through to drive the display on the detail side of the page; you can see successively more refined sets of data, or navigate up and down the hierarchical filters to see the subset of data that interests you.
In this topic, you learn how to create the following navigation page, which enables you to navigate from a yearly revenue summary, to revenue for lines of business, and then to revenue for individual offices.
Inserting Navigation Pages
In the page sidebar, click New Page, and select Navigation.
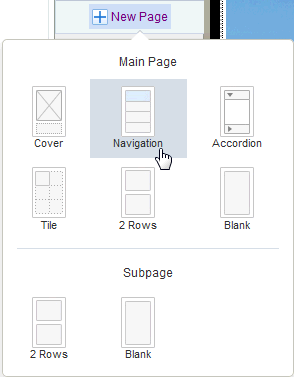
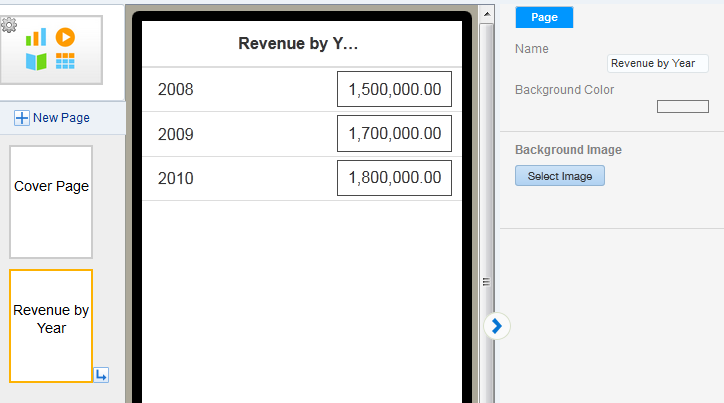
The Navigation List dialog box is displayed. In the drop-down list, select Per Name Year to specify years as the top level in the navigation hierarchy.
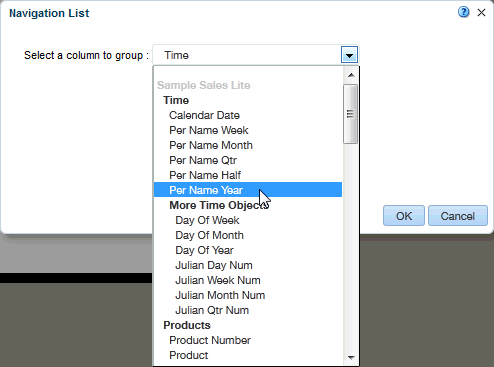
Note: The data source column you select defines the top level of the navigation menu.
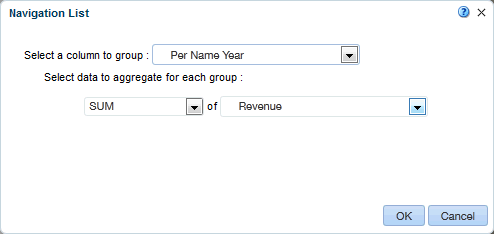
Under "Select data to aggregate for each group," define a sum of revenue to display next to the navigation groupings:
Click OK to display the Navigation page.
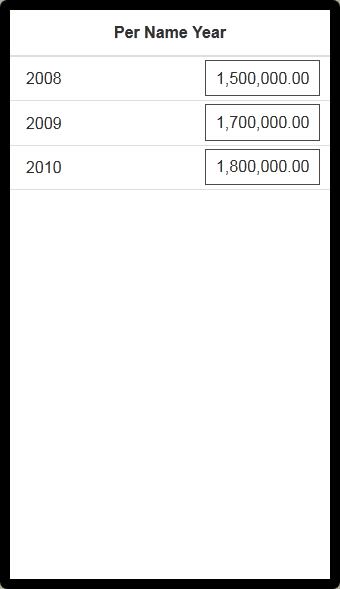
Select the Per Name Year page, and in the page properties bar, change the page name to Revenue by Year.
Note: You can also double-click the page name, or double-click the page header to edit the page name.
Creating the Navigation Hierarchy and Content
Add navigation subpages to the Revenue by Year page to create the navigation hierarchy:

Notice that SUM and Revenue are already selected, because this page is a subpage.
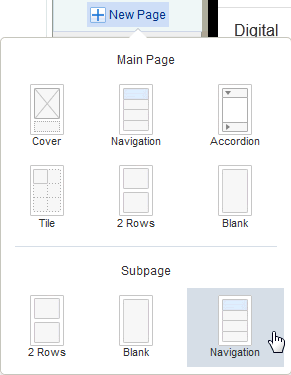

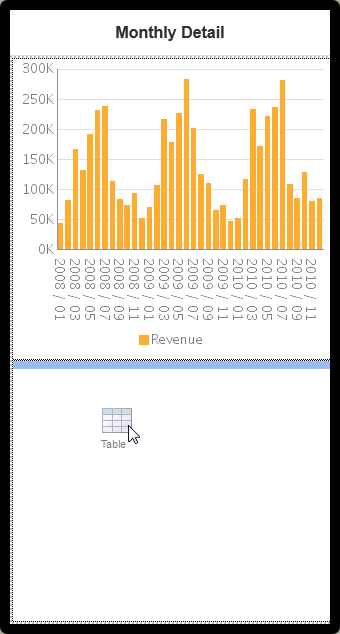
Next, add a detail subpage where you can add a table and a chart for revenue by month. Click New Page, and in the Subpage section, select 2 Rows.
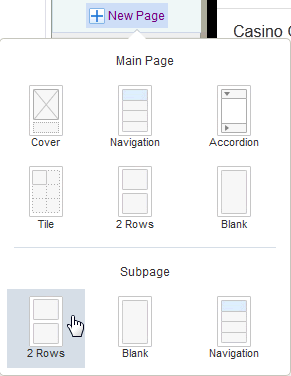
Rename the new page Monthly Detail.
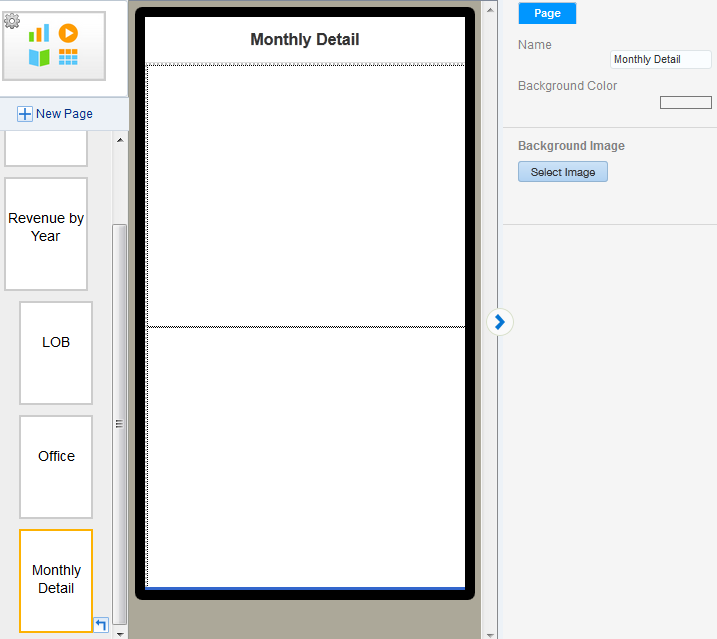
Insert a chart that shows revenue by month:
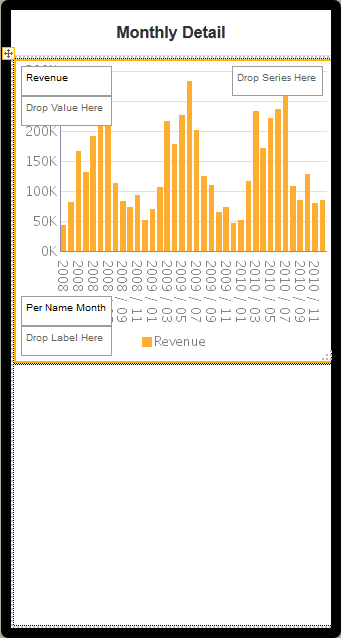
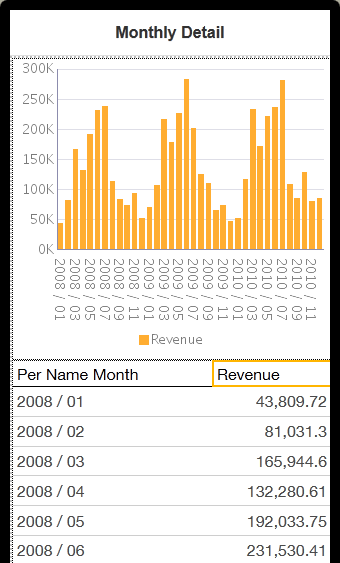
Insert a table that shows the breakdown of revenue based on your navigation choices. Click the add component icon , and then drag and drop the Table to the bottom row.
Drag the following columns from the Data Source panel to the table:
Preview the Navigation page:
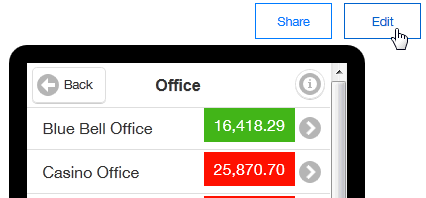
Click Edit to return to the Mobile App Designer.
Formatting Navigation Hierarchies
Similar to tile pages, you can add Stoplight formatting to navigation hierarchies to highlight values conditionally, based on static threshold values, a comparison to a target value, or a comparison to another field. This section shows you how to add Stoplight formatting to revenue values, based on a comparison to target revenue.
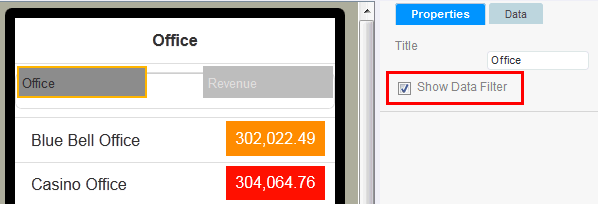
Additionally, if levels in your navigation hierarchy have too many members to display on one page, you can add a data filter to the column. Data filters enable you to search for specific members in the column. This section also shows you how to add a data filter to the Office column.
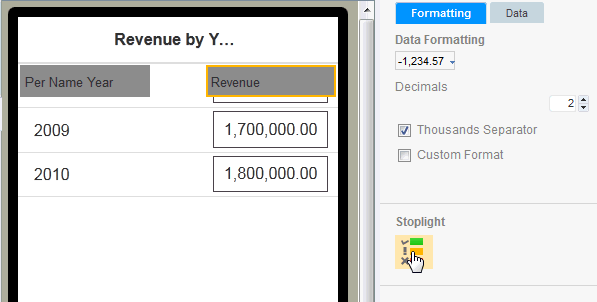
Select the Revenue by Year page. In the workspace, select the navigation columns to display column headers, and then select the Revenue column header to display formatting options for the column.
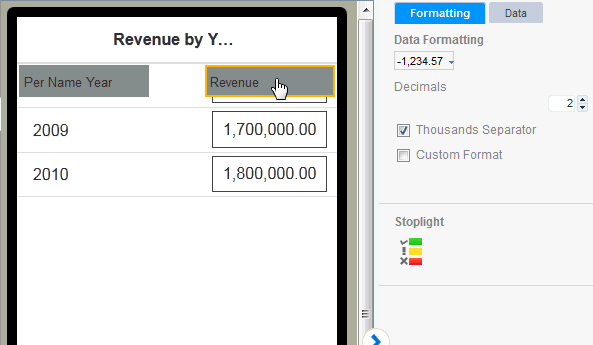
Click the Stoplight icon to display Stoplight formatting options.
Verify that Stoplight formatting is enabled.
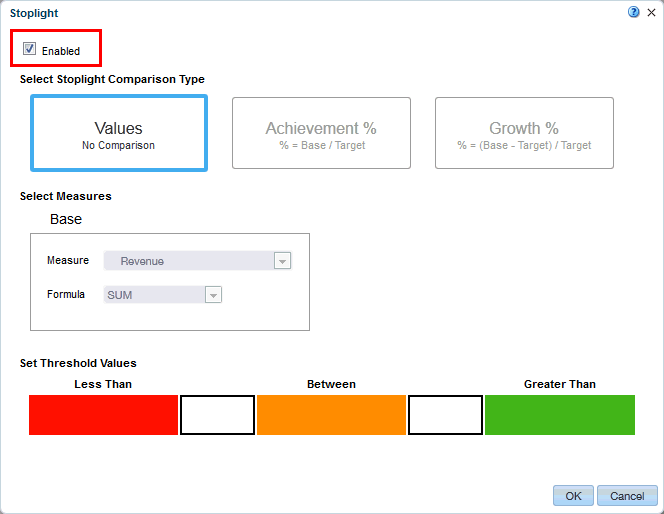
Under Select Stoplight Comparison Type, select Growth %.
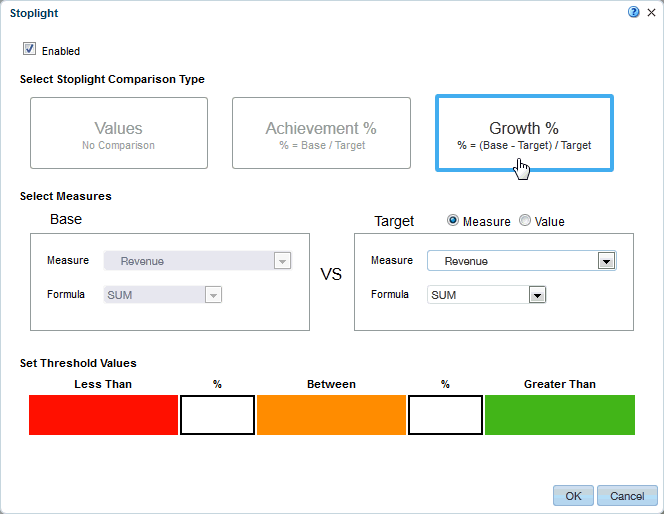
Notice that the base measure and formula is pre-selected, based on your column values. Under Select Measures, make the following selections:
Under Set Threshold Values, enter the following values, and then click OK:
Preview the Revenue by Year page with Stoplight formatting:
Click Edit to return to the Mobile App Designer.
Select the Office page. Click in the workspace to display the column headers, and then select the Office column header.
In the Properties sidebar, select Show Data Filter.
Click the Save icon to save your app.
Preview the results of adding a data filter for the Office page:
Summary
- Start BI Mobile App Designer
- Design apps with navigation pages
- Add navigation and detail subpages
- Add stoplight formatting and data filters to navigation pages
- Lead Curriculum Developer: Lisa Alexander
- Other Contributors: Kan Nishida and Kasturi Shekhar
In this tutorial, you have learned how to:
Resources
To learn more about Oracle BI EE, search for additional OBEs in the Oracle Learning Library.
Credits
To navigate this Oracle by Example tutorial, note the following:
- Hide Header Buttons:
- Click the title to hide the buttons in the header. To show the buttons again, click the title again.
- Topic List:
- Click a topic to navigate to that section.
- Expand All Topics:
- Click the button to show or hide the details for the sections. By default, all topics are collapsed.
- Hide All Images:
- Click the button to show or hide the screenshots. By default, all images are displayed.
- Print:
- Click the button to print the content. The content that is currently displayed or hidden is printed.
To navigate to a particular section in this tutorial, select the topic from the list.