Creating Partitioned ASO Reporting Cubes in Essbase 11.1.2
Purpose
This tutorial shows you how to create partitioned ASO reporting cubes in Essbase 11.1.2.
Time to Complete
Approximately 45 minutes
Overview
For analytical applications spanning a variety of businesses, Essbase block storage (BSO) cubes provide a world class analytical engine for complex modeling. BSO cubes typically contain fewer (and smaller) dimensions than aggregate storage (ASO) cubes but can perform numerous and complex calculations on the smaller outlines. ASO cubes are designed to provide rapid aggregation capabilities for much larger Essbase outlines, typically supporting many more (and larger) dimensions.
For some projects, combining the calculation strengths of BSO with the aggregation strengths of ASO offers the best fit for your Essbase analytical needs. An ASO reporting cube, employed to handle all aggregations, is one example.
An ASO reporting cube can be designed with or without partitioning. In a partitioned solution, the reporting cube acts as a "target," accessing the "source" databases as required to satisfy retrieval requests. In a non-partitioned solution, data is extracted from the data sources and loaded into the ASO reporting cube, often using offline scripts and batch files.
Scenario
The Hyptek corporation, manufacturer of hard disk drives, uses an Essbase BSO cube for top-down sales forecasting. Forecasts are input at a high level, then pushed down to the lowest level using a series of sophisticated calculation scripts. An Essbase ASO cube, with more dimensions, is used for aggregating actual (historical) and budget sales data.
Hyptek management would like to build an ASO reporting cube that enables their analysts to view forecast data along with actual and budget data in a single reporting environment. The ASO cube should utilize a partitioned design that transparently accesses forecast data (stored in BSO cube Fcst_BSO) with actual and budget data (stored in ASO cube AcBu_ASO). Hyptek management is aware that extra effort will be required to maintain the partitions, but they feel that the timeliness of reporting through partitioning outweighs the extra work. (As soon as source cube updates are complete, data is available for reporting, as data is accessed transparently through the partitions.)
Software and Hardware Requirements
The following is a list of software requirements:
- Oracle® Essbase 11.1.2
Prerequisites
None
Creating an Application and Database for Reporting
You begin by creating an Essbase ASO application and database for reporting.
[Note: In this tutorial, the terms "database" and "cube" have the same meaning; that is, "Essbase multidimensional database." The term "database" is displayed within the user interface, Administration Services Console.]
. |
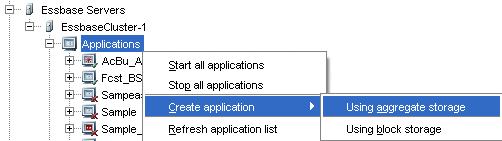
In Administration Services Console, right-click Applications, then select Create application, and then select Using aggregate storage.
|
|---|---|
. |
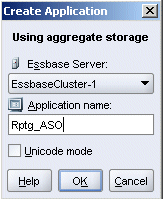
For Application name, enter Rptg_ASO, and then click OK.
|
. |
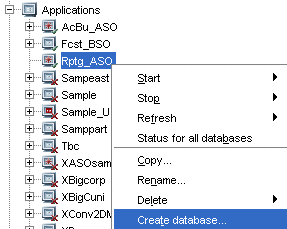
Right-click application node Rptg_ASO and select Create database.
|
. |
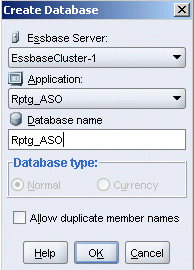
For the database name, enter Rptg_ASO, then click OK.
|
Creating the Reporting Cube Outline
The outline for the newly created reporting cube Rptg_ASO is empty. If suitable, you can use an existing ASO database outline as a starting point and save it to the Essbase Server under the reporting cube's name. Using the outline from one of the source databases simplifies the partitioning effort. In this example, you use actual-budget cube AcBu_ASO as a template (since it contains the outline members required for reporting) and save it to the Essbase Server as Rptg_ASO.
. |
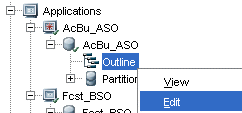
Expand database node AcBu_ASO, then right-click Outline and select Edit.
|
|---|---|
. |
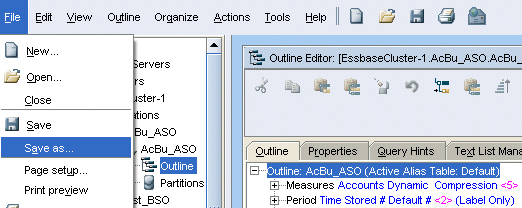
Select File, then Save As.
|
. |
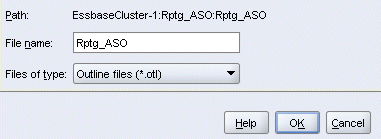
In the Save As dialog box, select the Essbase Server tab, and then navigate to database Rptg_ASO.
|
. |
Double-click the row corresponding to database Rptg_ASO (to populate the File name), then click OK.
|
. |
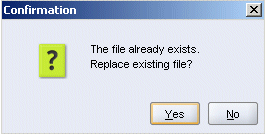
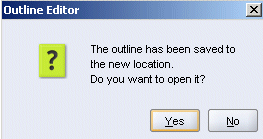
A confirmation message is displayed. Click Yes.
|
. |
An Outline Editor message is displayed. Click Yes.
|
. |
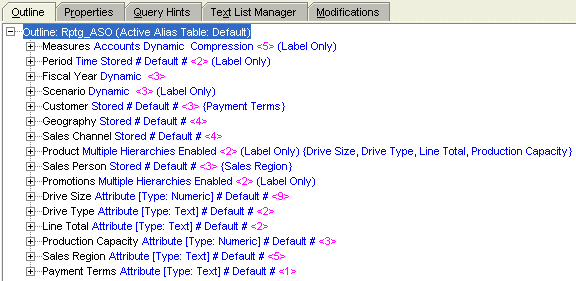
Examine the reporting cube outline.
Keep the Rptg_ASO outline open in Outline Editor for the next topic. |

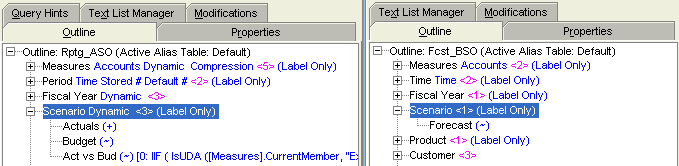
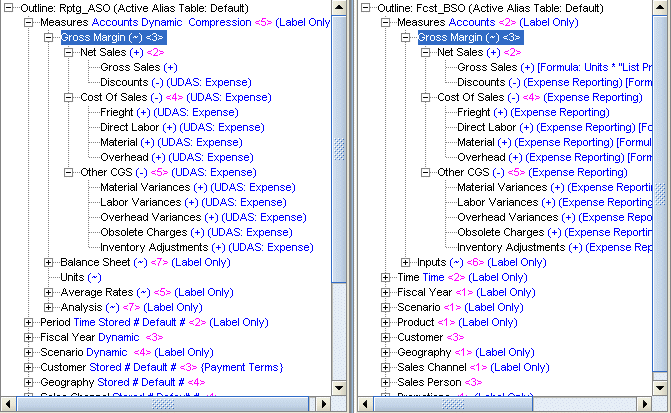
Comparing Outlines
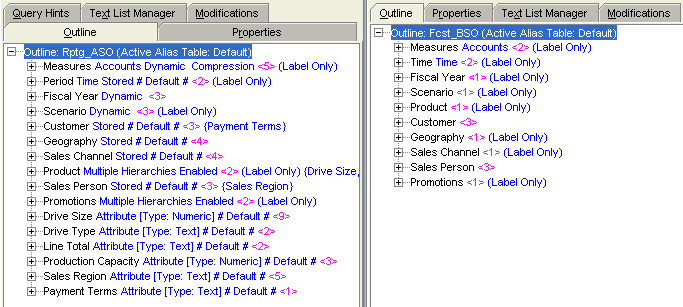
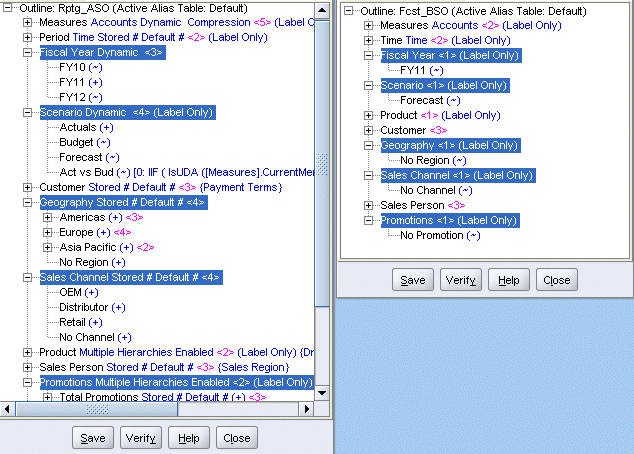
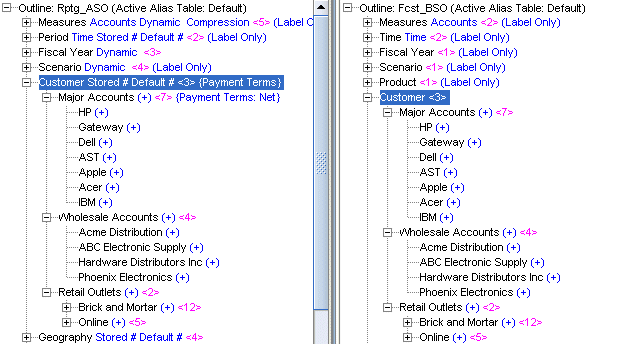
The reporting cube (Rptg_ASO) will be a partitioned application, with data sourced from the cube containing actual and budget data (AcBu_ASO) and the cube containing forecast data (Fcst_BSO). You need to compare the reporting cube and forecast cube outlines to understand how to partition the two cubes.
. |
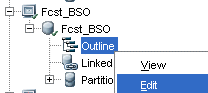
Expand database node Fcst_BSO, then right-click Outline and select Edit.
|
|---|---|
. |
In Administration Services Console, close all open objects except for the two outlines. Then select Organize, and then Tile Vertical to view the outlines side by side.
|
Adding a Forecast Scenario to the Reporting Cube
. |
Expand Scenario in both outlines.
|
|---|---|
. |
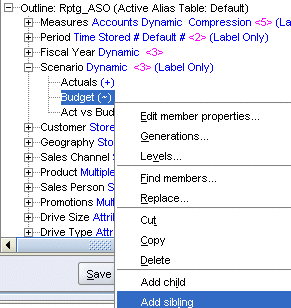
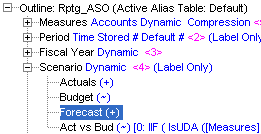
In the Rptg_ASO outline, right-click Budget and select Add sibling.
|
. |
Enter Forecast, and then press Enter.
|
. |
Another text entry box is displayed.
|
. |
Press Enter to exit text entry mode.
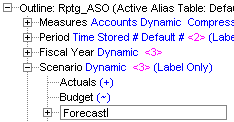
The Forecast entry is added. It needs to be a non-consolidated member of the Scenario dimension. |
. |
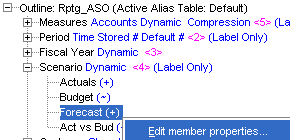
Right-click Forecast and select Edit member properties.
|
. |
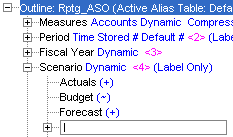
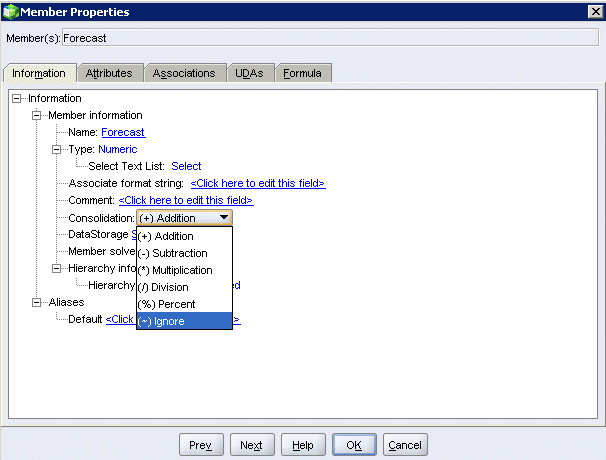
In the Information tab in the consolidation drop-down list, select (~) Ignore, and then click OK.
|
. |
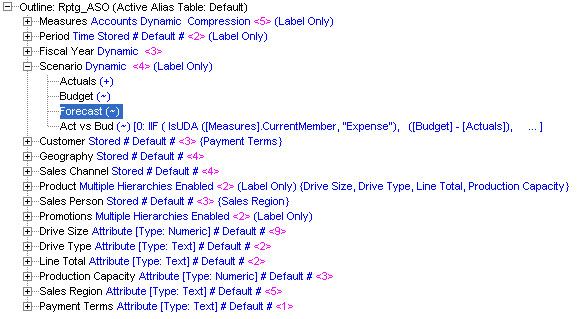
Click Save to preserve your changes to the Rptg_ASO outline.
|
. |
Close both outlines.
|
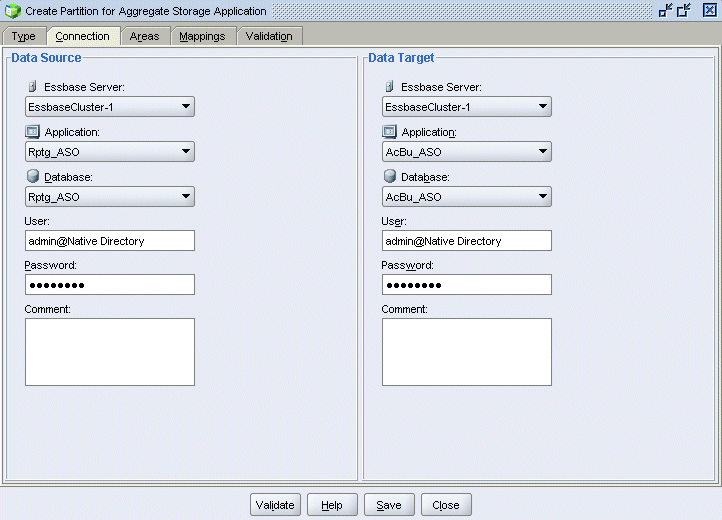
Creating a Partition for the Forecast (BSO) Database
To provide forecast data to the reporting cube, you define a transparent partition between the source cube (Fcst_BSO) and the target cube (Rptg_ASO).
. |
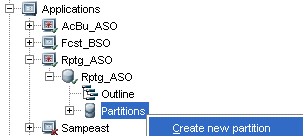
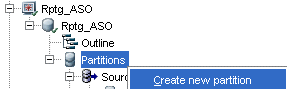
In the navigation panel, expand the Rptg_ASO database node, then right-click the Partitions node, and then select Create new partition.
|
|---|---|
. |
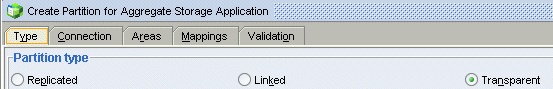
Select the Type tab, and for Partition Type, select Transparent.
|
. |
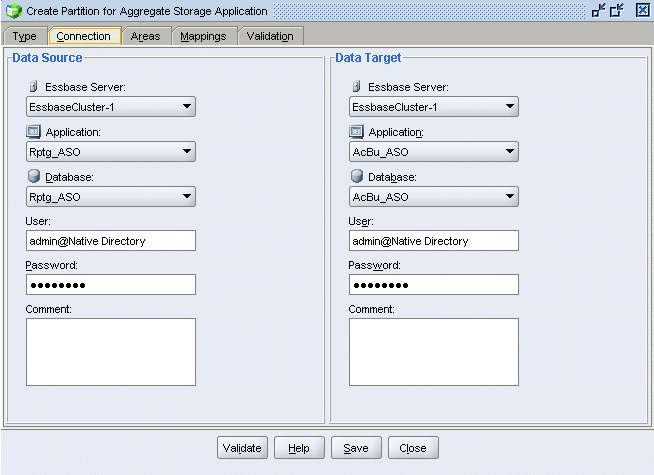
Select the Connection tab.
|
. |
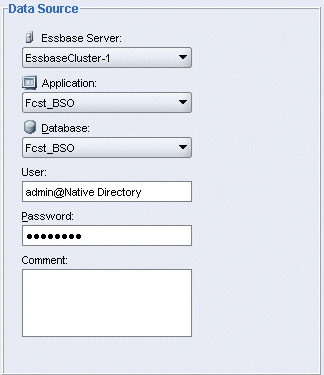
In the Data Source section, select the Essbase Server, Application, and Database name for forecast cube Fcst_BSO, then enter the appropriate connection User ID and Password.
|
. |
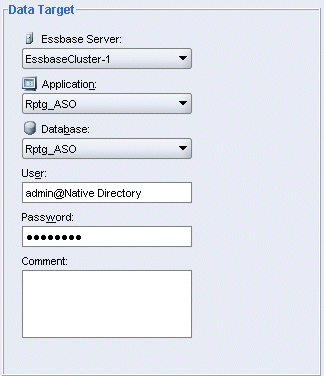
In the Data Target section, repeat the previous step to provide connection information for ASO reporting cube Rptg_ASO.
|
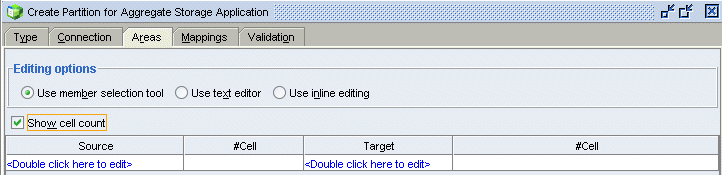
Defining the Forecast Source Partition Area
To enable the reporting cube to draw data from the forecast cube, define the outline members involved in the flow between the source cube (Fcst_BSO) and the target cube (Rptg_ASO), beginning with the source partition area.
. |
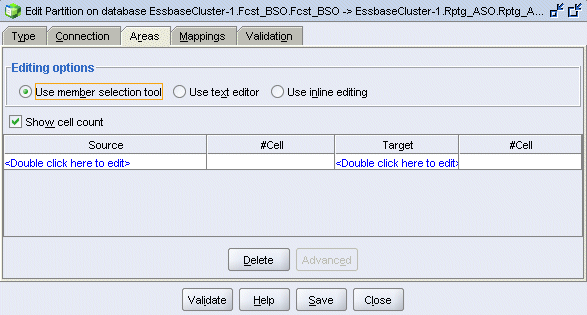
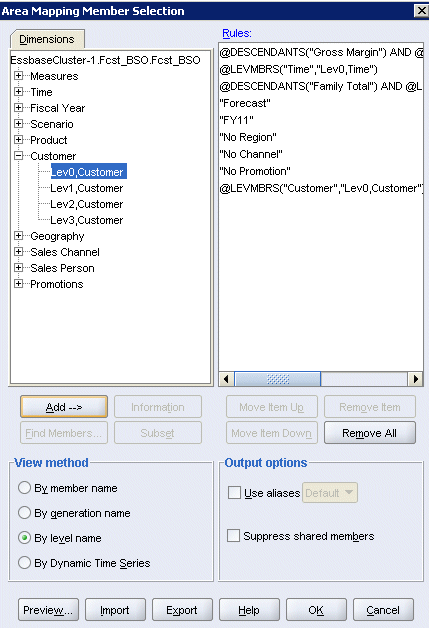
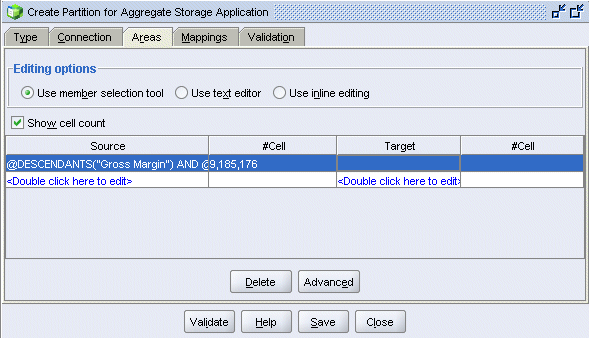
Select the Areas tab, and then select Use member selection tool and Show cell count.
|
|---|---|
. |
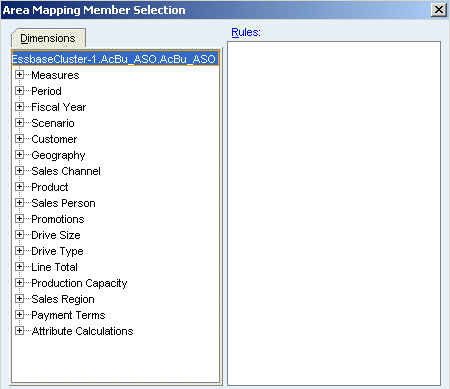
In the Source column, double-click <double-click here to edit>.
|
. |
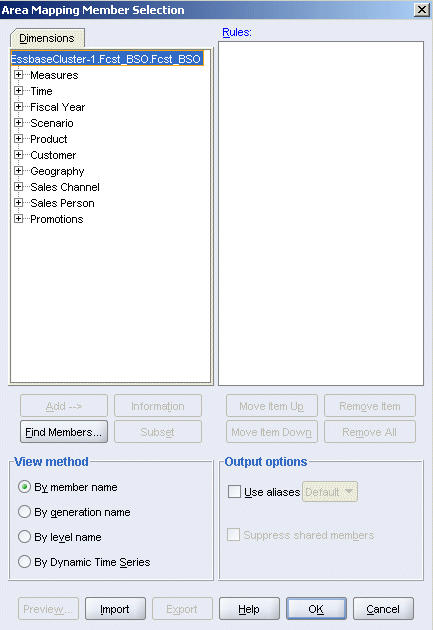
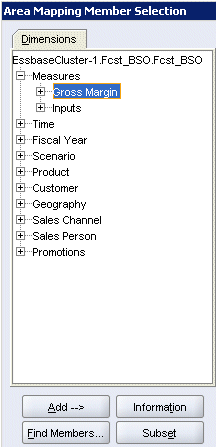
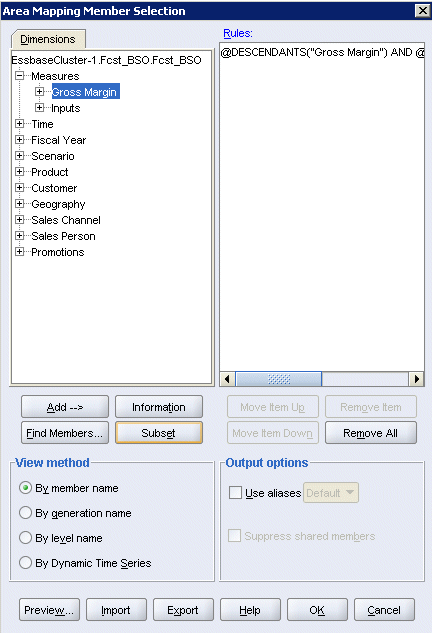
Remember: ASO targets can be partitioned only along level 0 members. To define the source area for the Measures dimension, for example, select the level 0 Measures required for reporting, in this case, the level 0 descendants of Gross Margin.
|
. |
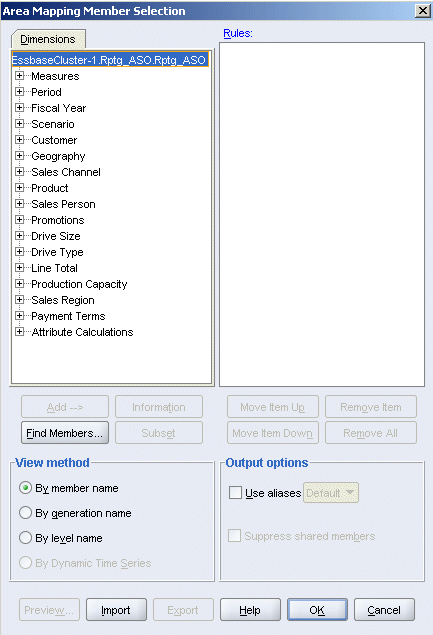
In the Area Mapping Member Selection dialog box, expand the Measures dimension, and select Gross Margin.
|
. |
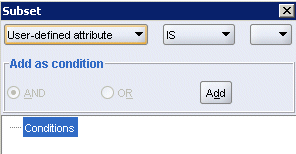
Click Subset.
|
. |
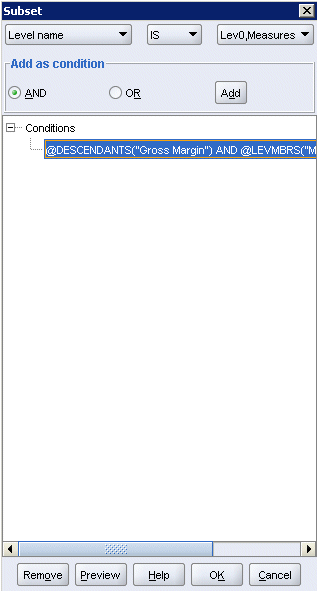
In the first drop-down list, select Level name, and in the third drop-down list, select Lev0,Measures, and then click Add.
|
. |
Click OK.
|
. |
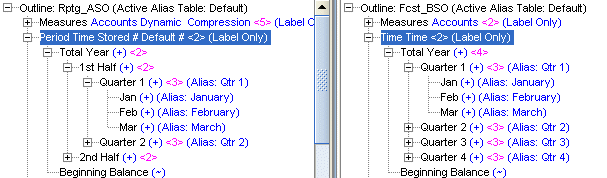
Compare the Time dimensions in each outline, in this example, Periods in Rptg_ASO and Time in Fcst_BSO. Although the upper-level members are different in each outline, the level 0 members in both dimensions are the same and can be included in the partition definition.
|
. |
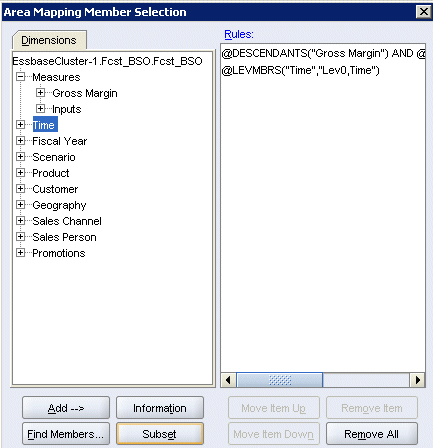
Repeat steps 4 through 7 to select the subset for the level 0 descendants of Time.
|
. |
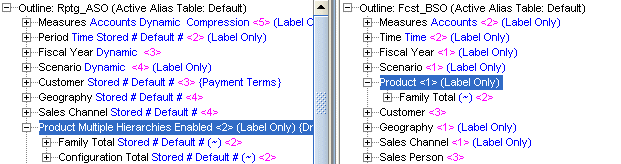
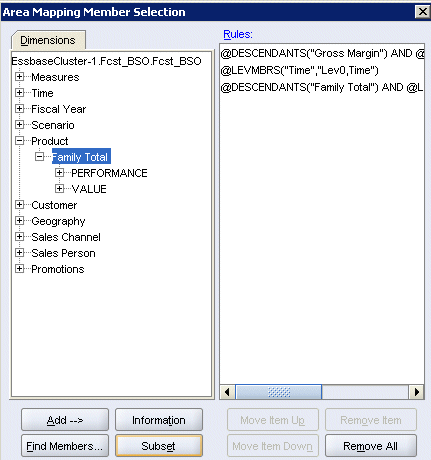
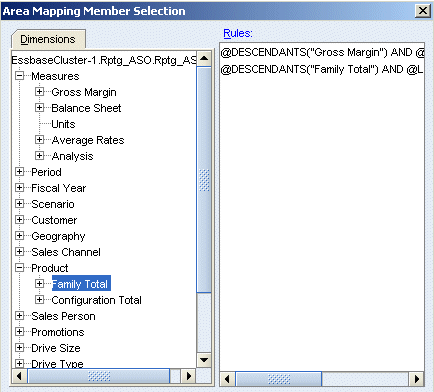
Compare the Product dimensions in each outline, defining a partition area based on common level 0 members required for reporting. In this example, the Fcst_BSO Product dimension includes the Family Total rollup, but not the Configuration Total
rollup found in Rptg_ASO.
|
. |
Repeat steps 4 through 7 to select the subset for the level 0 descendants of Family Total.
|
. |
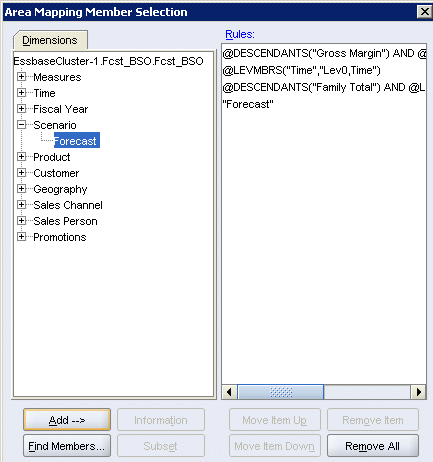
Compare the Scenario dimensions in each outline. In this example, the Forecast database has only one member (Forecast). To add this member to the partition definition for the source database, expand the Scenario dimension, then select Forecast, and then click Add.
|
. |
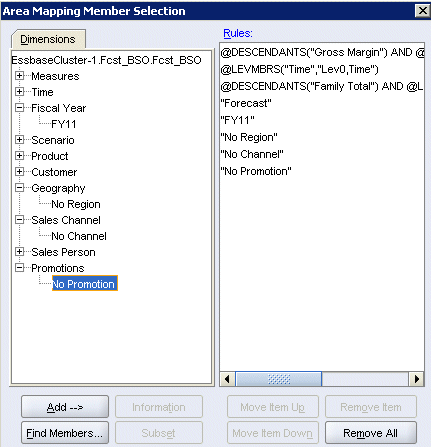
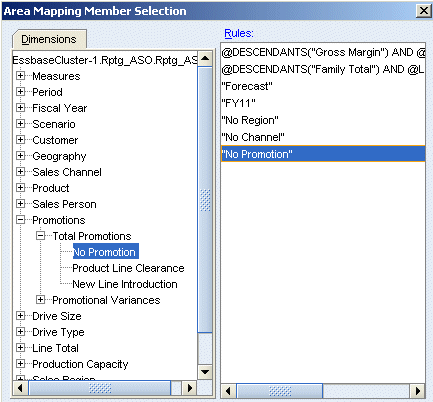
Continue your comparison of the outlines. Other dimensions may also require only a single member from the source database. In this example, the Forecast database has one member in not only the Scenario dimension, but also the Fiscal Year, Geography, Sales Channel, and Promotions dimensions.
|
. |
Repeat step 12 to select each of the following single members:
|
. |
Compare the Customer dimensions in each outline. In this example, the Customer dimensions are identical. All of the level 0 source members for Customer can be included in the source database partition definition.
|
. |
To select the level 0 members for the Customer dimension, in View Method, select By level name.
|
. |
Expand Customer, select Lev0,Customer, and then click Add.
|
. |
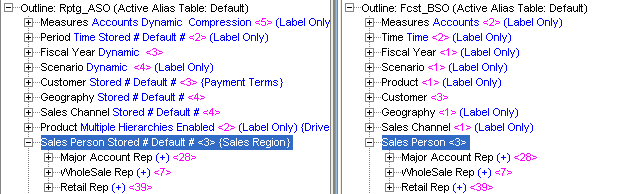
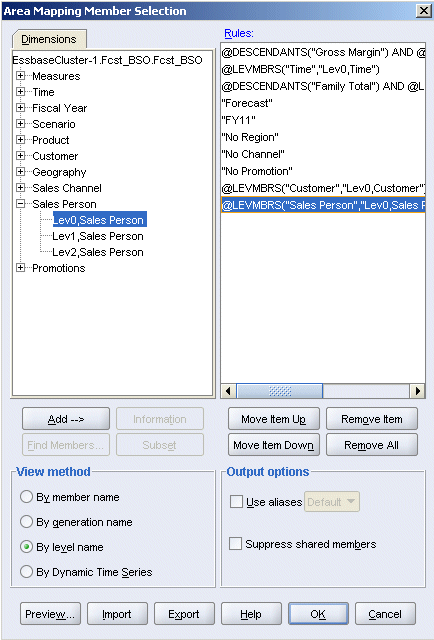
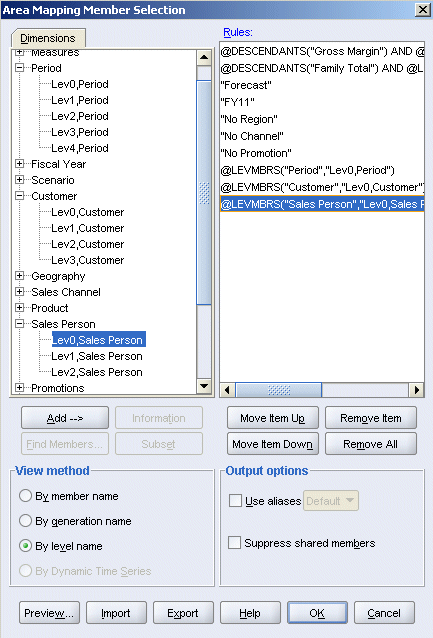
Continue comparing the outlines. In this example, the Sales Person dimensions are the same in each outline. All of the level 0 source members for Sales Person can be included in the source database definition.
|
. |
Repeat step 17 to select level 0 Sales Person members.
|
. |
Click OK.
|
. |
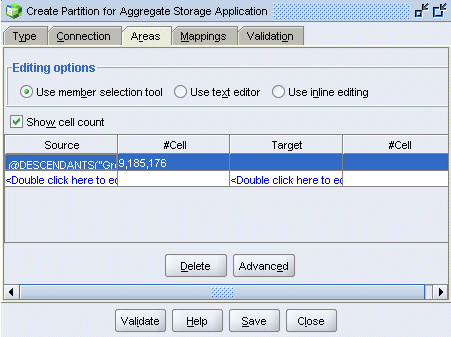
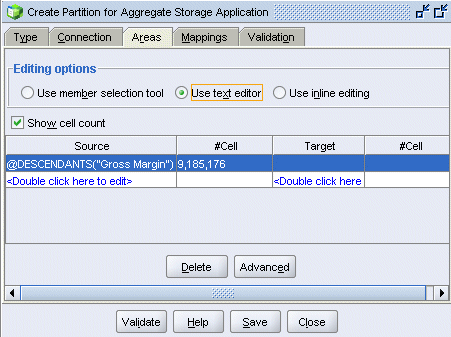
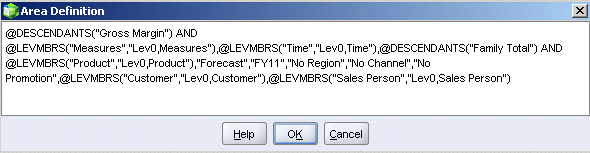
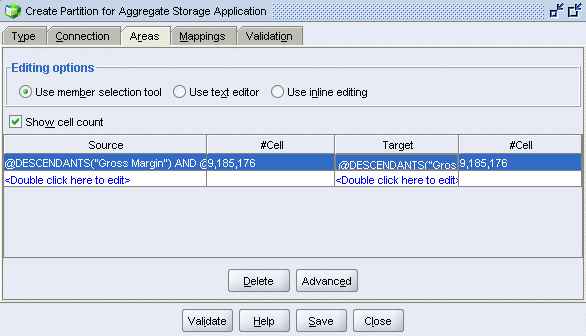
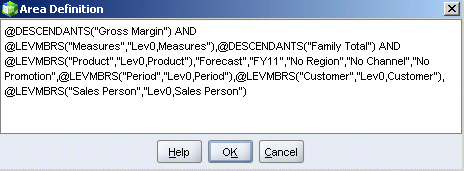
To view the entire partition area definition (in an untruncated display), select editing option Use text editor, then double-click the first row in the Areas table.
|
. |
Resize the Area Definition text box and review the source database area definition. When finished, click OK.
|
Defining the Forecast Target Partition Area
The other half of the partition definition between the reporting cube and the forecast cube is the target cube (Rptg_ASO). You define the target partition area in a manner similar to that used for defining the source.
. |
In the Create Partition for Aggregate Storage Application window, select the Areas tab, and then select Use member selection tool and Show cell count.
|
|---|---|
. |
In the Target column, double-click the first row (the same row as your source area definition).
|
. |
Using the same techniques described in the topic entitled "Defining the Forecast Source Partition Area," select the following dimension subsets:
|
. |
Using the same techniques described in the topic entitled "Defining the Forecast Source Partition Area," select the following single members:
|
. |
Using the same techniques described in the topic entitled "Defining the Forecast Source Partition Area," select all level 0 members of the following dimensions:
|
. |
Click OK.
|
. |
Using the same technique described in the topic entitled "Defining the Forecast Source Partition Area," review the area definition for the target partition area. When finished, click OK.
|
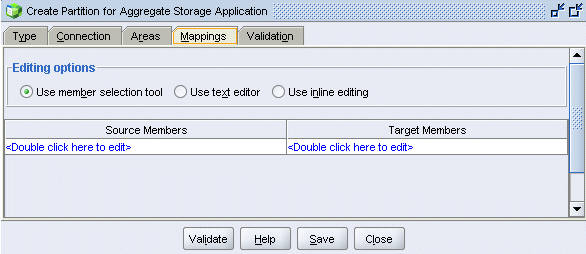
Mapping Member Names
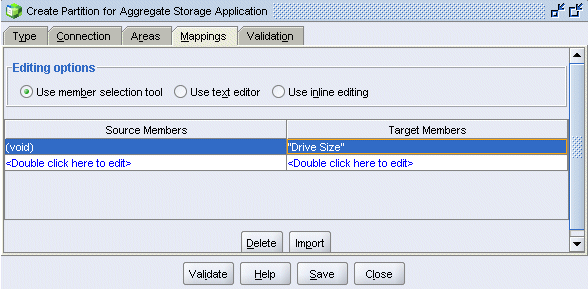
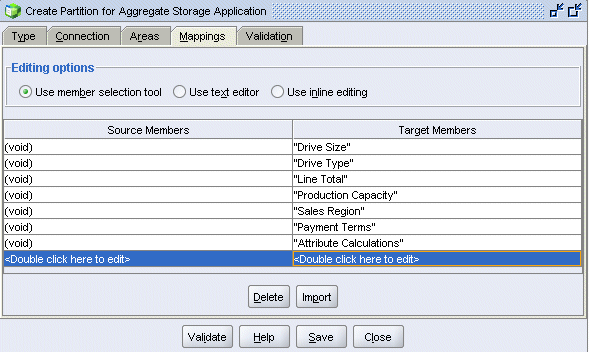
While the area definitions define the members that are common to both outlines, there may still be other differences in the outlines that must be considered. In this example, the reporting cube outline has six attribute dimensions that are not represented in the forecast cube outline. The attribute dimensions are not required in the forecast database (so there is no need to add them); but they must be considered in the partition definition. You compensate for such differences in dimensionality by mapping the attribute dimensions in the reporting (target) cube to "void" in the forecast (source) cube.
. |
Select the Mappings tab, and then select Use member selection tool.
|
|---|---|
. |
In the Target Members column, double-click <double-click here to edit>.
|
. |
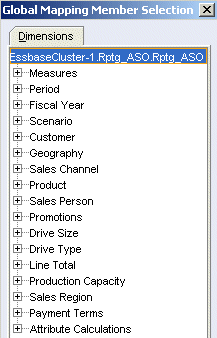
Select an attribute dimension, in this example, Drive Size.
|
. |
Click OK.
|
. |
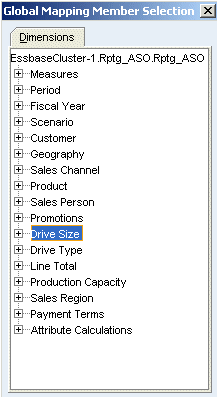
Repeat the previous three steps to map the following attribute dimensions (and the attribute calculations dimension) to void:
|
Validating and Saving the Forecast Partition
. |
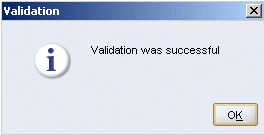
Click Validate.
|
|---|---|
. |
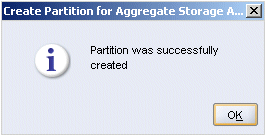
Click OK, then click Save.
|
. |
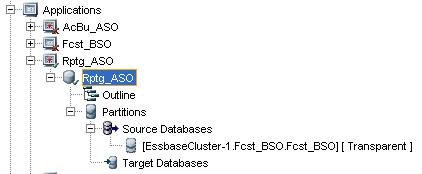
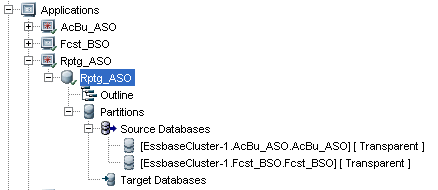
Click OK. In the Navigation panel, you can locate the partition definition in the Partitions node for reporting database Rptg_ASO. The partition definition shows forecast database Fcst_BSO as a source.
|
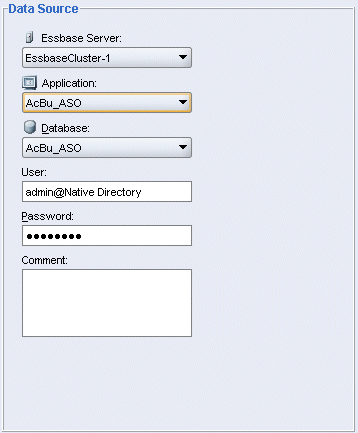
Creating a Partition for the Actual-Budget (ASO) Database
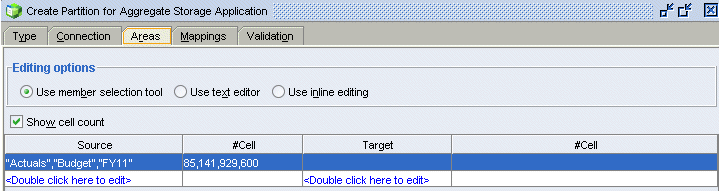
In this example, creating a partition for the actual-budget database (AcBu_ASO) is straightforward, since the reporting database outline was created as a copy of the actual-budget database outline. In the area definition, include Scenario Actuals and Budget and specify Fiscal Year FY11 (to access actual-budget data that corresponds to forecast data available from the forecast database).
. |
In the navigation panel, expand the Rptg_ASO database node, then right-click the Partitions node, and then select Create new partition.
|
|---|---|
. |
Select the Type tab, and for Partition Type, select Transparent.
|
. |
Select the Connection tab.
|
. |
In the Data Source section, select the Essbase Server, Application, and Database name for actual-budget cube AcBu_ASO, then enter the appropriate connection User ID and Password.
|
. |
In the Data Target section, repeat the previous step to provide connection information for ASO reporting cube Rptg_ASO.
|
Defining the Actual-Budget Source Partition Area
. |
Select the Areas tab, and then select Use member selection tool and Show cell count.
|
|---|---|
. |
In the Source column, double-click <double-click here to edit>.
|
. |
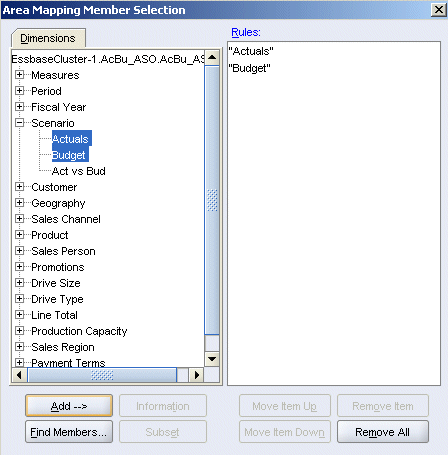
In the Area Mapping Member Selection dialog box, expand the Scenario dimension, then multiple select Actuals and Budget, and then click Add.
|
. |
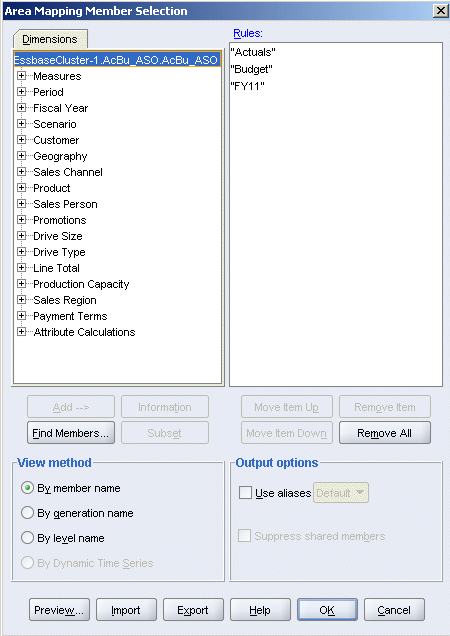
Repeat the previous step to select FY11 from the Fiscal Year dimension.
|
. |
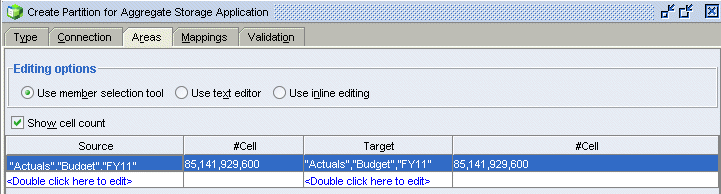
Click OK.
|
Defining the Actual-Budget Target Partition Area
In this section, you define the target partition area.
. |
In the Target column, double-click the first row (the same row as your source area definition).
|
|---|---|
. |
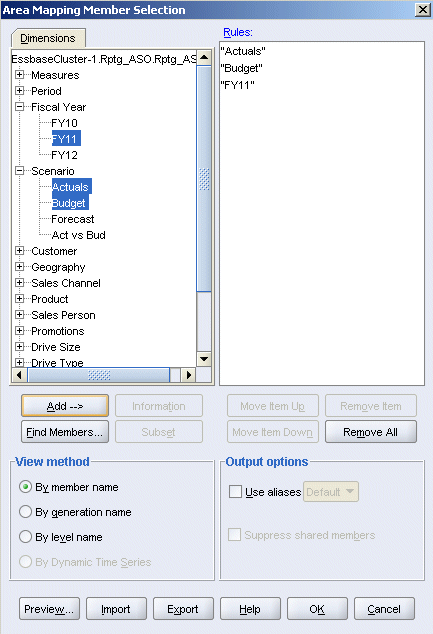
Expand Scenario and Fiscal Year, then multiple select Actuals, Budget, and FY11, and then click Add.
|
. |
Click OK.
|
Validating and Saving the Actual-Budget Partition
. |
Click Validate.
|
|---|---|
. |
Click OK, then click Save.
|
. |
Click OK. In the Navigation panel, you can locate the partition definition in the Partitions node for reporting database Rptg_ASO. The partition definition shows actual-budget database AcBu_ASO as a source.
|
Summary
In this tutorial, you learned how to create a partitioned aggregate storage reporting cube for a combined aggregate storage/block storage analytical solution.
Resources
- To learn more about aggregate storage applications and partitioning, refer to the Oracle Essbase Release 11.1.2 Database Administrator's Guide.
- For a list of available online tutorials regarding aggregate storage, search "aggregate storage" on the Oracle Learning Library Web site.
- For Oracle University training on aggregate storage applications, including partitioning ASO databases, search "deploy aggregate storage databases" on the Oracle University Web site.
![]()
|
|
About
Oracle | Oracle and Sun | |