Customizing the Gantt Chart
The Gantt Chart tab allows you to show and customize a progress line and customize the timescale.
- Show Progress Line - The progress line shows the variance between the Start/Finish dates of the current project plan and its baseline, or the progress of an activity based on its remaining duration or percent complete.
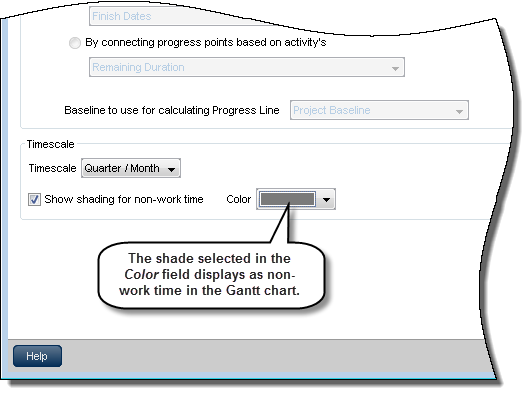
- Timescale - Choose the major/minor timescale increment to apply to the view. You can also choose to shade the nonwork time. The shading is adjusted from the Color list.