Visualizer
Visualizer is a new feature that supports graphical reporting by enabling users to create customizable Gantt charts and timescaled logic diagrams (TSLDs).
In addition to the P6 Professional’s standard graphical features, Visualizer enables a user to:
- Stack columns and use word wrapping in the Gantt chart.
- Use notebook topics or a list of steps as a bar label or as an field in the activity table.
- Apply various fonts to individual labels and fields.
- Color-code and apply different shapes for bars and endpoints.
- Draw bars on top of each other, for example, to show critical highlighting.
- Use rolling dates for filters and timescales.
- Group and sort by hierarchical fields.
- Import activity layouts from P6 Professional.
- Show lines numbers in the Grid.
- Rename column titles.
- Save Grid settings back to Options.
Visualizer is a desktop application that can be launched either from within P6 Professional or from the computer’s start menu. It has a direct connection to the P6 database and provides live access to all P6 projects.
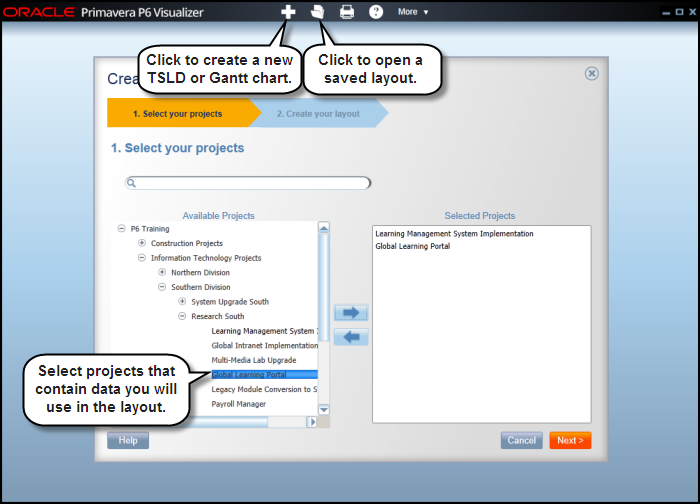
When Visualizer is launched, it displays a workspace where you can add, open, print and manage layouts. You also can import P6 Professional layouts or Visualizer layouts from other users.
Choose to create or open a TSLD or Gantt chart. The Gantt chart includes a grid and a bar chart. The grid displays activity information in a table format, similar to the Activity Table in P6 Professional. On the Chart & Grid tab in Layout Options, display the Gantt chart, the grid, or both. TSLDs enable you to display more than one activity per row, which condenses the project plan and the chains of activities that drive the project schedule.
You can run Visualizer layouts in batches for faster periodic reporting. Using a tool like Windows Scheduler, schedule the batch runs of reports in advance.
When creating layouts, Visualizer obeys settings specified in Admin Preferences in P6 Professional. If P6 Professional is connected to a P6 EPPM database, it obeys Application Settings in P6:
- Weekday on which the calendar week begins
- Number of work hours for time periods and time abbreviations
- Online Help settings
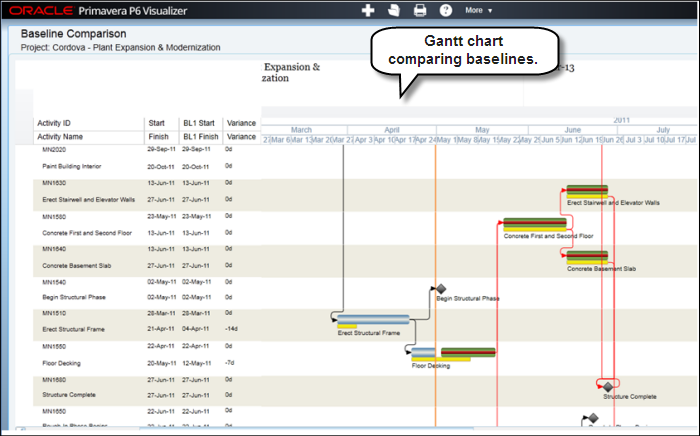
When creating a layout in Visualizer you can define options, such as filter, group, and sort criteria, to customize the Gantt chart or TSLD. The layout below shows activities color-coded by activity code values with various shapes for endpoints.

Display baseline bars to compare schedules and stack fields in the activity table to save horizontal space.
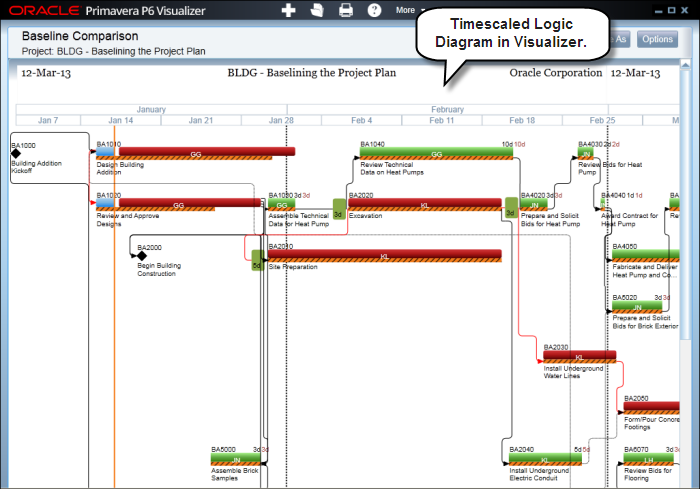
The screen below shows an example of a TSLD with multiple bars per activity and critical activities coded in red.
To access this feature:
In P6 Professional, click Visualizer on the Tools menu or open it directly from the Start menu.
Copyright © 2008, 2014, Oracle and/or its affiliates. All rights reserved.