
This document will continue to evolve as existing sections change and new information is added. All updates appear in the following table:
| Date | Product | Feature | Notes |
|---|---|---|---|
| 27 JUL 2020 | Created initial document. |
Oracle Utilities Analytics and Insights Cloud Service unlocks smart grid data and turns it into actionable insight for electric, gas, and water utilities.
This guide outlines the information you need to know about new or improved functionality in this update, and describes any tasks you might need to perform for the update. Each section includes a brief description of the feature, the steps you need to take to enable or begin using the feature, any tips or considerations that you should keep in mind, and the resources available to help you.
Column Definitions:
Features Delivered Enabled
Report = New or modified, Oracle-delivered, ready to run reports.
UI or Process-Based: Small Scale = These UI or process-based features are typically comprised of minor field, validation, or program changes. Therefore, the potential impact to users is minimal.
UI or Process-Based: Larger Scale* = These UI or process-based features have more complex designs. Therefore, the potential impact to users is higher.
Features Delivered Disabled = Action is needed BEFORE these features can be used by END USERS. These features are delivered disabled and you choose if and when to enable them. For example, a) new or expanded BI subject areas need to first be incorporated into reports, b) Integration is required to utilize new web services, or c) features must be assigned to user roles before they can be accessed.
| Ready for Use by End Users Reports plus Small Scale UI or Process-Based new features will have minimal user impact after an update. Therefore, customer acceptance testing should focus on the Larger Scale UI or Process-Based* new features. |
Action is Needed BEFORE Use by End Users Not disruptive as action is required to make these features ready to use. As you selectively choose to leverage, you set your test and roll out timing. |
|||||
|---|---|---|---|---|---|---|
| Feature |
Report |
UI or |
UI or |
|
||
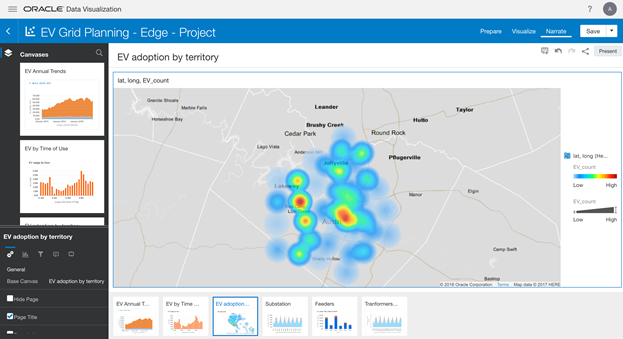
Data Visualization Enhancements
New Oracle Utilities Analytics and Insights Dashboards were enabled to allow you to analyze the significant changes in energy use patterns due to shelter-in-place and business changes caused by COVID-19. You can analyze the impact of COVID-19 in 2020 across territories by looking for patterns by Customer Type, Rate Class, and Geography. You can compare these patterns with the consumption of the previous year. You can also explore views of consumption by the day, week, and month filtered by Customer Type, Rate Class, and Group of Rates.
Steps to Enable
You don't need to do anything to enable this feature.
The Manage tab enables you to upload your own data to evaluate against the Algorithms and Advanced Filters. You can upload meter and service point data from a third-party system and run the data against algorithms, validate against meter operations, or run a custom population against an algorithm.
Steps to Enable
You don't need to do anything to enable this feature.
The Point Grid enables your Service Delivery Manager to insert additional data columns at your request. If the data is not visible on screen, you can scroll horizontally to view all the data.
Steps to Enable
You don't need to do anything to enable this feature.