
This document will continue to evolve as existing sections change and new information is added. All updates appear in the following table:
| Date | Product | Feature | Notes |
|---|---|---|---|
| 31 MAR 2022 | Created initial document. |
Oracle Utilities Opower provides a range of data-driven solutions, software products, and personalized insights to utility customers about their energy use.
This guide outlines the information you need to know about new or improved functionality in this update, and describes any tasks you might need to perform for the update. Each section includes a brief description of the feature, the steps you need to take to enable or begin using the feature, any tips or considerations that you should keep in mind, and the resources available to help you.
 HAVE AN IDEA?
We’re here and we’re listening. If you have a suggestion on how to make our cloud services even better then go ahead and tell us by submitting a service request. Wherever you see this icon after the feature name it means we delivered one of your ideas.
DISCLAIMER
The information contained in this document may include statements about Oracle’s product development plans. Many factors can materially affect Oracle’s product development plans and the nature and timing of future product releases. Accordingly, this Information is provided to you solely for information only, is not a commitment to deliver any material, code, or functionality, and should not be relied upon in making purchasing decisions. The development, release, and timing of any features or functionality described remains at the sole discretion of Oracle.
This information may not be incorporated into any contractual agreement with Oracle or its subsidiaries or affiliates. Oracle specifically disclaims any liability with respect to this information. Refer to the Legal Notices and Terms of Use for further information.
Column Definitions:
Report = New or modified, Oracle-delivered, ready to run reports.
UI or Process-Based: Small Scale = These UI or process-based features are typically comprised of minor field, validation, or program changes. Therefore, the potential impact to users is minimal.
UI or Process-Based: Larger Scale* = These UI or process-based features have more complex designs. Therefore, the potential impact to users is higher.
Features Delivered Disabled = Action is needed BEFORE these features can be used by END USERS. These features are delivered disabled and you choose if and when to enable them. For example, a) new or expanded BI subject areas need to first be incorporated into reports, b) Integration is required to utilize new web services, or c) features must be assigned to user roles before they can be accessed.
| Ready for Use by End Users Reports plus Small Scale UI or Process-Based new features will have minimal user impact after an update. Therefore, customer acceptance testing should focus on the Larger Scale UI or Process-Based* new features. |
Customer Must Take Action before Use by End Users Not disruptive as action is required to make these features ready to use. As you selectively choose to leverage, you set your test and roll out timing. |
|||||
|---|---|---|---|---|---|---|
| Feature |
Report |
UI or |
UI or |
|
||
Approximate Income Level Attributes in Opower Analytics Visualization |
||||||
Winter Gas Behavioral Demand Response
Winter Gas Behavioral Demand Response uses gas AMI data to encourage customers to reduce their natural gas use during the coldest days of the year. This feature uses pre-event communications to inform the customer of when a winter gas peak-demand event will occur, and post-event communications to tell the customer how they performed compared to their neighbors or community during the peak event. These communications can help reduce the risk of gas shortages, defer or eliminate the need for infrastructure investments, and mitigate customer complaints related to gas shutoffs. A non-AMI version of this feature is also available, when delivered in conjunction with the AMI experience.
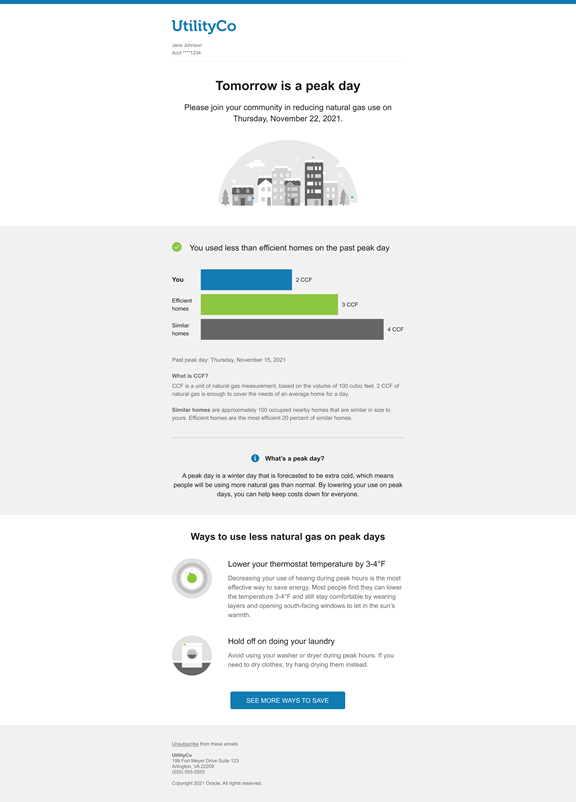
Utilities can use Winter Gas Behavioral Demand response to encourage customers to reduce reduce natural gas demand during the winter when natural gas is in the highest demand.
Steps to Enable
Contact your Service Delivery Manager to coordinate configuration of the module.
To contact your Service Delivery Manager:
- Log in to Inside Opower (https://inside.opower.com). This is your portal for questions and information related to your program.
- Go to the Community tab and contact the Service Delivery Manager using the information provided.
Key Resources
- See Oracle Utilities Opower Behavioral Demand Response Cloud Service Overview for additional information.
- See Oracle Utilities Opower Behavioral Demand Response Cloud Service Configuration Guide for additional information.
Approximate Income Level Attributes in Opower Analytics Visualization
The Approximate Income Level attributes in Oracle Analytics Visualization were updated to include the 2018 US American Community Survey data. This update ensures that visualizations created with the Energy Affordability category include the most accurate data about the income level of customers in a given area. For example, these attributes could be used to target low-income and moderate-income customers.
Visualizations created with the Energy Affordability category include the most accurate data about the income level of customers in a given area.
Steps to Enable
You don't need to do anything to enable this feature.
Annual Report for Email Home Energy Reports v3
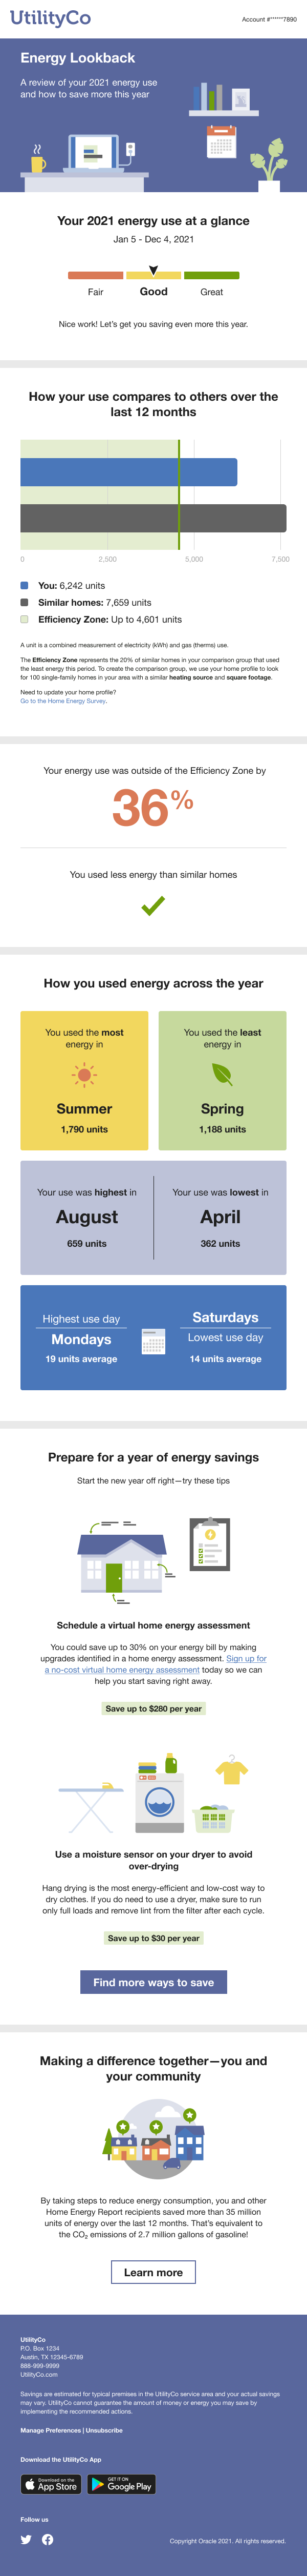
The Annual Report educates customers about their energy use in the previous calendar year, and advises them on the most impactful actions they can take to successfully save energy and money in the new year. It also includes a community message that reminds the customer that their efforts contribute to a massive collective impact. The Annual Report is delivered in January and recaps up to 12 months of data from the previous calendar year.
The report includes several unique features:
- Annual Secondary Insight: The Annual Secondary Insight module provides customers with an overview of their energy use trends throughout the year. It includes a summary of their highest and lowest time periods by season, month, and day of the week. The goal of this module is to provide the customer with easily accessible insights about their annual use.
- Annual Report Tips: The Annual Report includes two tips designed to help customers review and consider their energy use, and to share new insights about their energy use in order to inspire customers to take action to save energy. The first tip promotes a home energy assessment program or a tip from the utility's tip library. The second tip is an easy tip action that the customer can act on right away to save energy.
- Community Message: The community message reminds the customer that their energy savings have an impact beyond their own bills, and encourages them to keep saving energy in the year ahead. It also provides the customer with a link to where they can find additional resources and learn more about the impact of their energy savings.
The Annual Report provides customers with a recap of their energy use for the previous calendar year, and educates customers about how they can successfully save energy and money in the new year.
Steps to Enable
Contact your Service Delivery Manager to coordinate configuration of the module.
To contact your Service Delivery Manager:
- Log in to Inside Opower (https://inside.opower.com). This is your portal for questions and information related to your program.
- Go to the Community tab and contact the Service Delivery Manager using the information provided.
Key Resources
- Refer to the Annual Reports for Email Home Energy Reports training.
- Refer to the Energy Efficiency Cloud Service Overview for more information.
- Refer to the Email Home Energy Reports v3 Configuration Guide for more information.