
This document will continue to evolve as existing sections change and new information is added. All updates appear in the following table:
| Date | Module | Feature | Notes |
|---|---|---|---|
| 27 MAR 2023 | Created initial document. |
Oracle Utilities Opower provides a range of data-driven solutions, software products, and personalized insights to utility customers about their energy use.
This guide outlines the information you need to know about new or improved functionality in this update, and describes any tasks you might need to perform for the update. Each section includes a brief description of the feature, the steps you need to take to enable or begin using the feature, any tips or considerations that you should keep in mind, and the resources available to help you.
 HAVE AN IDEA?
We’re here and we’re listening. If you have a suggestion on how to make our cloud services even better then go ahead and tell us by submitting a service request. Wherever you see this icon after the feature name it means we delivered one of your ideas.
DISCLAIMER
The information contained in this document may include statements about Oracle’s product development plans. Many factors can materially affect Oracle’s product development plans and the nature and timing of future product releases. Accordingly, this Information is provided to you solely for information only, is not a commitment to deliver any material, code, or functionality, and should not be relied upon in making purchasing decisions. The development, release, and timing of any features or functionality described remains at the sole discretion of Oracle.
This information may not be incorporated into any contractual agreement with Oracle or its subsidiaries or affiliates. Oracle specifically disclaims any liability with respect to this information. Refer to the Legal Notices and Terms of Use for further information.
Column Definitions:
Report = New or modified, Oracle-delivered, ready to run reports.
UI or Process-Based: Small Scale = These UI or process-based features are typically comprised of minor field, validation, or program changes. Therefore, the potential impact to users is minimal.
UI or Process-Based: Larger Scale* = These UI or process-based features have more complex designs. Therefore, the potential impact to users is higher.
Features Delivered Disabled = Action is needed BEFORE these features can be used by END USERS. These features are delivered disabled and you choose if and when to enable them. For example, a) new or expanded BI subject areas need to first be incorporated into reports, b) Integration is required to utilize new web services, or c) features must be assigned to user roles before they can be accessed.
| Ready for Use by End Users Reports plus Small Scale UI or Process-Based new features will have minimal user impact after an update. Therefore, customer acceptance testing should focus on the Larger Scale UI or Process-Based* new features. |
Customer Must Take Action before Use by End Users Not disruptive as action is required to make these features ready to use. As you selectively choose to leverage, you set your test and roll out timing. |
|||||
|---|---|---|---|---|---|---|
| Feature |
Report |
UI or |
UI or |
|
||
Distributed Energy Resources Customer Engagement
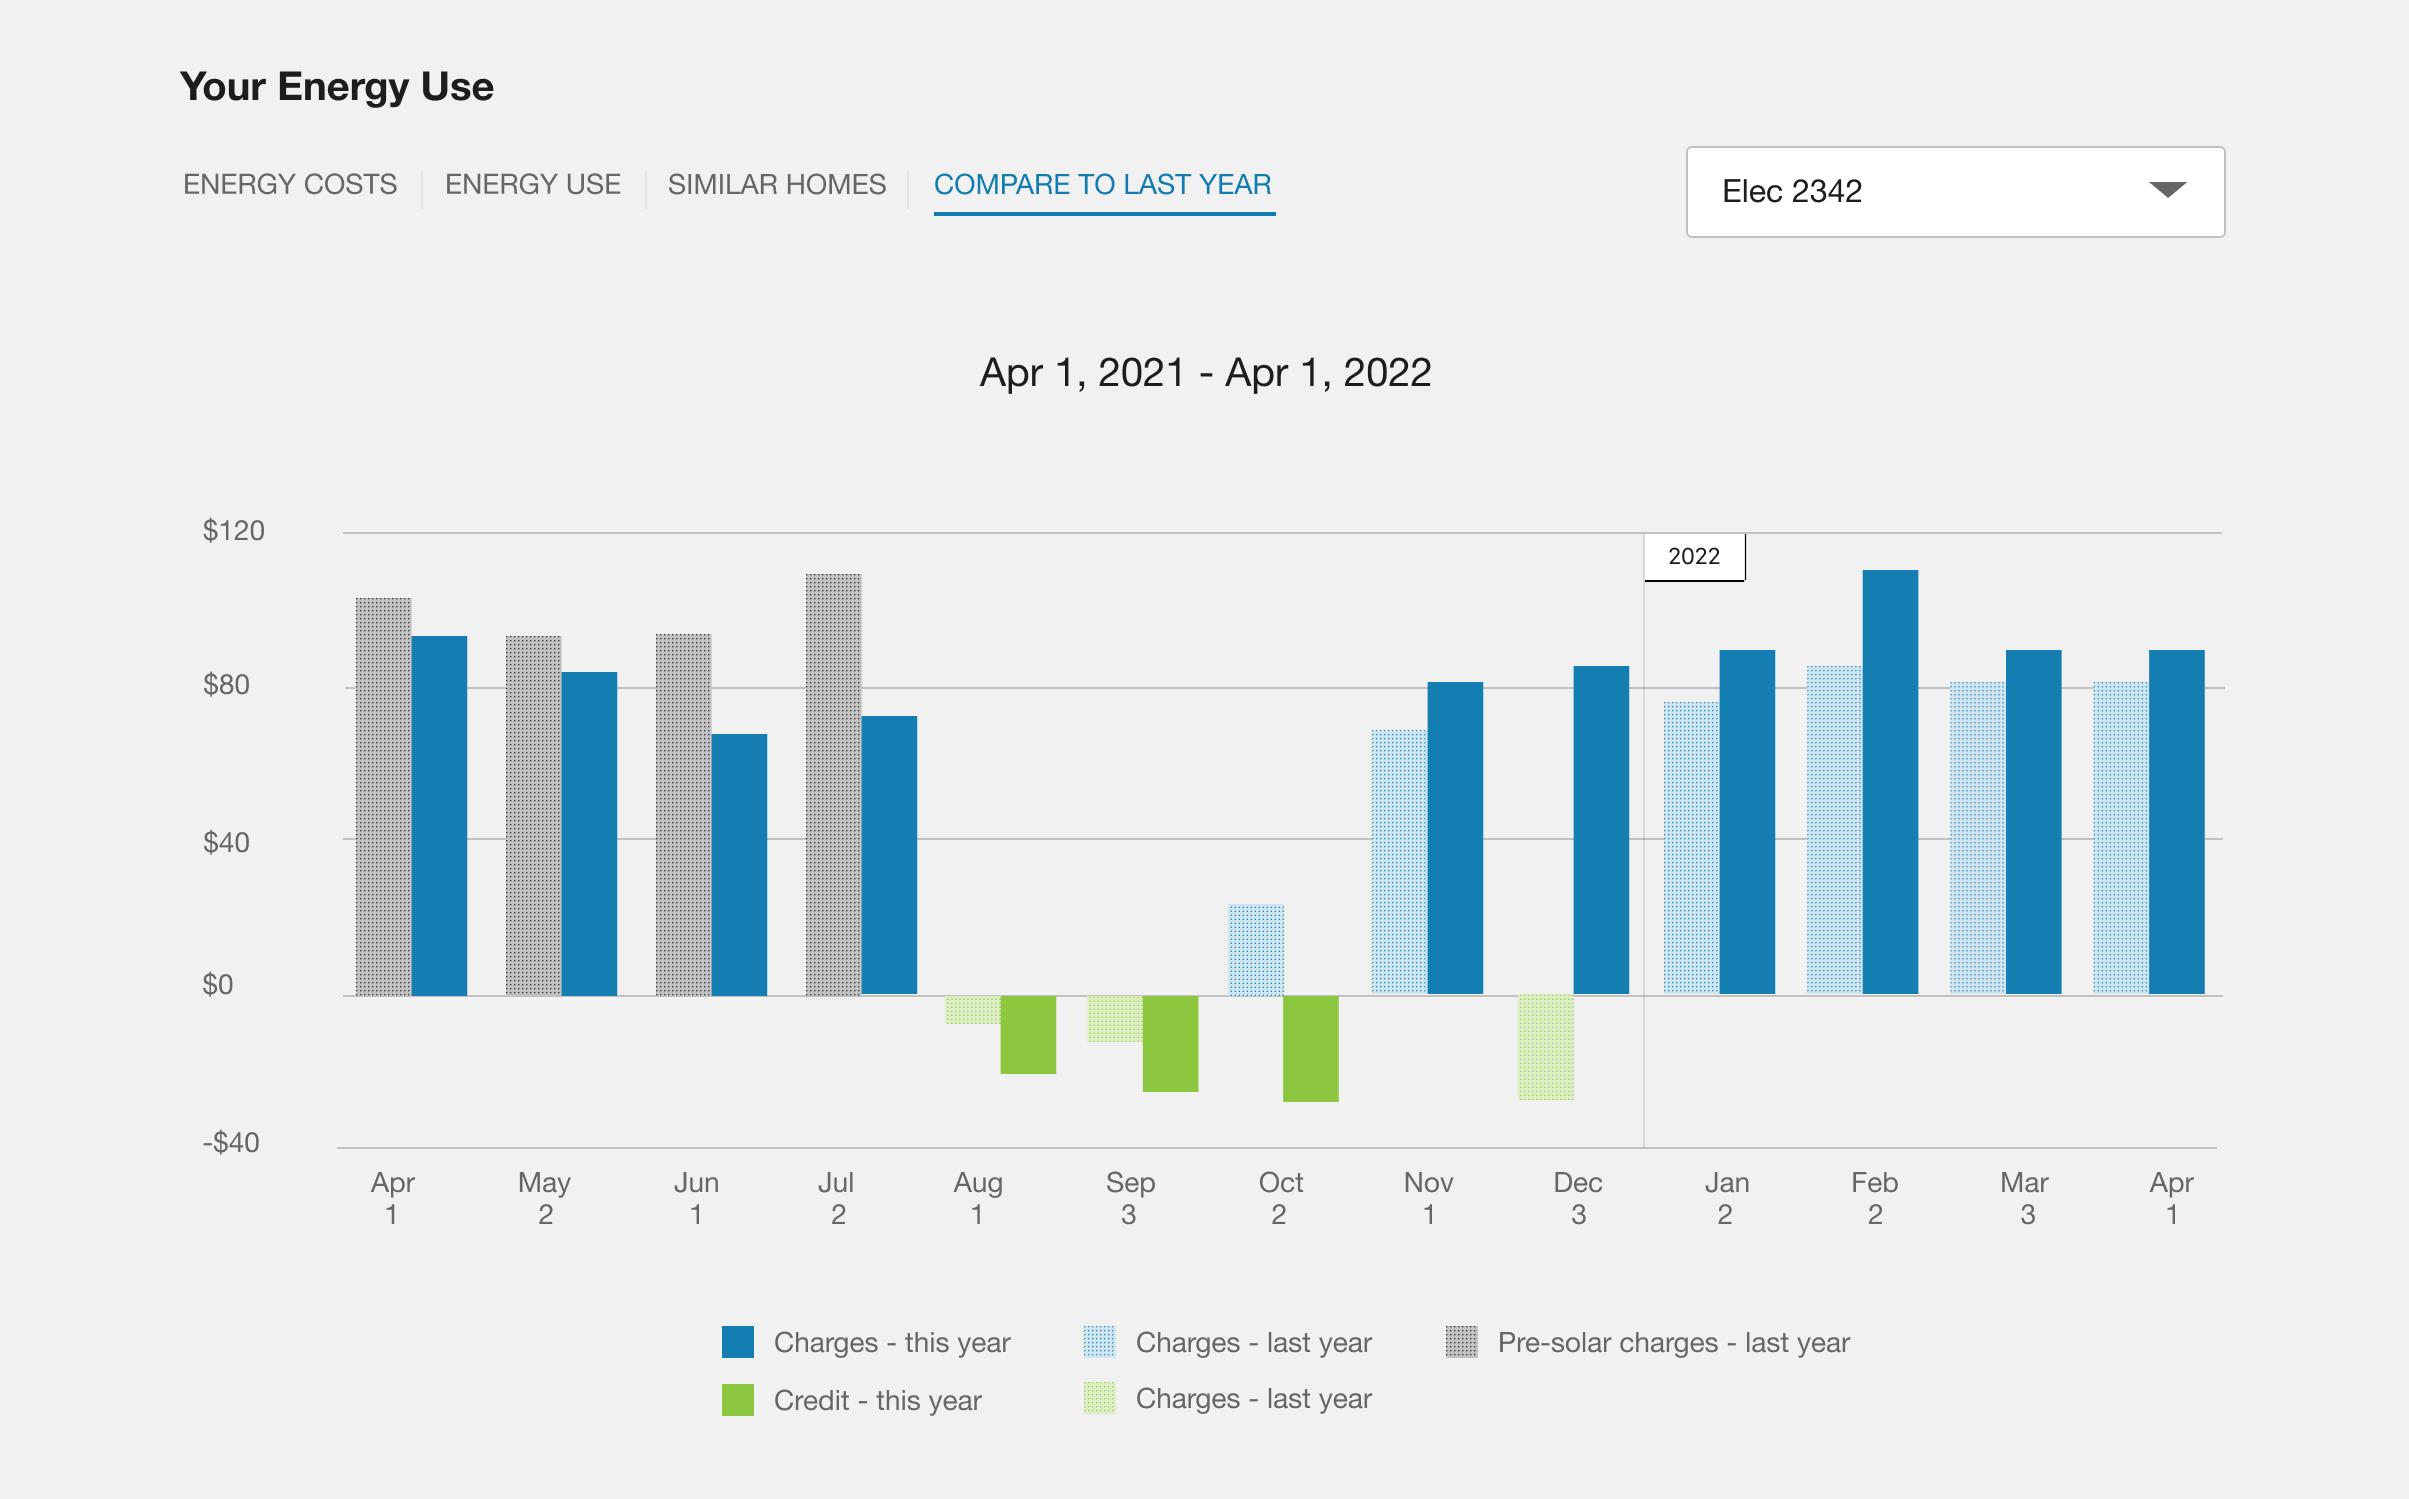
Compare to Last Year View for Solar Customers
Solar customers can use the Compare to Last Year view in the Digital Self Service – Energy Management Data Browser to view a comparison of their billing with up to two years of previous billing data. The data is displayed in a 13-month bar chart.
The amount of previous data available to customers depends on their billing plan:
- Solar customers with monthly billing can view two years of data.
- Solar customers with annual billing can view a year-over-year comparison that is aligned with their billing year.
The Compare to Last Year Cost Chart provides solar customers with several distinct design features that help them understand how their bills change over time, including:
- Account Selector: If a customer has multiple accounts, this drop-down list allows them to select the account they want to view.
- Date Range: The dates above the chart represent the current 12 to 13-month period. The number of months depends on how many months are configured to be shown in Data Browser.
- Cost Chart: This chart includes multiple bars that help customers compare their solar cost for this year to their solar costs from last year, including solar charges for this year, solar charges from last year, solar credits for this year, solar credits from last year, the customer's pre-solar bills from this year, and the customer's pre-solar bills from last year.
- Tooltips: When the customer hovers their cursor over a bar on the chart, a tooltip appears. Tooltips provide additional information about the selected bar, including the current and previous year's costs, as well as the associated net usage and bill period end date for each year.
- Legend: The legend appears below the chart and describes what each bar color represents.
This feature makes it easier for solar customers to view a comparison of their current bill with up to two years of previous billing data.
Steps to Enable
Contact your Service Delivery Manager to coordinate configuration of the module. To contact your Service Delivery Manager:
- Log in to Inside Opower (https://inside.opower.com). This is your portal for questions and information related to your program.
- Go to the Community tab and contact the Service Delivery Manager using the information provided.
Tips And Considerations
The Compare to Last Year view is only available to solar customers of utilities that have purchased Digital Self Service – Energy Management and Distributed Energy Resources Customer Engagement.
Key Resources
- Refer to the Distributed Energy Resources Customer Engagement Cloud Service Overview.
- Refer to the Distributed Energy Resources Customer Engagement Configuration Guide.
Digital Self Service - Energy Management
NOTE: Not all new Digital Self Service - Energy Management features are available with Digital Self Service - Transactions. Refer to the Digital Self Service - Transactions Overview Guide for feature availability.
Data Browser with Disaggregation
The Usage Breakdown graph in Digital Self Service - Energy Management Data Browser allows customers to explore their top energy costs by disaggregation category over time. The bar chart displays a customer's top three energy cost categories over the last 13 bill periods. The drop-down menu above the graph defaults to the customer's top three energy costs from the current month and the previous 12 months (for a total of 13 months).

The customer can view a single end-use category by selecting it from the drop-down menu.
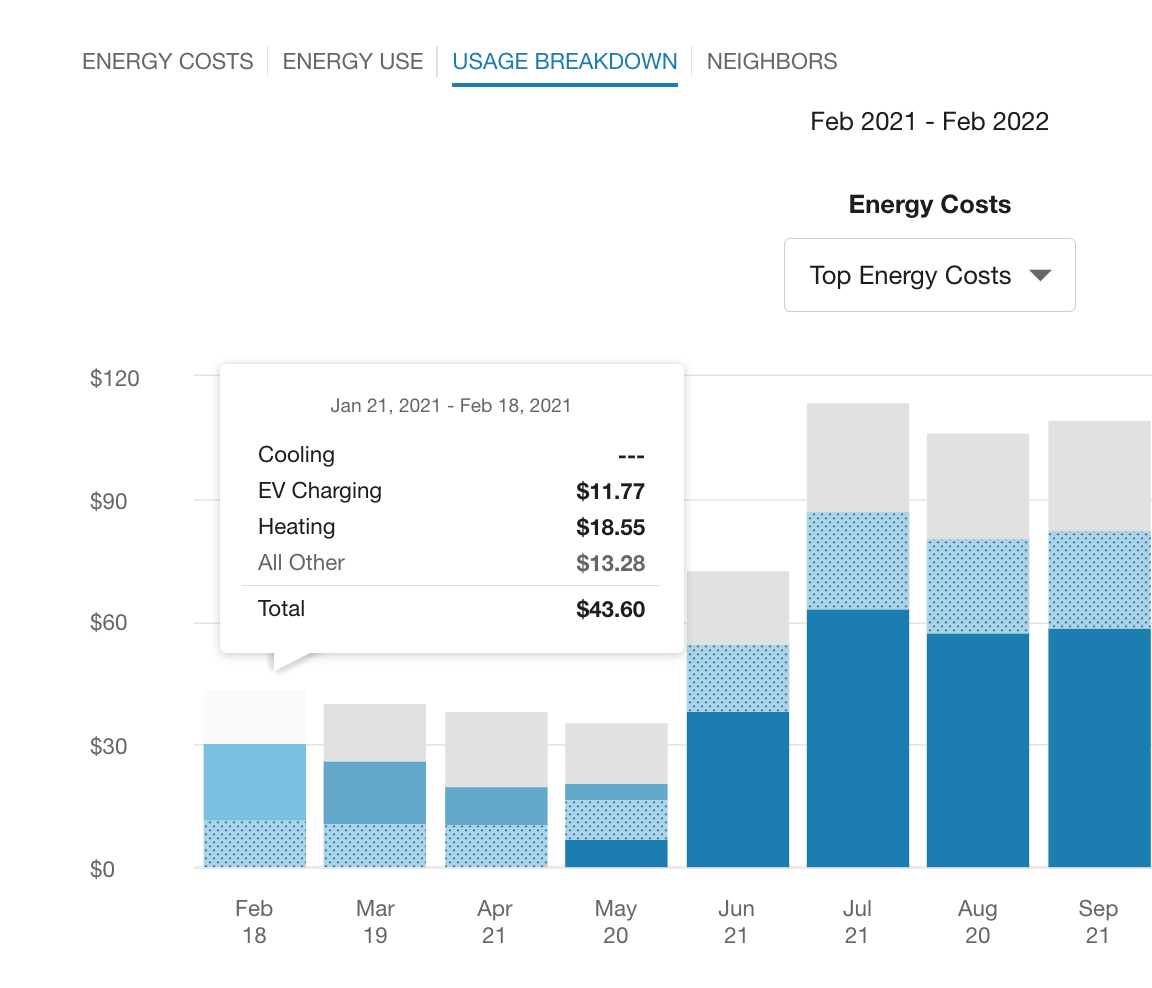
The Usage Breakdown helps customers understand how specific end uses (such as heating, cooling, and lighting) and appliances (such as dishwasher and dryer) contribute to their overall energy costs, and to identify trends that may be leading to higher than normal bills.
Steps to Enable
Contact your Service Delivery Manager to coordinate configuration of the module.
To contact your Service Delivery Manager:
- Log in to Inside Opower (https://inside.opower.com). This is your portal for questions and information related to your program.
- Go to the Community tab and contact the Service Delivery Manager using the information provided.
Key Resources