
This document will continue to evolve as existing sections change and new information is added. All updates appear in the following table:
| Date | Module | Feature | Notes |
|---|---|---|---|
| 27 NOV 2023 | Created initial document. |
Oracle Utilities Opower provides a range of data-driven solutions, software products, and personalized insights to utility customers about their energy use.
This guide outlines the information you need to know about new or improved functionality in this update, and describes any tasks you might need to perform for the update. Each section includes a brief description of the feature, the steps you need to take to enable or begin using the feature, any tips or considerations that you should keep in mind, and the resources available to help you.
 HAVE AN IDEA?
We’re here and we’re listening. If you have a suggestion on how to make our cloud services even better then go ahead and tell us. Wherever you see this icon after the feature name it means we delivered one of your ideas.
DISCLAIMER
The information contained in this document may include statements about Oracle’s product development plans. Many factors can materially affect Oracle’s product development plans and the nature and timing of future product releases. Accordingly, this Information is provided to you solely for information only, is not a commitment to deliver any material, code, or functionality, and should not be relied upon in making purchasing decisions. The development, release, and timing of any features or functionality described remains at the sole discretion of Oracle.
This information may not be incorporated into any contractual agreement with Oracle or its subsidiaries or affiliates. Oracle specifically disclaims any liability with respect to this information. Refer to the Legal Notices and Terms of Use for further information.
Column Definitions:
Report = New or modified, Oracle-delivered, ready to run reports.
UI or Process-Based: Small Scale = These UI or process-based features are typically comprised of minor field, validation, or program changes. Therefore, the potential impact to users is minimal.
UI or Process-Based: Larger Scale* = These UI or process-based features have more complex designs. Therefore, the potential impact to users is higher.
Features Delivered Disabled = Action is needed BEFORE these features can be used by END USERS. These features are delivered disabled and you choose if and when to enable them. For example, a) new or expanded BI subject areas need to first be incorporated into reports, b) Integration is required to utilize new web services, or c) features must be assigned to user roles before they can be accessed.
| Ready for Use by End Users Reports plus Small Scale UI or Process-Based new features will have minimal user impact after an update. Therefore, customer acceptance testing should focus on the Larger Scale UI or Process-Based* new features. |
Customer Must Take Action before Use by End Users Not disruptive as action is required to make these features ready to use. As you selectively choose to leverage, you set your test and roll out timing. |
|||||
|---|---|---|---|---|---|---|
| Feature |
Report |
UI or |
UI or |
|
||
Season Transition Behavior for Behavioral Load Shaping Time of Use Coach Report Modules |
||||||
Business Customer Engagement Digital Self Service - Energy Management |
||||||
The Oracle Utilities Opower Affordability Cloud Services provide low- and medium-income utility customers with information about financial assistance programs available from their utility. The services help customers identify which programs they qualify for, and enroll in a program that is best suited to their financial situation. Available cloud services include:
Affordability Identification and Analytics Cloud Service: Affordability Identification and Analytics is a process for identifying limited income customers for utilities. The process involves a combination of data and metrics to categorize customers according to their relative financial vulnerability. This information can then be used to segment customer experiences and send targeted communications to limited-income customers about available financial assistance programs.
Affordability Proactive Alerts Cloud Service: Affordability Proactive Alerts are email communications that educate customers about financial or energy assistance programs available from their utility. The alerts can be sent to customers who likely have trouble paying their utility bills, or to customers who are already behind on their bills. The alerts include details about which programs customers are eligible for, and behavioral messaging that encourages them to enroll. The alerts can also direct customers to a central web resource, Savings Hub. The goals of the alerts are to make customers aware of the financial assistance opportunities available, and enable them to enroll as efficiently as possible.
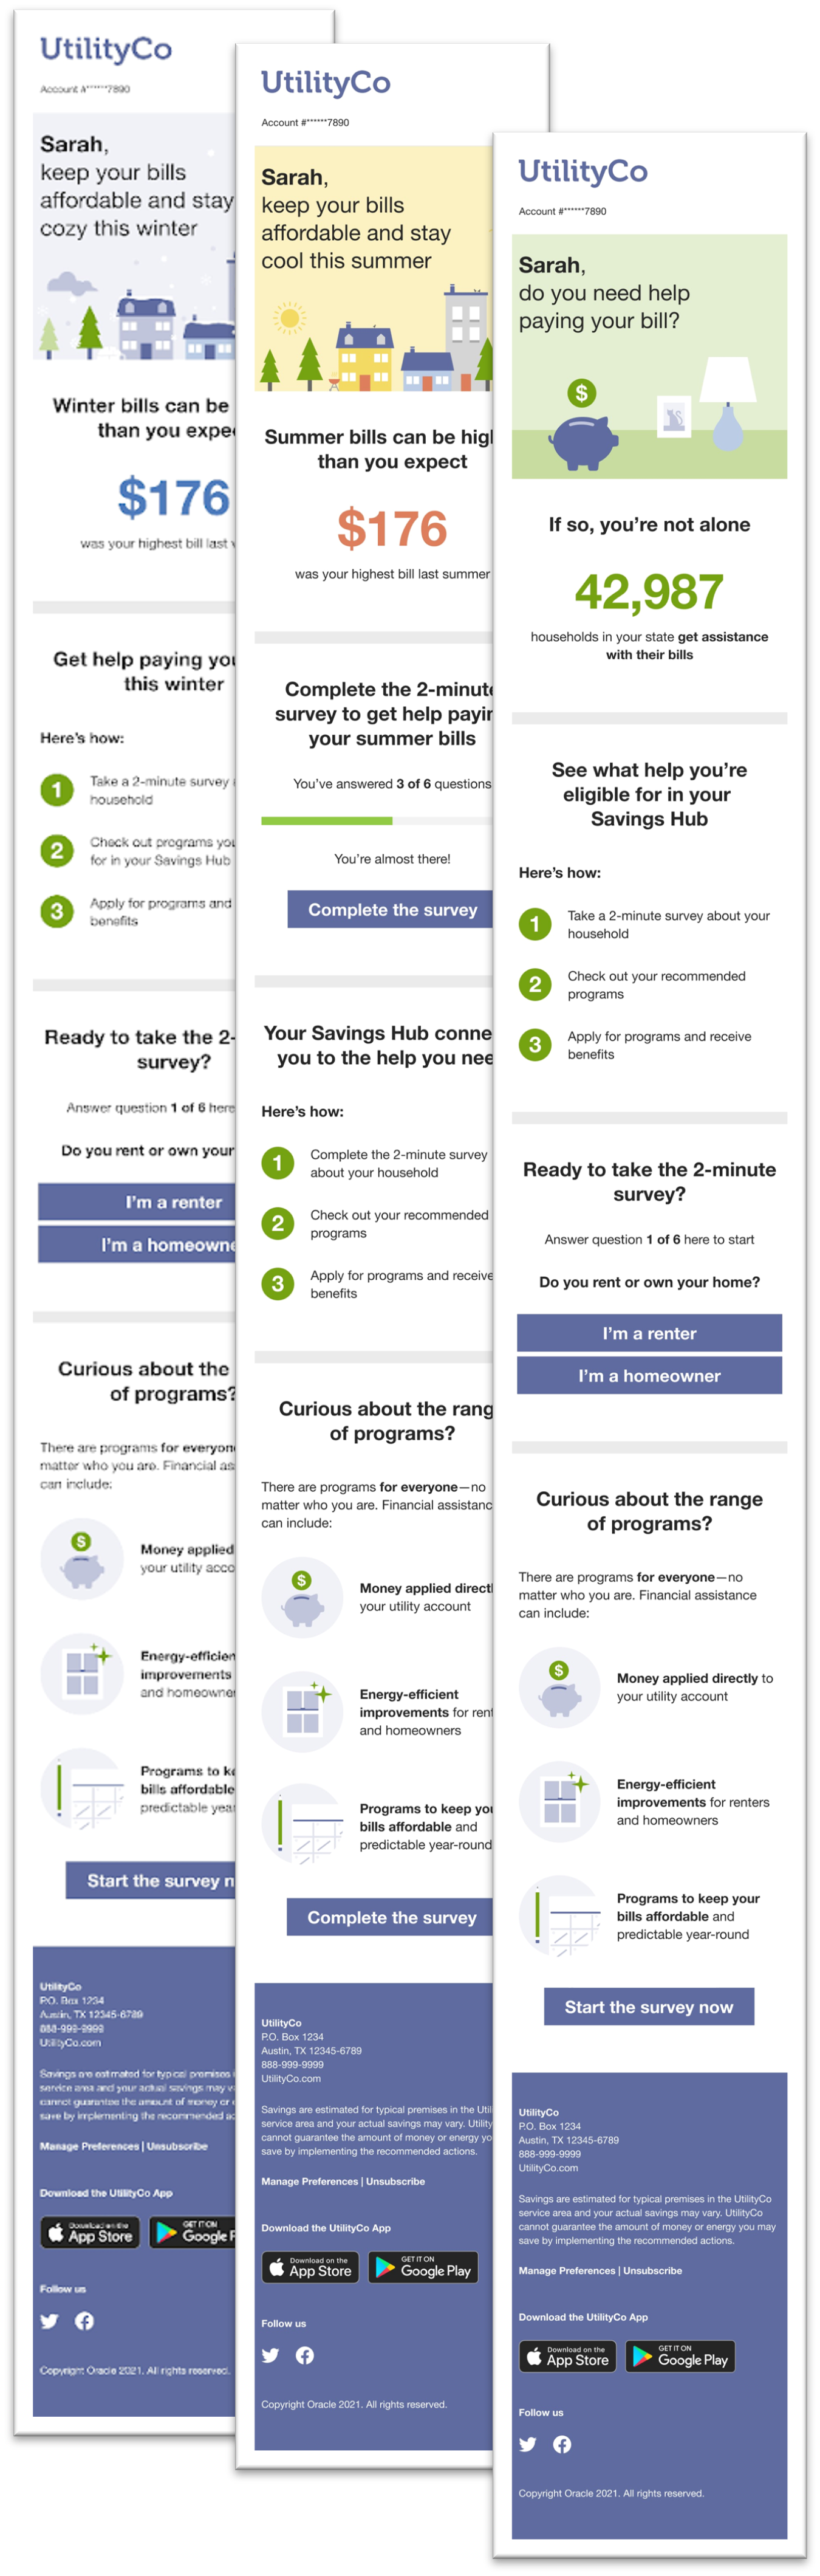
Features of this solution include:
- Introduction: A welcome module designed to engage low to moderate-income customers who may need help paying their utility bill.
- Insight module: Provides customers with the number of people receiving assistance with their bills in their state or region to normalize receiving help.
- Numbered Steps: Helps set the customer's expectations for the process of receiving assistance with their bill. The module consists of a header calling for the customer to see their eligible programs, and three steps outlining the process.
- Programs Overview: Provides customers with additional information about the type of assistance available through the Savings Hub. It is a call-to-action for customers who have not started the survey, and dispels common misconceptions about available help by emphasizing the wide range of programs available to people in a variety of circumstances.
- Savings Hub Call-to-Action: Encourages customers to act toward getting assistance for their bills. The module varies based on whether or not the customer has completed the Savings Hub Survey.
Affordability Savings Hub Cloud Service: Savings Hub helps customers understand and apply for financial assistance programs at their utility. Savings Hub is a visual, interactive tool that prompts customers to answer simple questions about their home and finances. A customer's responses to the questions are then used to create a personalized list of available energy efficiency and financial assistance programs that can help them reduce and pay their utility bills. Savings Hub features can be embedded as widgets on a utility's website or offered as a stand-alone website that is linked to a utility's website.

Features of this solution include:
- Pre-Survey: Welcomes customers to the Savings Hub experience, tells them how the program benefits them, and what they must do to get their personalized recommendations.
- Survey: Gathers input from the customer to identify the most relevant programs for the customer.
- Program Results: Identifies assistance programs the customer is eligible for based on answers to their survey and available program participation data. It includes program cards that provide high-level summaries for each program.
- Program Details: Provides customers with specific program details, such as eligibility requirements, how to apply, and required documentation.
The Oracle Utilities Opower Affordability Cloud Services help customers identify which programs they qualify for, and enroll in a program that is best suited to their financial situation
Steps to Enable
Contact your Oracle sales representative if you are interested in purchasing this product. After the product is purchased, you will work with your Delivery Team to set up and configure the product.
Key Resources
- Refer to the Affordability Identification and Analytics Product Overview.
- Refer to the Affordability Proactive Alerts Product Overview
- Refer to the Affordability Savings Hub Product Overview.
- Refer to the Affordability Savings Hub Configuration Guide.
Season Transition Behavior for Behavioral Load Shaping Time of Use Coach Report Modules
Behavioral Load Shaping Time of Use Coach modules containing customer data were updated to consider whether the peak hours changed during the season transition period. This update allows the reports to more closely reflect the customer's rate plan, and present report data in a way that eliminates possible points of confusion around seasonal transition. The impacted modules vary by report type, and include the following:
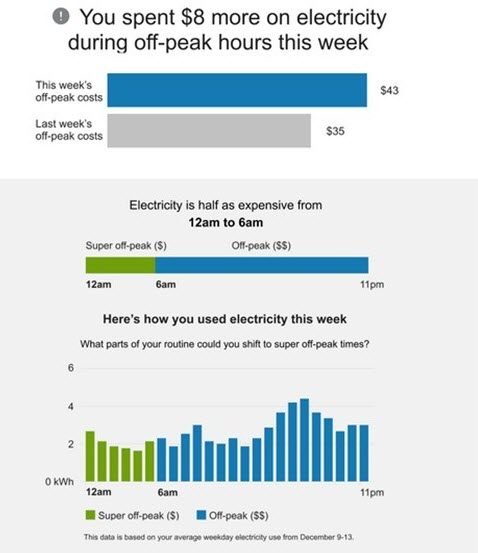
- Time of Use Coach Weekly Emails
- Time of Use Coach Weekly Comparison module
- Time of Use Coach Coach Hourly Usage module
- Time of Use Coach Weekly Peak Period Disaggregation module
- Time of Use Coach Post-Bill Report Emails:
- Time of Use Coach Weekly Emails Coach Post-Bill Bill Period Comparison module
- Time of Use Coach Weekly Email module
- Time of Use Coach Weekly Email
- Time of Use Coach Weekly Emails Post-Bill Peak Period Disaggregation module.
- Time of Use Coach Peak Usage Summary Emails:
- Time of Use Coach Peak Usage Summary module
- Time of Use Coach Hourly Usage module.
The behavior of the modules varies depending on whether or not a peak change occurs during the season transition:
- If peak hours change during the season transition, and the look-back period for a given module overlaps the season transition date, then the modules are not included in the report.
- If peak hours do not change during the season transition, data-containing modules with a look-back period that overlaps the season transition will revert to a usage-only fallback state. Costs are not calculated or shown.
Modules more accurately reflect the customer's rate plan, and present report data in a way that eliminates possible points of confusion around seasonal transition.
Steps to Enable
You don't need to do anything to enable this feature.
Key Resources
- Refer to the Behavioral Load Shaping Cloud Service Overview.
- Refer to the Behavioral Load Shaping Cloud Service Configuration Guide.
Support for Rate Plans with No On-Peak Period in a Season
Behavioral Load Shaping Time of Use Coach reports (Introduction Emails, Weekly Coach Emails, and Peak Usage Summary Emails) support rate plans that only have off-peak and partial-peak hours. In rate situations where peak hours are not present, the modules show partial-peak usage instead of peak usage.
This update allows Oracle Utilities Opower to serve customers on a broader spectrum of rate plans.
Steps to Enable
Contact your Service Delivery Manager to coordinate configuration of the module. To contact your Service Delivery Manager:
- Log in to Inside Opower (https://inside.opower.com). This is your portal for questions and information related to your program.
- Go to the Community tab and contact the Service Delivery Manager using the information provided.
Business Customer Engagement Digital Self Service - Energy Management
The Business Customer Engagement Digital Self Service - Energy Management cloud service is a web-based experience that allows business customers to analyze their energy usage patterns and find ways to save energy and money on their bills.
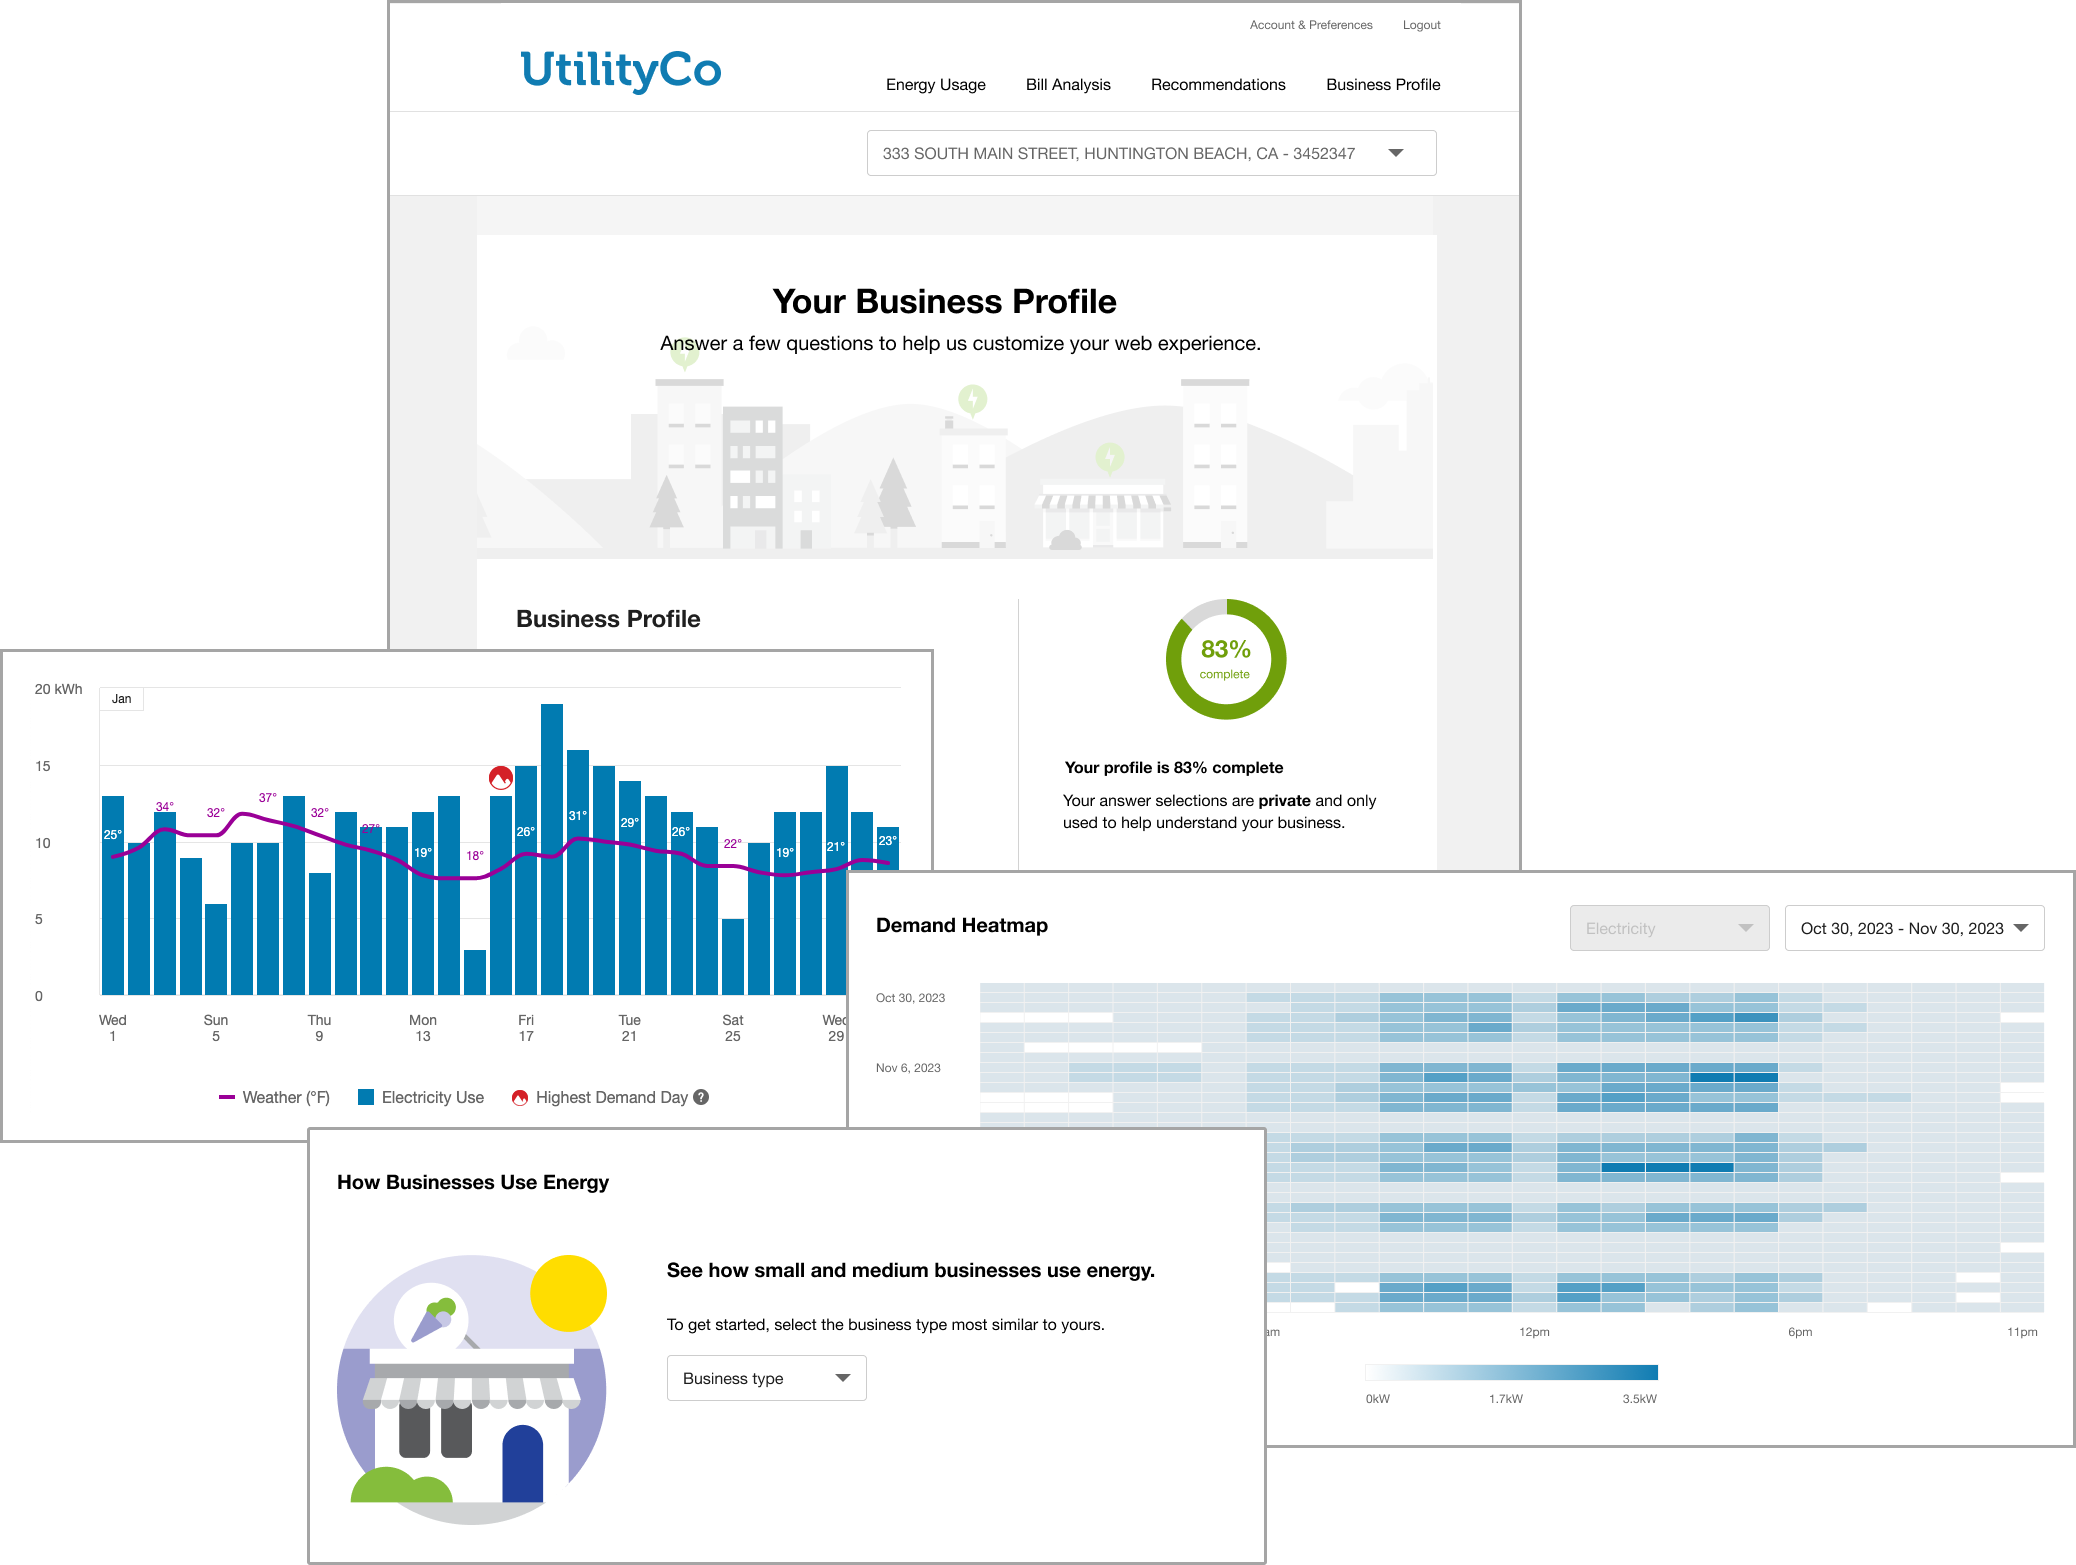
Features in this solution include:
- A data browser graph that visualizes energy trends and patterns that matter most to business customers, such as energy demand and power factor data.
- An estimated breakdown of how different types of businesses (such as restaurants, retail locations, or warehouses) use energy in specific end-use categories (such as heating, cooling, and lighting).
- A business profile that allows customers to capture useful information about their business---information which is then used to support insights in other features.
- A demand heatmap that allows business customers to see when they draw the most energy from the grid, identify irregularities, and consider future energy-saving strategies.
- Other valuable energy efficiency recommendations and insights through features like a bill comparison, bill forecast, and tips.
This solution has been designed to meet the unique energy information needs of business customers, and to offer tips and insights that help them lower their usage and better manage their energy costs.
Steps to Enable
Contact your Oracle sales representative if you are interested in purchasing this product. After the product is purchased, you will work with your Delivery Team to set up and configure the product.
Key Resources
- Refer to the Business Customer Engagement Digital Self Service - Energy Management Overview.
- Refer to the Business Customer Engagement Digital Self Service - Energy Management Configuration Guide
- Refer to Supporting Business Customer Engagement.
- Refer to the Embeddable Widgets Integration Guide.
Personal Tracker Module for Home Energy Reports v3
The Personal Tracker module provides customers with up to one year of comparison between their current year and previous year usage. It offers a range of data scenarios, displaying usage information across as few as three bills or as many as two full years of bills. The goal of the module is to provide customers with important insights into their energy use to help them make informed decisions about their energy consumption and improve their overall efficiency. The module accommodates monthly, bimonthly, and quarterly billing periods, and supports electric-only, gas, and dual fuel types.
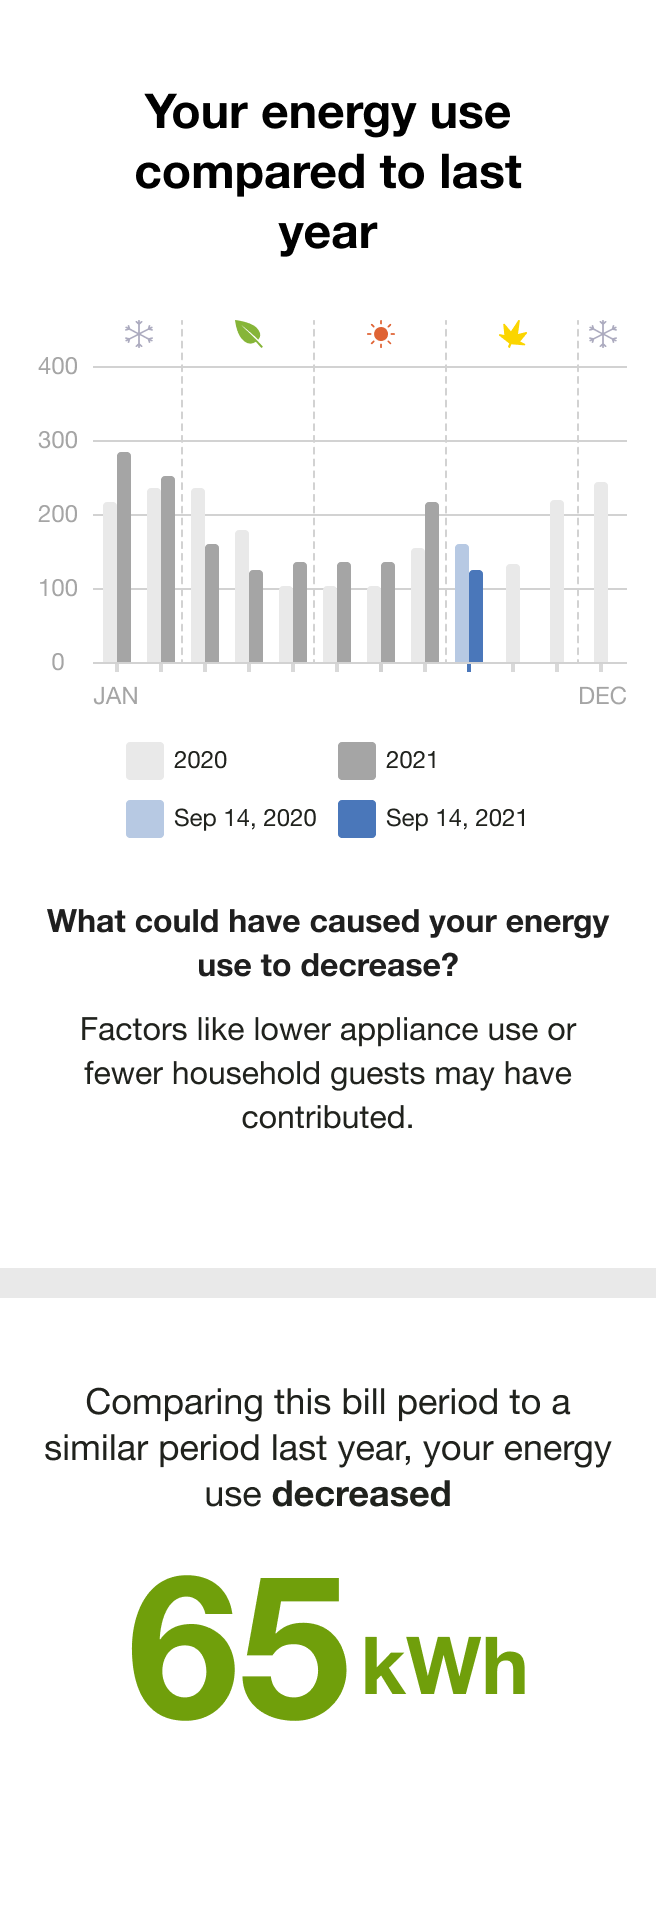
The module includes:
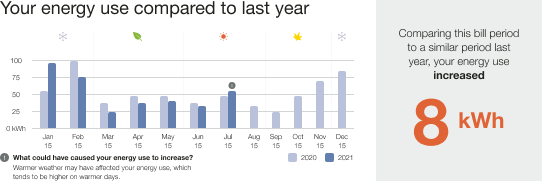
- Bar chart: The bar chart displays the customer's bills over time and provides a comparison to previous energy use if enough data is available. The chart can accommodate different reporting periods. By default, it will compare the customer's energy usage month-over-month going as far back as the beginning of the previous year. It also supports customers that have bimonthly or quarterly bill periods.
- Primary Insight: The primary insight informs the customer if their energy use has increased or decreased since the previous bill period based on the fuel type unit of measure.
- Secondary Insight: The secondary insight provides explanations for why their energy use may have increased or decreased compared to the previous billing period, particularly in relation to changes in temperature.
Utilities can use this module to create opportunities to engage their report recipients throughout the year. For example, gas utilities that pause their Email Home Energy Report delivery in the summer months can use the Personal Tracker module to offer month-over-month and year-over-year usage trends without a Neighbor Comparison module.
Steps to Enable
Contact your Service Delivery Manager to coordinate configuration of the module.
To contact your Service Delivery Manager:
- Log in to Inside Opower (https://inside.opower.com). This is your portal for questions and information related to your program.
- Go to the Community tab and contact the Service Delivery Manager using the information provided.
Key Resources
- Refer to the Energy Efficiency Cloud Service Overview.
- Refer to the Home Energy Reports v3 Configuration Guide.
Personal Tracker Module for Home Energy Reports v3
The Personal Tracker module provides customers with up to one year of comparison between their current year and previous year usage. It offers a range of data scenarios, displaying usage information across as few as three bills or as many as two full years of bills. The goal of the module is to provide customers with important insights into their energy use to help them make informed decisions about their energy consumption and improve their overall efficiency. The module accommodates monthly, bimonthly, and quarterly billing periods, and supports electric-only, gas, and dual fuel types.
The module includes:
- Bar chart: The bar chart displays the customer's bills over time and provides a comparison to previous energy use if enough data is available. The chart can accommodate different reporting periods. By default, it will compare the customer's energy usage month-over-month going as far back as the beginning of the previous year. It also supports customers that have bimonthly or quarterly bill periods.
- Primary Insight: The primary insight informs the customer if their energy use has increased or decreased since the previous bill period based on the fuel type unit of measure.
- Secondary Insight: The secondary insight provides explanations for why their energy use may have increased or decreased compared to the previous billing period, particularly in relation to changes in temperature.
Utilities can use this module to create opportunities to engage their report recipients throughout the year. For example, gas utilities that pause their Email Home Energy Report delivery in the summer months can use the Personal Tracker module to offer month-over-month and year-over-year usage trends without a Neighbor Comparison module.
Steps to Enable
Contact your Service Delivery Manager to coordinate configuration of the module.
To contact your Service Delivery Manager:
- Log in to Inside Opower (https://inside.opower.com). This is your portal for questions and information related to your program.
- Go to the Community tab and contact the Service Delivery Manager using the information provided.
Key Resources
- Refer to the Energy Efficiency Cloud Service Overview.
- Refer to the Home Energy Reports v3 Configuration Guide.
Time of Use 101 Welcome Module for Complex Rates
The welcome version of the Time of Use 101 module was updated to support complex rate designs. This change allows the welcome version of the Time of Use 101 module to highlight when electricity costs the most based on the recipient's specific Time of Use rate plan, and ensures that customers receive full rate details in the Time of Use Welcome Report and Time of Use Progress Report experiences. With this information, customers can understand their specific rate details and make informed decisions about their daily energy use behaviors.

This update helps customers understand their specific rate details and make informed decisions about their daily energy use behaviors.
Steps to Enable
Contact your Service Delivery Manager to coordinate configuration of the module. To contact your Service Delivery Manager:
- Log in to Inside Opower (https://inside.opower.com). This is your portal for questions and information related to your program.
- Go to the Community tab and contact the Service Delivery Manager using the information provided.
Key Resources
- Refer to the Energy Efficiency Cloud Service Overview.