Using Oracle Data Miner for Oracle Database 11g Release 2
Purpose
This tutorial covers the use of Oracle Data Miner to perform data mining against Oracle Database 11g Release2. In this lesson, you examine and solve a data mining business problem by using the Oracle Data Miner graphical user interface (GUI). The Oracle Data Miner GUI is included as an extension of Oracle SQL Developer, version 3.0.
Oracle SQL Developer is a free graphical tool for database development. With SQL Developer, you can browse database objects, run SQL statements and SQL scripts, and edit and debug PL/SQL statements. Starting with SQL Developer, version 3.0, you can also access the Oracle Data Miner GUI, which provides a tightly integrated interface to Oracle Data Mining features.
DISCLAIMER: This tutorial has been developed with pre-production software, and therefore is not officially supported. Tutorial contents will change when the software is officially released.
Time to Complete
Approximately 30 mins.
Overview
Data mining is the process of extracting useful information from masses of data by extracting patterns and trends from the data. Data mining can be used to solve many kinds of business problems, including:
- Predict individual behavior, for example, the customers likely to respond to a promotional offer or the customers likely to buy a specific product (Classification)
- Find profiles of targeted people or items (Classification using Decision Trees)
- Find natural segments or clusters (Clustering)
- Identify factors more associated with a target attribute (Attribute Importance)
- Find co-occurring events or purchases (Associations, sometimes known as Market Basket Analysis)
- Find fraudulent or rare events (Anomaly Detection)
The phases of solving a business problem using Oracle Data Mining are as follows:
- Problem Definition in Terms of Data Mining and Business Goals
- Data Acquisition and Preparation
- Building and Evaluation of Models
- Deployment
Problem Definition and Business Goals
When performing data mining, the business problem must be well-defined and stated in terms of data mining functionality. For example, retail businesses, telephone companies, financial institutions, and other types of enterprises are interested in customer “churn” – that is, the act of a previously loyal customer in switching to a rival vendor.
The statement “I want to use data mining to solve my churn problem” is much too vague. From a business point of view, the reality is that it is much more difficult and costly to try to win a defected customer back than to prevent a disaffected customer from leaving; furthermore, you may not be interested in retaining a low-value customer. Thus, from a data mining point of view, the problem is to predict which customers are likely to churn with high probability, and also to predict which of those are potentially high-value customers.
Data Acquisition and Preparation
A general rule of thumb in data mining is to gather as much information as possible about each individual, then let the data mining operations indicate any filtering of the data that might be beneficial. In particular, you should not eliminate some attribute because you think that it might not be important – let ODM’s algorithms make that decision. Moreover, since the goal is to build a profile of behavior that can be applied to any individual, you should eliminate specific identifiers such as name, street address, telephone number, etc. (however, attributes that indicate a general location without identifying a specific individual, such as Postal Code, may be helpful.)
It is generally agreed that the data gathering and preparation phase consumes more than 50% of the time and effort of a data mining project.
Building and Evaluation of Models
The Workflow creation process of Oracle Data Miner automates many of the difficult tasks during the building and testing of models. It’s difficult to know in advance which algorithms will best solve the business problem, so normally several models are created and tested.
No model is perfect, and the search for the best predictive model is not necessarily a question of determining the model with the highest accuracy, but rather a question of determining the types of errors that are tolerable in view of the business goals.
Deployment
Oracle Data Mining produces actionable results, but the results are not useful unless they can be placed into the correct hands quickly. The Oracle Data Miner user interface provides several options for publishing the results.
Scenario
This lesson focuses on a business problem that can be solved by applying Classification models. In our scenario, ABC Company wants to identify customers who are most likely to purchase insurance.
Note: For the purposes of this tutorial, the "Data and Acquisition" phase as already been completed, and the sample data set contains all of required data fields. Therefore, this lesson focuses primariliy on the "Building and Evaluation of Models" phase.
Prerequisites
Before starting this tutorial, you should:
. |
Have access to or have Installed Oracle Database 11g Enterprise Edition, Release 11.2.x, with Data Mining Option.
|
|---|---|
. |
Have access to or have installed Oracle SQL Developer, version 3.0, or later. Note: The Oracle Data Miner interface is included within SQL Developer.
|
. |
Have access to or have installed the sample schema Note: The sample schema has been installed for you. |
Create a Database Connection Using the Data Miner Interface
Before you build a Data Miner workflow, it is helpful to identify the required Data Miner interface components within SQL Developer. You can then structure your working environment to provide simplified access to the necesary Data Miner features.
Identifying SQL Developer Interface Components
When you first open SQL Developer, several interface elements are displayed by default, including the following tabs as shown below:
- SQL Developer Connections and Reports
- SQL Developer Thumbnail
- Data Miner (shown below with a red border)
- Workflow Jobs (an additional Data Miner interface element)
- Messages - log
- Component Palette
- Property Inspector
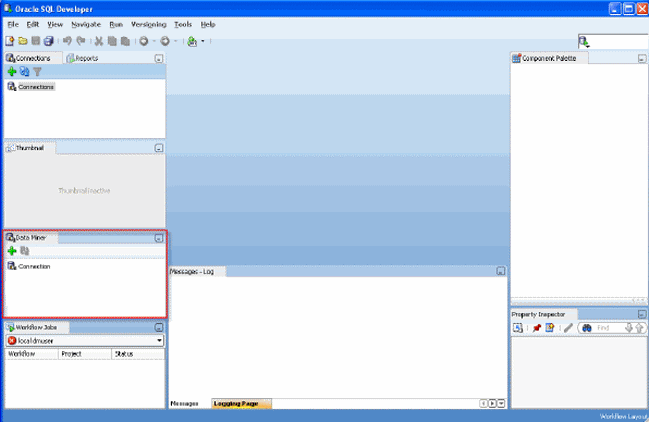
Notes:
- The layout and contents of your SQL Developer window may be different than the example shown above. If so, simply follow the instructions below to prepare your environment for Data Miner developement.
- The Data Miner, Workflow Jobs, Component Palette, and Property Inspector tabs may not always be open. You can open them from from the main menu by using View > Data Miner.
In order to simplify the SQL Developer interface for Data Miner development, dismiss the following display elements by clicking on the respective Close [x] icons for each tab:
- SQL Developer Reports tab
- SQL Developer Connections tab
- Thumbnail tab
1. 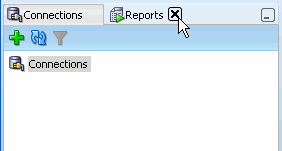
2. 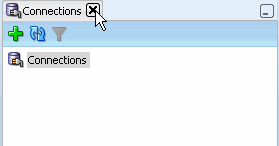
3. 
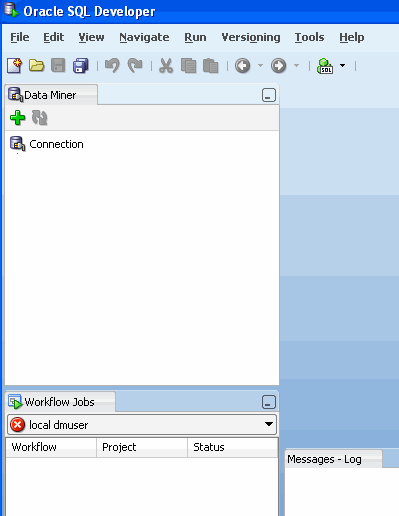
Now, only the Data Miner and Workflow Jobs tabs appear in the left-hand portion of the SQL Developer interface, like this:
Create a Data Miner Database Connection and Project
Before you begin working on a Data Miner Workflow, you must create a database connection to the schema where the data you want to mine resides. Then, you create a Project.
Note: A Project serves as a container for one or more Workflows.
To create a connection and a project, select the Data Miner tab, and then perform the following steps:
. |
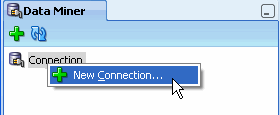
Create a connection to the data mining schema. First, in the Data Miner Navigator, right-click the Connection node select New Connection, as shown below.
In the New / Select Database Connection window, enter the connection information required to connect to your data mining schema. In this example, you connect to a schema named "dmuser", using the following options:
Second, click Test Connection to verify the database connection. Note: "Status: Success" should appear in the bottom left corner of the window. Finally, click Connect.
|
|---|---|
. |
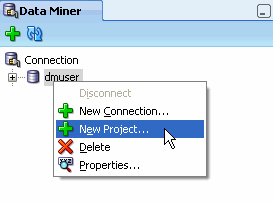
To create a Project, right-click the connection that you just created and select New Project, as shown here:
|
. |
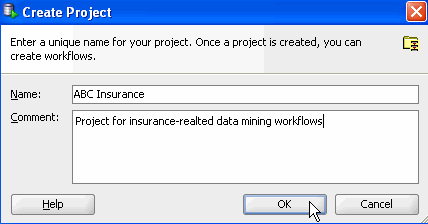
In the Create Project window, enter a project name and then click OK.
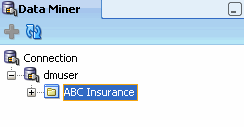
Note: You may optionally enter a comment that describes the intentions for this project. This description can be modified at any time. Result: The new project appears below the connection node.
|

Build a Data Miner Workflow
A Data Miner Workflow includes the instructions required to perform one or more data mining processes.
A workflow:
- Provides directions for the Data Mining server. For example, the workflow says "Build a model with these characteristics." The model is built by the data mining server with the results returned to the workflow.
- Enables you to interactively build, analyze, and test a data mining process within a graphical environment.
- May be used to test and analyze only one cycle within a particular phase of a larger process, or it may encapsulate all phases of a process designed to solve a particular business problem.
What Does a Data Miner Workflow Contain?
Visually, a workflow serves as a canvas on which you build the graphical representation of a data mining process flow. Each element in the process is represented by a graphical icon called a node. Each node has specific purpose, contains specific instructions, and may be modified individually in numerous ways.
When linked together, workflow nodes construct the modeling process by which your particular data mining problem is solved.
Workflow nodes are located on the Workflow Editor of the Component Palette. Workflow nodes are grouped into several different categories, including: Models, Evaluate and Apply, Data, Transforms, Text, and Linking Nodes.

Any node may be added to a workflow by simply dragging and dropping it onto the workflow area. Each node contains a set of default properties. You modify the properties as desired until you ready to move onto the next step in the process.
Sample Data Mining Scenario
In this topic, you will create a data mining process that predicts which existing customers are most likely to purchase insurance.
To accomplish this goal, you build a workflow that enables you to:
- Identify and examine the source data
- Build and compare several Classification models
- Select and run the models that produce the most actionable results
To create the workflow for this process, perform the following steps.
Create a Workflow and Add a Data Source
. |
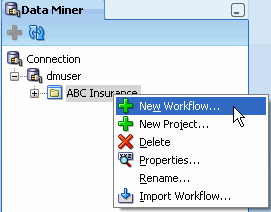
Right-click your project (ABC Insurance) and select New Workflow from the menu.
Result: The Create Workflow window appears.
|
|---|---|
. |
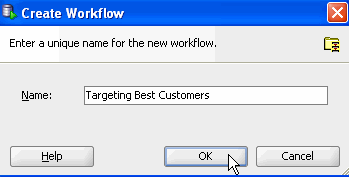
In the Create Workflow window, enter Targeting Best Customers as the name and click OK.
Result:
|
. |
The first element of any workflow is the source data. Here, you add a Data Source node to the workflow, and select the CUST_INSUR_LTV_SAMPLE table as the data source. A. In the Component Palette, click the Data category. A list of data nodes appear, as shown here:
B. Drag and drop the Data Source node onto the Workflow pane. Result: A Data Source node appears in the Workflow pane and the Define Data Source wizard opens. Notes:
|
. |
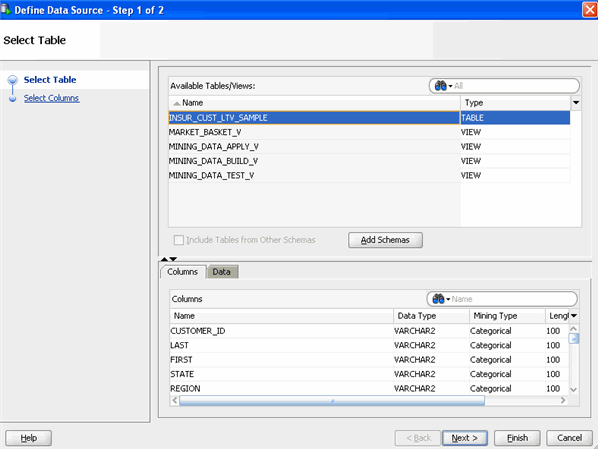
In Step 1 of the wizard: A. Select CUST_INSUR_LTV_SAMPLE from the Available Tables/Views list, as shown here:
Note: You may use the two tabs in the bottom pane in the wizard to view and examine the selected table. The Columns tab displays information about the table structure, and the Data tab shows a subset of data from the selected table or view. B. Click Next to continue.
|
. |
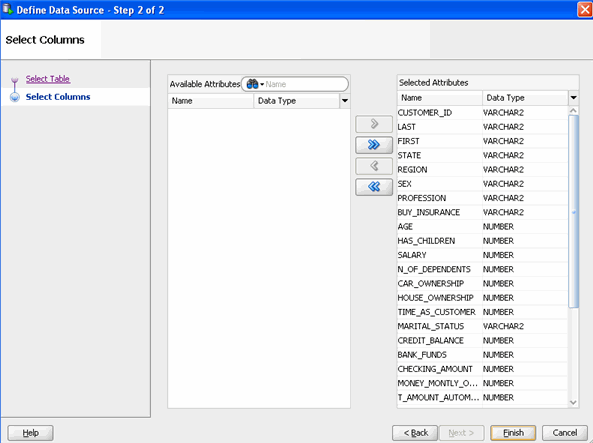
In Step 2 of the wizard, you may remove specific columns from the table or view that you don't need in your data source. In our case, we'll keep all of the attributes that are defined in the table. At the bottom of the wizard window, click Finish.
Result: As shown below, the data source node name is updated with the selected table name, and the properties associated with the node are displayed in the Property Inspector, located below the Component Palette pane.
Notes:
|


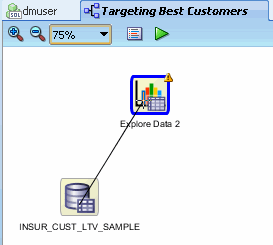
Examine the Source Data
Next, you can use a Explore Profile node to examine the source data. Although this is an optional step, Oracle Data Miner provides this tool to enable you to verify if the selected data meets the criteria to solve the stated business problem.
Follow these steps:
|


Create Classification Models
As stated in the Overview section of this tutorial, classification models are used to predict individual behavior. In this scenario, you want to predict which customers are most likely to buy insurance. Therefore, you will specify a classification model.
By default, Oracle Data Miner selects all of the supported algorithms for a Classification model. Here, you define a Classification node that uses all algorithms for the model. In the following topic, you will run and examine each of the models.
To create the default Classification models, follow these steps:
. |
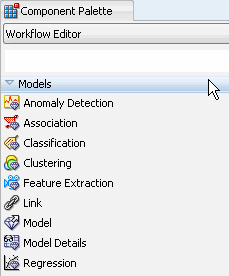
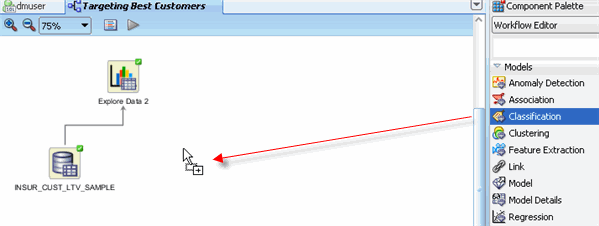
A. First, click on Models in the Component Palette to display the available list:
B. Then, drag the Classification node from the paleltte to the Workflow pane, like this:
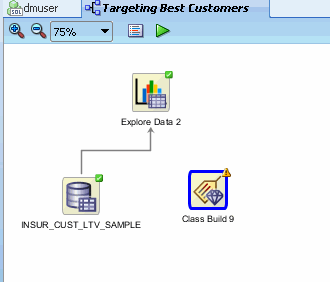
C. Drop the node onto the workflow. After a moment, a "Class Build" node appears in the workflow:
Notes:
|
|---|---|
. |
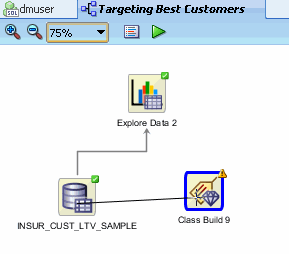
First, link the data source node to the classification build node using the same technique described previously.
Result: the Edit Classification window appears.
Note: Notice that a red "X" indicator is displayed the Target field. This means that an attribute must be selected for this item.
|
. |
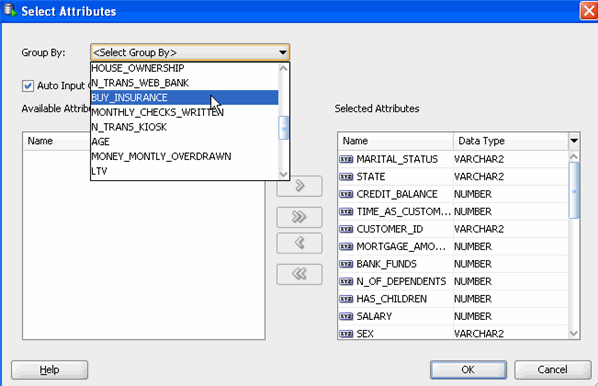
In the Edit Classification window: A. Select BUY_INSURANCE as the Target attribute. B. Select CUSTOMER_ID as the Case Id attribute.
Notes:
|
. |
Optionally, you can modify specific settings for each of the algorithms by using the Advanced button. A. Click Advanced at the bottom of the Edit Classification window to display the Advanced Settings window, as shown here:
Notes:
B. Select the Support Vector Machine algorithm and click the Algorithm Settings tab. C. Then, In the Kernel Function option, select Linear, as shown here:
Notes:
D. Feel free to view any of the tabs for each algorithm, however do not modify any of the other default settings. E. When you are done browsing, click OK to save the SVM algorithm setting close the Advanced Settings window.
|
. |
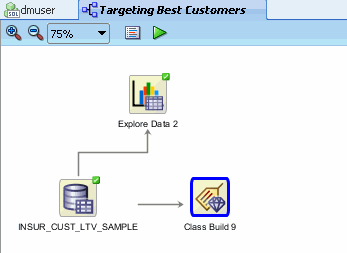
Finally, click OK in the Edit Classification window to save your changes. Result: The classification build node is ready to run.
Note: In the Models tab of the Properties Inspector, you can see the current status for each of the selected algorithms, as shown below:
|
. |
Save the workflow by clicking the Save All icon in main toolbar.
|


Build the Models
In this topic, you build the selected models against the source data. This operation is also called “training”, a model, and the model is said to “learn” from the training data.
A common data mining practice is to test (or train) your model against part of the source data, and then to apply the model against the remaining portion of your data. By default, Oracle Data Miner this approach.
Before building the models, select Class Build node and choose the Test tab in the Property Inspector. Then, change the split to 50, as shown here:
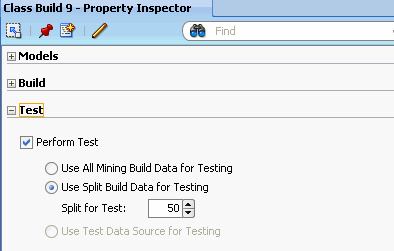
With this setting, Oracle Data Miner will split the build data in a 50/50 fashion.
To build the models, run the classification node.
. |
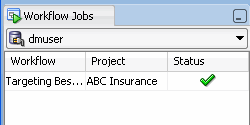
Right-click the classification build node and select Run from the pop-up menu. As before, the Workflow Jobs tab shows the status of the build. When the build is complete, the status column displays a green check mark.
In the workflow pane, the border of the build node displays a green gear turning as the build is in process. When complete, the border of the build node shows a green check mark, like this:
Note: After the build is complete, the workflow is automatically saved.
|
|---|---|
. |
Once the build process is complete, you can view several pieces of information about the build using the property inspectory. A. Select the classification build node in the workflow, and then choose the Models tab in the Property Inspector.
Notes:
|


Compare the Models
After you build/train the selected models, you can view and evaluate the results for all of the models in a comparative format. Here, you compare the relative results of all four classification models.
Follow these steps:
. |
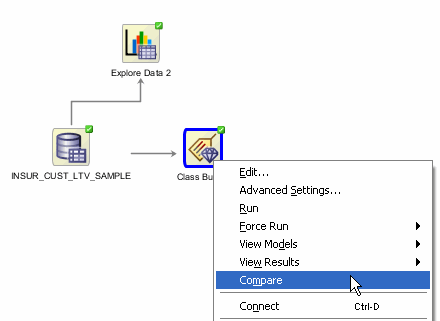
Right-click the build node and select Compare from the menu.
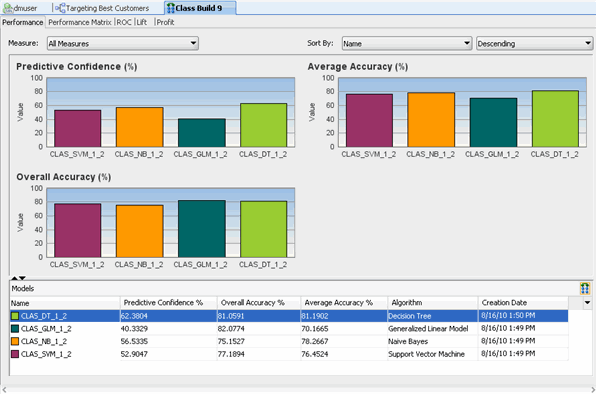
Results: A Class Build display tab opens, showing a graphical comparison of the four models, as shown here:
Notes:
|
|---|---|
. |
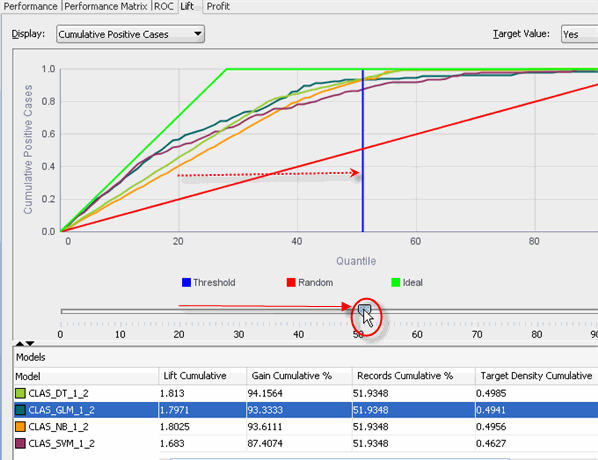
Select the Lift tab.
Notes:
|
. |
Next, select the Performance Matrix tab.
Note: The Performance Matrix shows that the GLM and DT models have a significantly higher Correct Prediction percentage than the other models, at over 80% each.
|
. |
Compare the details for the GLM and DT models. First, select the GLM model to view the Target Value Details for this model. Recall that the "Target Value" for each of the models is the BUY_INSURANCE attribute.
Notes: The GLM model indicates an 96.6% correct prediction outcome for customers that don't buy insurance, but only a 43.3% correct prediction outcome for customers that do buy insurance. Next, select the DT model.
Notes: The DT model indicates an 80.9% correct prediction outcome for customers that don't buy insurance, and an 81.5% correct prediction outcome for customers that do buy insurance.
|
. |
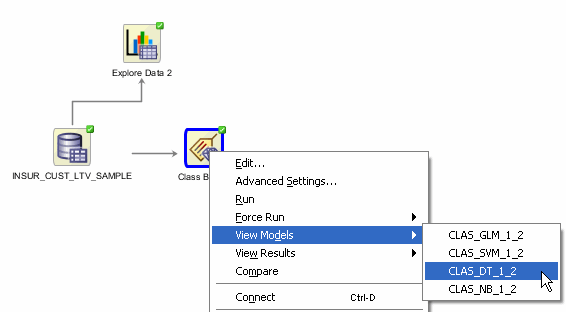
After considering the initial analysis, you decide to investigate the Decision Tree model more closely. First, dismiss the Class Build - Compare Models tab, as shown here:
|


Select and Examine a Specific Model
Using the analysis performed in the past topic, the Decision Tree model is selected for further analysis.
Follow these steps to examine the Decision Tree model.
. |
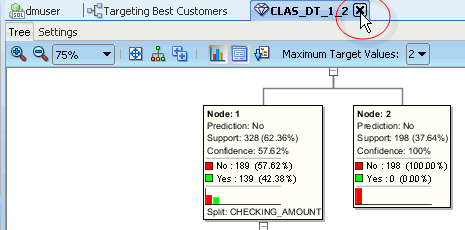
Back in the workflow canvas, right-click the Class Build node again, and select View Models > CLAS_DT_1_2 (Note: The name of your Decision Tree model may be different).
Result: A window opens that displays a graphical presentation of the Decision Tree.
|
|---|---|
. |
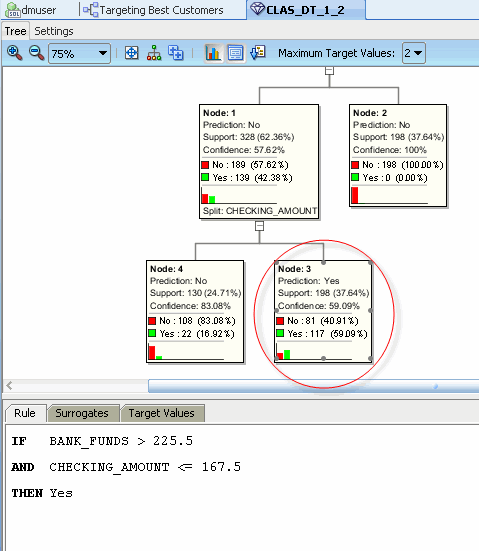
In the interface provides several methods of viewing navigation:
For example, set the the primary viewer window for the decision tree to 75% zoom. This provides a wider view than 100%, but the content within the view is somewhat smaller.
|
. |
At each level within the decision tree, an IF/THEN statement is executed. As each level within the tree is added, another condition is added to the statment. Notes: Commonly, a decision tree model would show a much larger set of levels and also nodes within each level in the decision tree. However, the data set used for this lesson is significantly smaller than a normal data mining set, and therefore the decision tree is also small. First, navigate to and select Node 3 in the tree. Notes:
|
. |
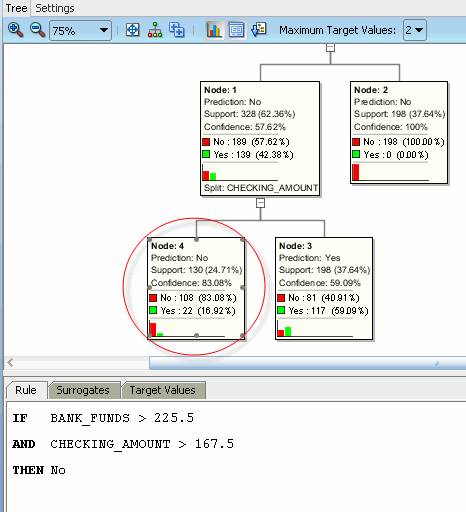
Next, select Node 4 in the tree. Notes:
|
. |
Close the Decision Tree display (CLAS_DT_1_2 tab in this example).
|

Apply the Model
In this topic, you apply the Decision Tree model and then create a table to display the results. You "apply" a model in order to make predictions - in this case to predict which customers are likely to buy insurance.
To apply a model, you perform the following steps:
- First, specify the desired model (or models) in the Class Build node.
- Then, you add a new Data Source node to the workflow. (This node will serve as the "Apply" data.)
- Next, add an Apply node to the workflow.
- Finally, you link both the Class Build node and the new Data Source node to the Apply node.
Follow these steps to apply the model and display the results:
. |
In the workflow, select the Class Build node and uncheck all of the models except for the DT model (using the Models tab of the Property Inspector), like this:
|
|---|---|
. |
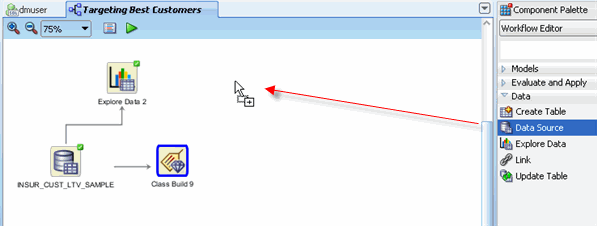
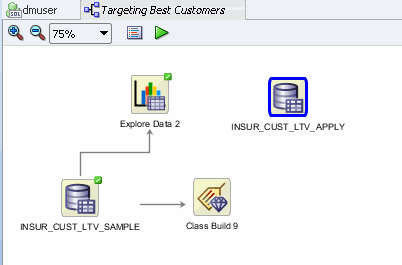
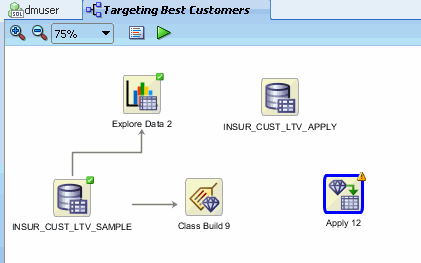
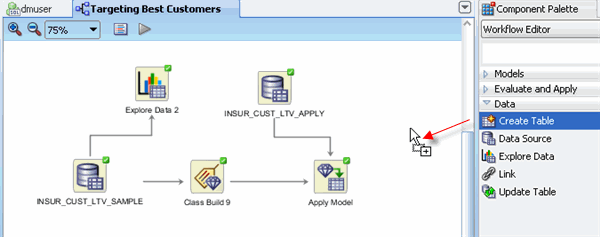
Next, create a new Data Source node in the workflow. Note: Even though we are using the same table as the "Apply" data source, you must still add a second data source node to the workflow. A. From the Data list in the Component Palette, drag and drop the Data Source node to the workflow canvas, like this:
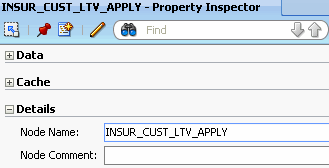
B. In the Define Data Source wizard, select the CUST_INSUR_LTV_SAMPLE table, and then click FINISH. Result: A new data souce node appears on the workflow canvas. C. Select the new data source node, and using the Details tab of the Property Inspector, change the Node Name to CUST_INSUR_LTV_APPLY, like this:
Result: The new table name is reflected in workflow.
|
. |
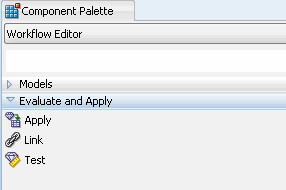
Next, open the Evaluate and Apply list in the Components Palette, like this:
|
. |
A. Drag and drop the Apply node to the workflow canvas, like this:
Result: An Apply node is added to the workflow with a yellow exclamation mark in its border. This, of course, indicates that more information is required before this node may be run.
B. Using the Details tab of the Property Inspectory, rename the Apply node to APPLY MODEL.
|
. |
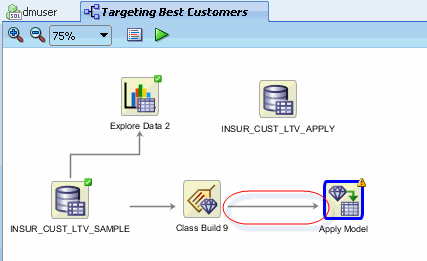
Using the techniques described previously, connect the Class Build node to the APPLY MODEL node, like this:
|
. |
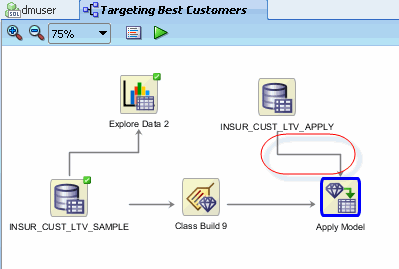
Then, connect the CUST_INSUR_LTV_APPLY node to the APPLY MODEL node:
Notes:
|
. |
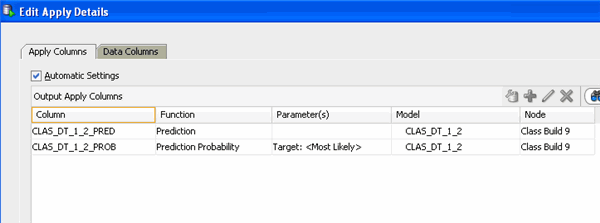
Before you execute the apply model node, consider the resulting output. By default, an apply node creates two columns of information for each customer:
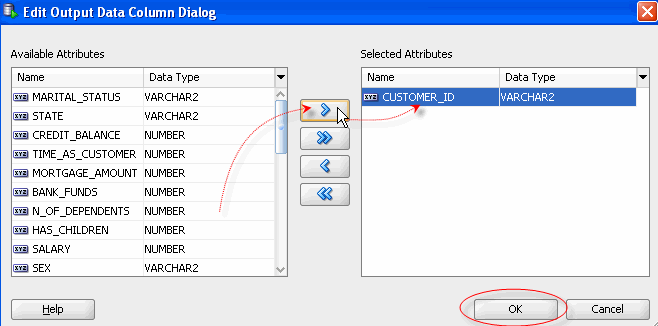
However, you really want to know this information for each customer, so that you can readily associate the preditive information with a given customer. To get this information, you need to add a third column to the apply output: CUSTOMER_ID. Follow these instructions to add the customer id to the output: A. Right-click the APPLY MODEL node and select Edit. Result: The Edit Apply Details window appears. Notice that the Prediction and Probability columns are defined automatically in Apply Columns tab.
B. In the Edit Apply Details window, select the Data Columns tab, and then click the green "+" sign.
C.In the Edit Output Data Column Dialog: select CUSTOMER_ID in the Available Attributes list; move it to the Selected Attributes List using the shuttle control; and then click OK.
Result: the CUSTOMER_ID column is added to the Data Columns tab. D. Finally, click OK in the Edit Apply Details window to save the change.
|
. |
Now, you are ready to execute the Apply node. Right-click the APPLY MODEL node and select Run from the menu.
Result:
|
. |
Optionally, you can create a database table to store the the model prediction results (the "apply" results). The table may be used for any number of reasons. For example, an application could read the predictions from that table, and suggest an appropriate response, like sending the customer a letter, offering the customer a discount, or some other appropriate action. To create a table of model prediction results, perform the following: A. Using the Data list in the Component Palette, drag the Create Table node to the workflow canvas, like this:
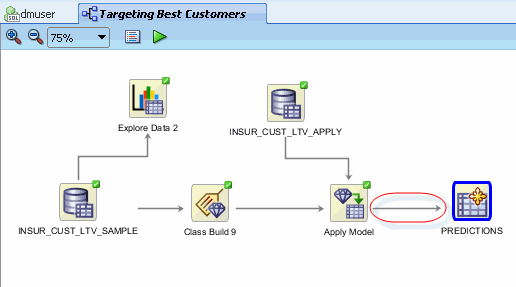
Result: an OUTPUT node is created. B. Rename the OUTPUT node PREDICTIONS, by using the Details tab of the Property Inspector. C. Link the APPLY MODEL node to the PREDICTIONS node.
D. Specify a specific name for the table that will be created (otherwise, Data Miner will create a default name):
E. Lastly, right-click the PREDICTIONS node and select Run from the menu. Result: When the process is complete, the workflow document is automatically saved, and all nodes contain a green check mark in the border, like this
Note: After you run the OUTPUT (PREDICTIONS) node, the table is created in your schema.
|
. |
A. To view the results, right-click the PREDICTIONS Table node and select View Data from the Menu. Result: A new tab opens with the contents of the table. Notes:
B. Click Apply Sort to view the results:
Notes:
C. When you are done viewing the results, close the tab for the PREDICTIONS Table.
|


Summary
In this lesson, you examined and solved a data mining business problem by using the Oracle Data Miner graphical user interface, which is included as an extension to SQL Developer, version 3.0.
In this tutorial, you have learned how to:
- Create a database connection
- Create a Data Miner project
- Build a Workflow document that uses Classification models to predict customer behavior.
Resources
To learn more about Oracle Data Mining:
- See the Oracle Data Mining home page on OTN.
Curriculum Developer: Brian Pottle
Technical Contributors: Charlie Berger, Mark Kelly, Margaret Taft
![]()