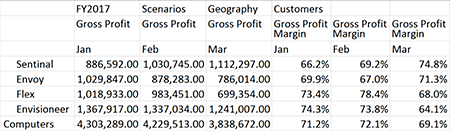
Look familiar? This Oracle Analytics Cloud Data Visualization shows the same dimensions and analysis on product trending from our Essbase application (shown above).
In the visualization, trends stand out, and the “bigger picture” and categorical breakdowns are revealed with a full year-over-year comparison and additional product category break down of Gross Profit - illustrating the benefits of visualization vs straight data. Possibilities are endless and easy to add or remove.
Click “Show Less” below to minimize this window for easier comparison!