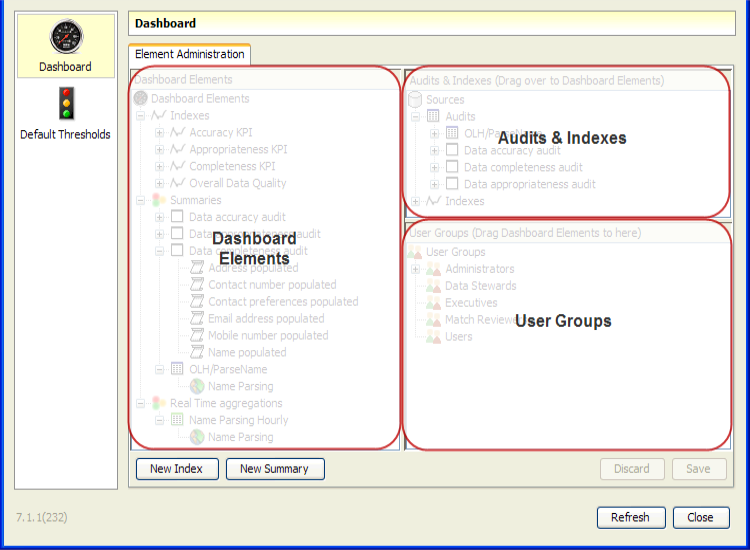
The Dashboard view is divided into three panes as follows:
The Dashboard Elements section shows all Dashboard Elements, organized by their aggregations. Note that all published results are aggregated, because new results are aggregated into a default Summary based on the OEDQ process from which they were published. These Summaries always appear in the Dashboard Elements section even if they are not associated with any User Groups and so will not appear on any user dashboards. The same Rule Results may be listed under several aggregations.
The three types of aggregation are Indexes, Summaries and Real Time Aggregation.
Use the Dashboard Elements pane to create new aggregations of results, as follows:
To create a new index, click on the New Index button at the bottom of the Dashboard Elements pane, and give the index a name, as you want it to appear on users' dashboards. For example an index to measure the quality of customer data might be named 'Customer DQ'.
To add rule results to the index, drag and drop Rule Results from either the Dashboard Elements pane or the Audits & Indexes pane. Note that if you drag a Summary onto the index, all the Rule Results that make up the summary are added to the index.
It is also possible to add other indexes to the index, to create an index of other indexes. To see how this will affect the index calculation, see Indexes in the Dashboard Concepts guide.
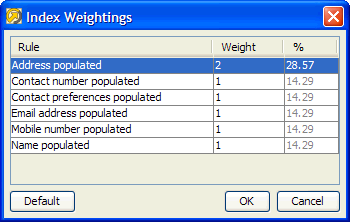
Once you have added all the contributing rules and/or other indexes, you can configure the weightings of the index. By default, all contributing rules/indexes will be equally weighted, but you can change this by right-clicking on the index and selecting Custom Weightings.
To change the weightings, change the weighting numbers. The percentage weighting of the contributing rule or index will be automatically calculated. For example, the following screen shows an index with 6 contributing rules. The Address populated rule is given a weighting of 2 (that is, it is weighted twice as strongly as the other rules):
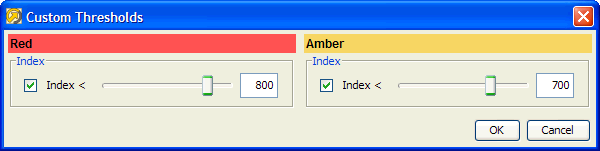
If required, you can also change the way the status of the index (Red, Amber or Green) is calculated. Otherwise, the status of the index will be calculated using the rules expressed in the Default Thresholds section.
To change the way the status is calculated for this index only, right-click on the index and select Custom Thresholds. For example, if you want this particular index to have a Red (alert) status whenever it is below 800 and an Amber status whenever it is below 700, you can configure the thresholds as follows:
When you have finished configuring the index, you must choose which User Groups you want to be able to monitor the index. To do this, simply drag and drop the index on to groups in the User Groups pane. Users in those Groups will now be able to use the Customize link on the Dashboard to add the new index to their Dashboards.
To create a new summary, click on the New Summary button at the bottom of the Dashboard Elements pane, and give the summary a name, as you want it to appear on users' dashboards. For example a summary of all product data rules might be simply called Product Data.
To add rule results to the summary, drag and drop Rule Results from either the Dashboard Elements pane or the Audits & Indexes pane. Note that if you drag another summary onto the new summary, all the contributing rule results of the summary that you dragged will be added to the new summary.
If required, you can also change the way the status of the summary (Red, Amber or Green) is calculated. Otherwise, the status of the summary will be calculated using the rules expressed in the Default Thresholds section.
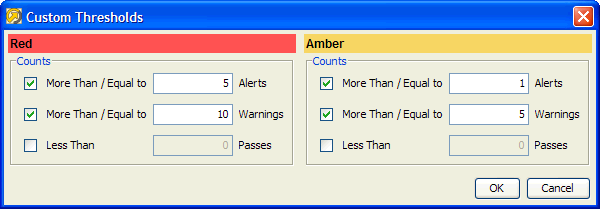
To change the way the status is calculated for this summary only, right-click on the summary and select Custom Thresholds. For example, if you want this particular summary to have a Red (alert) status whenever 5 or more contributing rules are Red or when 10 or more contributing rules are Amber, and you want the summary to have an Amber (warning) status whenever 1 or more contributing rules are Red or when 5 or more contributing rules are Amber, you can configure custom thresholds as follows:
When you have finished configuring the summary, you must choose which User Groups you want to be able to monitor the summary. To do this, simply drag and drop the summary on to groups in the User Groups pane. Users in those Groups will now be able to use the Customize link on the Dashboard to add the new summary to their Dashboards.
To create a new Real Time Aggregation, drag and drop a Real Time Rule Results dashboard element from the Audits & Indexes pane to the Real Time Aggregations node in the Dashboard Elements pane.
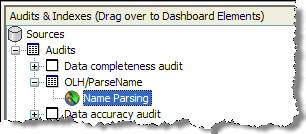
Note that Real Time Rule Results are indicated by the globe icon:
You will be prompted to save before specifying the details of the Real Time Aggregation. For example, to create a daily aggregation of a real time rule that validates names, you might specify the following details:
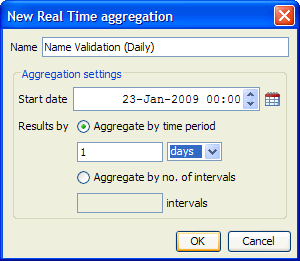
If a time period is specified, the Real Time Aggregation will include rule results for each completed interval that falls within the specified time period. (It will normally make sense to use a 'round' start time, such as midnight, for daily aggregations, and the beginning of an hour for hourly aggregations.)
If a number of intervals is specified the Real Time Aggregation will include rule results for the stated number of intervals starting from the stated start date and time.
In both cases, rule results are simply added up, so for example the number of Alerts for the aggregation will be the number of alerts summed across all included intervals.
If required, you can also change the way the status of the real time aggregation (Red, Amber or Green) is calculated. Otherwise, the status will be calculated using the rules expressed in the Default Thresholds section.
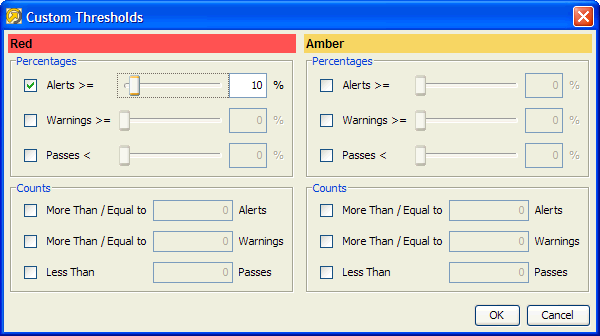
To change the way the status is calculated for this real time aggregation only, right-click on the aggregation and select Custom Thresholds. For example, if you want this particular aggregation to have a Red (alert) status if 10% or more of the checks performed are alerts, you can configure custom thresholds as follows:
The Audits & Indexes pane shows all directly published Rule Results organized by 'Audits'; that is, the OEDQ processes under which they were published, and all configured Indexes.
Drag Rule Results from this pane to the Dashboard Elements pane to create new aggregations of results.
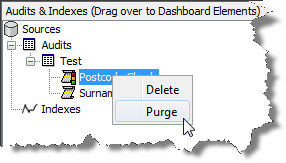
To purge the data from an audit or an index, right click on the element in the Audits & Indexes pane and select Purge:
All the data that has been published to that element will be purged from the Dashboard. The results stored in OEDQ will be unaffected.
The changes will not be made permanent until you save them in Dashboard Administration.
To delete an element from the list in the Audits and Indexes pane, right click on the element in the Audits & Indexes pane and select Delete:

The element will be deleted from the Dashboard and from Dashboard Administration. The changes will not be made permanent until you save them in Dashboard Administration.
|
Note:Deleted elements will be reinstated if the process that published them is re-run with the 'Publish to Dashboard' option enabled. However, customizations that have been made in Dashboard Administration, such as custom thresholds, will not be re-created. |
The User Groups pane shows all configured User Groups, and the dashboard elements to which they have been granted access. To grant a group access to view a dashboard element, simply drag it from the Dashboard Elements pane on to the Group name.
Note that the actual dashboard elements that appear on a user's dashboard are configurable by the users themselves. Users can log in and click on the Customize link to change which dashboard elements they want to monitor.
Oracle ® Enterprise Data Quality Help version 9.0
Copyright ©
2006,2012, Oracle and/or its affiliates. All rights reserved.