Quickstats Profiler |
The Quickstats Profiler provides fundamental quality metrics for a number of records or transactions, highlighting:
Each input attribute is profiled individually.
Quickstats is useful to establish a picture of some of the fundamentals of data and its quality.
Often documentation and meta-data information are missing, incomplete, out of date, or not trusted. It is important to produce an unequivocal picture of the data, from the data itself, so that mistakes are not made inadvertently through false assumptions.
Any attributes from which you wish to obtain quick profiling statistics.
None
None
|
Flag attribute |
Purpose |
Possible Values |
|
[Attribute name].Populated |
Indicates which records are populated |
Y/N |
|
Execution Mode |
Supported |
|
Batch |
Yes |
|
Real time monitoring |
Yes |
|
Real time response |
No |
The Quickstats Profiler requires a batch of records to produce its statistics (for example, in order to tell how many duplicate values there are for each attribute analyzed). It must therefore run to completion before its results are available, and is not suitable for a process that requires a real time response.
When executed against a batch of transactions from a real time data source, it will finish its processing when the commit point (transaction or time limit) configured on the Read Processor is reached.
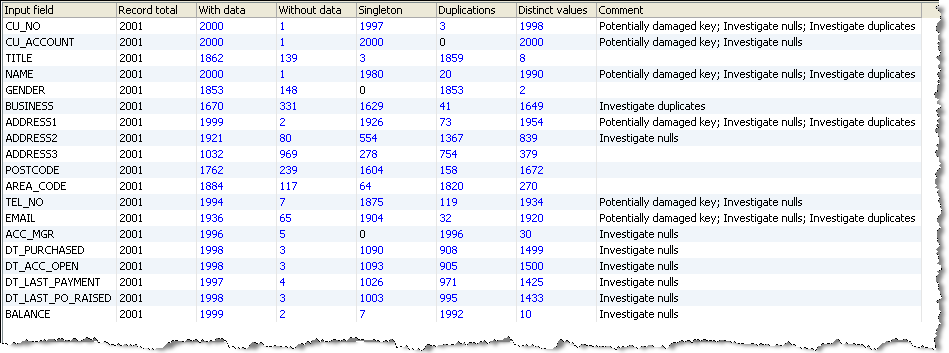
The Quickstats Profiler produces a summary view of its results, showing the following statistics for each attribute:
Clicking on the Additional Information button will show the above statistics as percentages of the total number of records analyzed.
Automated Comments
Automated Comments are generated in order to highlight potential areas of interest in the data. For example:
Note that where many of the above comments apply, the comments are concatenated - see the Example below.
In this example, the Quickstats Profiler is used to gain an initial overview of a table of Customer records:
Summary View
In most cases, drilling down on the numbers in the Summary View will take you directly to the records. However, some numbers take you to an interim view. For example:
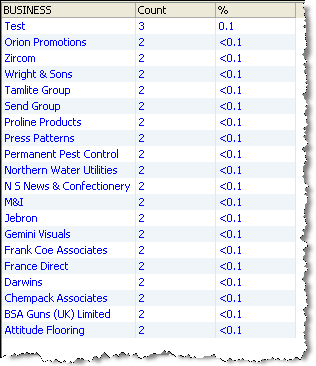
Duplications Drilldown
If you drill down on the 41 duplicate BUSINESS values in the Summary View, OEDQ shows the frequency of each duplicate value:
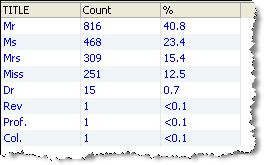
If you drill down on the 8 distinct TITLE values in the Summary View, OEDQ shows the frequency of each distinct value:
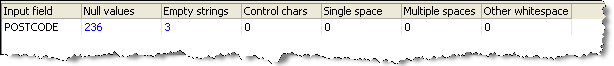
No Data Values Drilldown
If you drill down on the 239 POSTCODE values without any data in the Summary View, OEDQ shows a summary view of the different types of No Data found (though note that all of these will be Null values if the default No Data Handling Reference Data map is used in the Reader or Snapshot):
Oracle ® Enterprise Data Quality Help version 9.0
Copyright ©
2006,2011 Oracle and/or its affiliates. All rights reserved.