Before You Begin
Purpose
This tutorial covers the use of Oracle Data Miner 17.2 to leverage text mining enhancements while applying a clustering model.
With the release of Oracle Database 12c, Oracle Data Mining includes a new clustering model algorithm named Expectation Maximization (EM). In this lesson, you learn how to use the EM algorithm in a clustering model while leveraging text mining enhancements that are included in Oracle Data Miner 17.2.
Time to Complete
Approximately 30 mins
Background
In addition to the existing k-Means and O-Cluster algorithms, Oracle Data Mining now supports Expectation Maximization, a clustering algorithm that creates a density model of the data. The density model allows for an improved approach to combining data originating in different domains. For example, EM enables combination of structured data (such as sales transactions and customer demographics) with unstructured data, such as text data.
In this lesson, you will create a new workflow that performs text mining activities with the EM algorithm, in order to illustrate these enhancements.
Scenario
This lesson focuses on a text mining problem that can be solved by applying a Clustering model using the EM algorithm. In our scenario, ABC Company wants to use the data from customer feedback to predict the kind of group (or cluster) to which a customer tends to belong.
To accomplish this goal, you build a workflow that:
- Combines text, demographic, and customer profile data
- Uses a Clustering model against the source data
- Specifies the EM algorithm, and enables text mining options within the clustering model
- Generates predictive results from the text data
Context
Before starting this tutorial, you should have set up Oracle Data Miner for use within Oracle SQL Developer 17.2, by completing the Setting Up Oracle Data Miner 17.2 tutorial.
In addition, if you are new to Oracle Data Miner, we strongly suggested that you complete the Using Oracle Data Miner 17.2 tutorial.
What Do You Need?
Have access to or have Installed the following:
- Oracle Database: Minimum: Oracle Database 12c Enterprise Edition, Release 1.0.2 (12.1.0.2.0) with the Advanced Analytics Option.
- The Oracle Database sample data, including the SH schema.
- SQL Developer 17.2
Build the Data Miner Workflow
As you have learned, a Data Miner Workflow is a collection of connected nodes that describe a data mining processes. In addition, you have learned that workflows are organized into a Data Miner project.
Here, you create a new workflow in the existing project that was created in the "Using Oracle Data Miner 17.2" tutorial.
First, you create the workflow and add a data source, then you complete the remaining tasks to perform the this text mining exercise.
Create a Workflow and Add a Data Source
-
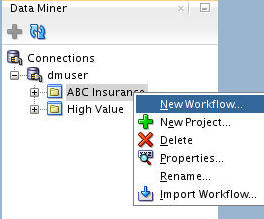
Right-click your project (ABC Insurance) and select New Workflow from the menu. Note: if you have not created this project, follow the simple instructions in the first topic of the "Using Oracle Data Miner 17.2" tutorial.
-
In the Create Workflow window, enter EM Clustering as the name and click OK.
Result: In the middle of the SQL Developer window, an empty workflow canvas opens with the workflow name that you specified, and the Components tab of the Workflow Editor appears, as you have seen before.
-
As always, start with one or more data sources.
A. In the Components tab, drill on the Data category, drag and drop a Data Source node on the workflow, and select MINING_DATA_TEXT_BUILD_V from the Available Tables/Views list in the wizard, as shown here:
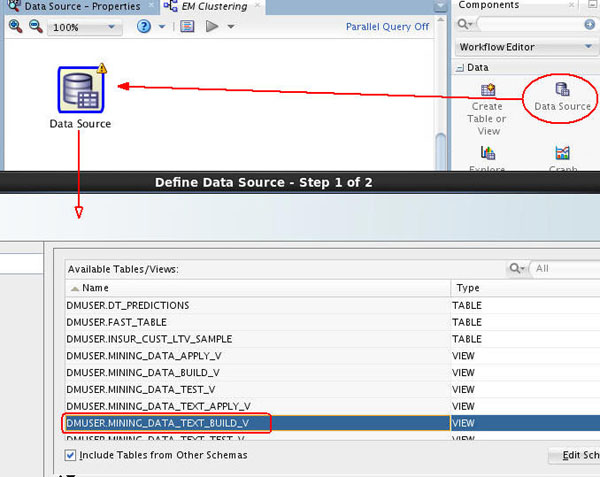
B. Then, click Finish to complete the data source node definition and close the wizard.
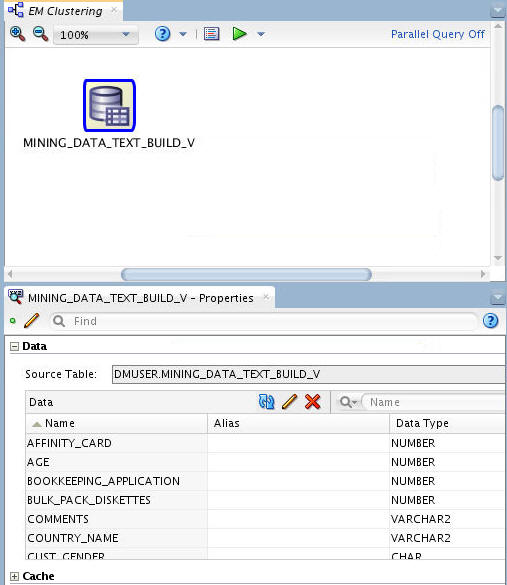
Result: As shown below, the data source node name is updated with the selected table name. Also, in our example we have placed the the Properties tab below the workflow pane.
-
Right-click the data source node and select View Data from the menu. A tabbed window for the data source appears then enables you to browse the data. For exammple:
A. Select the first record in the COMMENTS column. The View Value window appears (as well as the sunglasses icon).
B. Then, click the Wrap option to display the entire comment, as shown here:
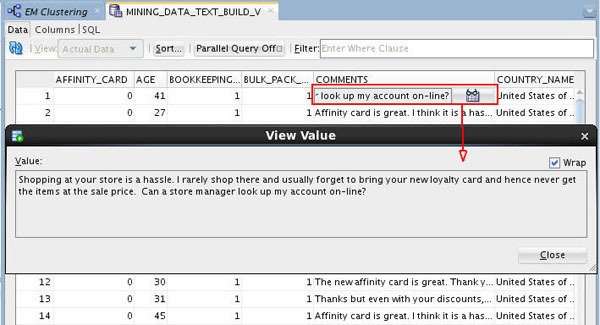
As shown above, this column contains customer feedback that we want to use in our text mining excercise. In the next topic, you will see how to specify the appropriate mining type for this column, so it may be used for text mining purposes.
-
Close the View Value window.
-
Dismiss the MINING_DATA_TEXT_BUILD_V window.
-
Save the workflow.
Create the EM Clustering Model
As stated earlier in this tutorial, Clustering models may be used to predict the groups (clusters) that categorize specified input attributes. In this scenario, you want to predict the cluster that a customer is most likely to belong to based on customer feedback.
By default, Oracle Data Miner selects all of the supported algorithms for a selected model. Here, you modify a Clustering node to use only the Expectation Maximization algorithm for the model. Then, you will enable text mining within the model.
-
First, add a Clustering node to the workflow:
A. Expand the Models category in the Components tab.
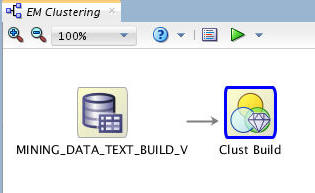
B. Then, drag and drop the Clustering node from the Components tab to the Workflow pane, like this:
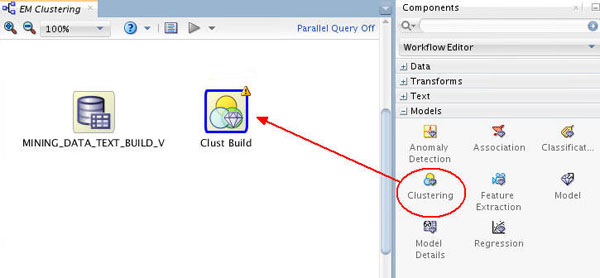
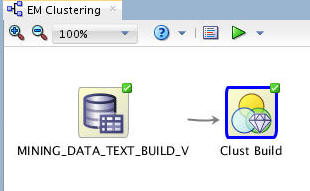
Result: A Clust Build node appears in the workflow.
Notes:
- The node name is automatically generated.
- As stated in previous lessons, a yellow exclamation mark on the border indicates that more information needs to be specified before the node is complete.
-
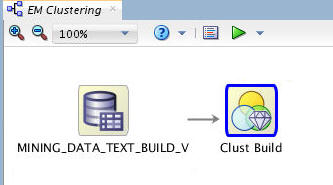
To connect the data source to the Clust Build node, right-click the data source node, select Connect from the pop-up menu, drag the pointer to the Clust Build node, and click.
Result: The display looks something like this:
-
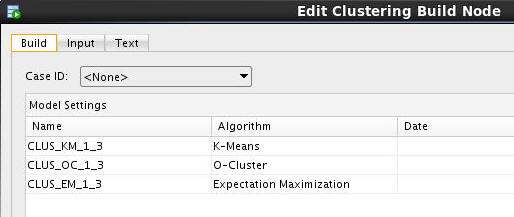
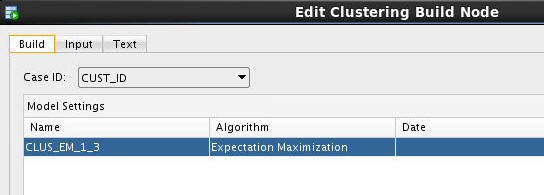
Double-click the clustering build node to display the Edit Clustering Build Node window.
The Build tab is displayed by default, showing all three of the clustering algorithms in the Model Settings list.
-
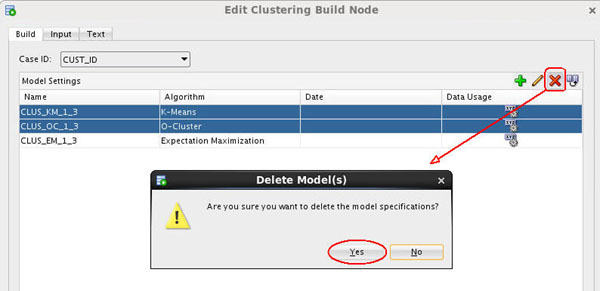
In this tab, you choose a Case ID value and remove the K-Means and O-Cluster algorithms.
A. Select CUST_ID as the Case ID value.
B. Select both the K-Means and O-Cluster algorithms as shown below.
C. Click the Delete tool (red "x"), and then click Yes in the warning dialog to remove the two algorithms from the Model Settings list.
Result: The Build tab should now look like this:
-
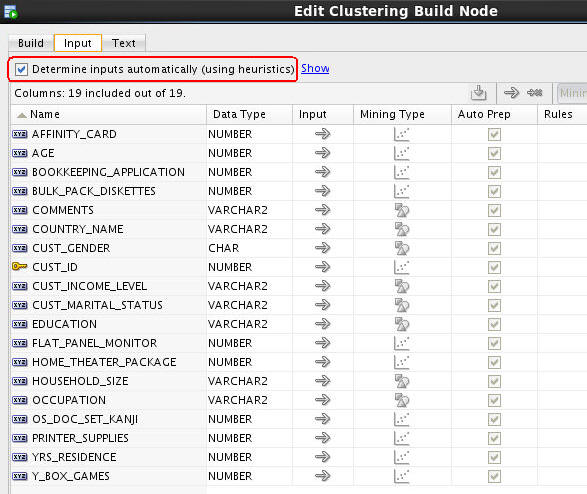
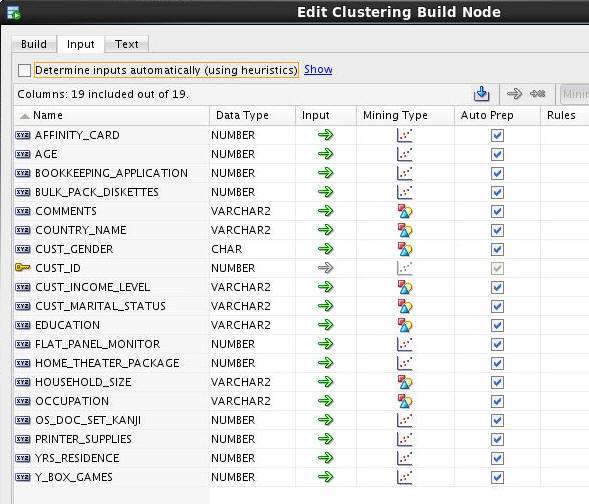
Next, select the Input tab.
This tab shows all of source data input attributes for the clustering model. By default, the option to Determine inputs automatically is enabled.
-
Next, you will modify settings for two of the input attributes: COMMENTS and PRINTER_SUPPLIES.
A. Select the COMMENTS attribute, and click the Categorical icon in the Mining Type column. Then use the pop-up menu to change the Mining Type from Categorical to Text, like this:
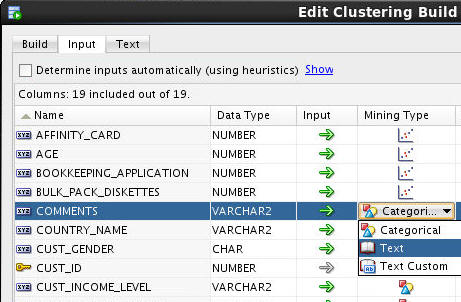
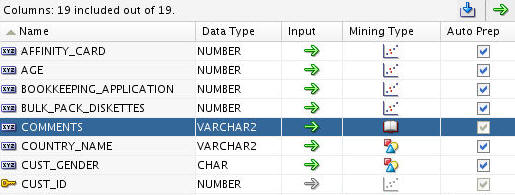
Result: The COMMENTS column is assigned a Mining Type of Text. Consequently, the Auto Prep option may not be disabled for this attribute.
B. Next, select the PRINTER_SUPPLIES attribute and click the Input icon (green arrow). Use the pop-up menu to select Ignore, like this:
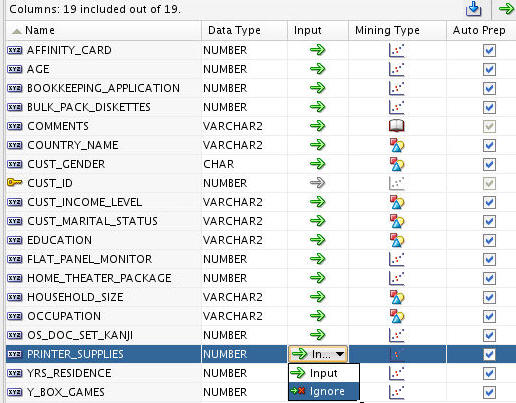
Note: Now, the COMMENTS column may now be used for text mining purposes, and the PRINTER_SUPPLIES column will not be used as an input attribute for the clustering model.
-
Next, select the Text tab.
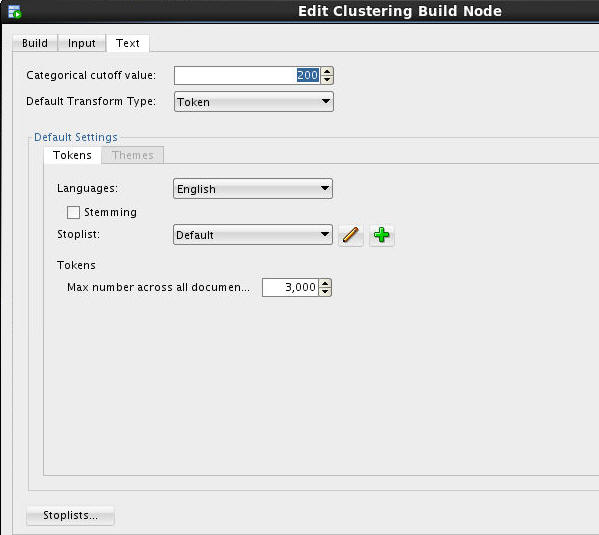
Here, you can modify a number of options that govern how text data is handled, including the following:
A. Categorical cutoff value. This value, set to 200 tokens (or words) by default, indicates the maximum length of a column before it is automatically changed from a Categorical mining type to a Text mining type.
B. Default Transform Type. Values include Token and Theme.
C. In addition, you can specify default settings for both Tokens and Themes in the Default Settings area, including language, stoplist, and maximum number of tokens or themes across documents. Note that tokens include a Stemming option for language, whereas Themes do not.
D. You can also use the Stoplist button to create custom stoplists.
-
Finally, click OK in the Edit Clustering Build Node window to save your changes
Result: The classification build node is ready to run.
Deselect the Determine inputs automatically option.
Now, the window should look like this:
Build the Model and View Results
In this topic, you build the EM clustering model against the source data. Once the model is built, you view and evaluate the results.
-
Right-click the Clust Build node and select Run from the pop-up menu.
When the build is complete, all nodes contain a green check mark in the node border, like this:
-
Next, right-click the clustering build node again, and select View Models > CLUS_EM_1_3 (Note: The automatically generated name of your Clustering model may be different than shown here.)
Result: The Edit Classification Build Node window automatically appears.
-
The Expectation Maximization algorithm has several model viewers, organized into tabs. We will examine the first four viewers.
By default, the Tree viewer opens. It contains a graphical display of the hierarchical tree model. You can easily navigate the cluster nodes of the tree. When you select a cluster node in the tree, details of that node are displayed in the bottom pane.
In the example, we select Cluster 2, which represents the slightly larger cluster after the split.
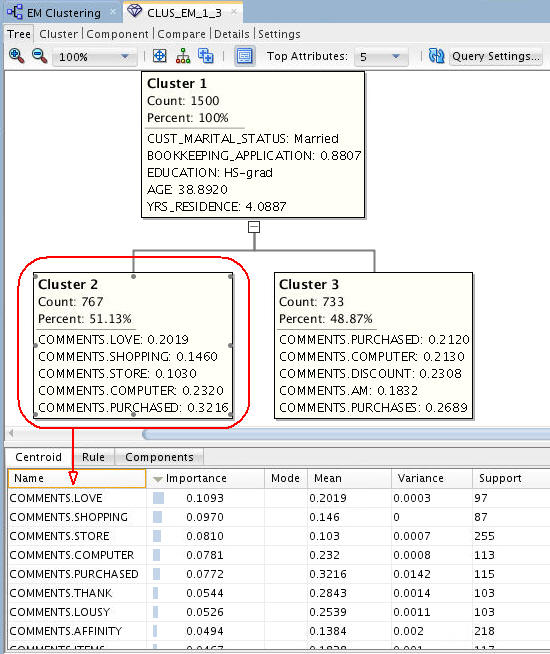
The bottom pane contains three tabs: Centroid, Rule, and Components. The Centroid tab displays a list of the attribute values that best define the selected cluster, ranked by importance.
-
Next, select the Component tab.
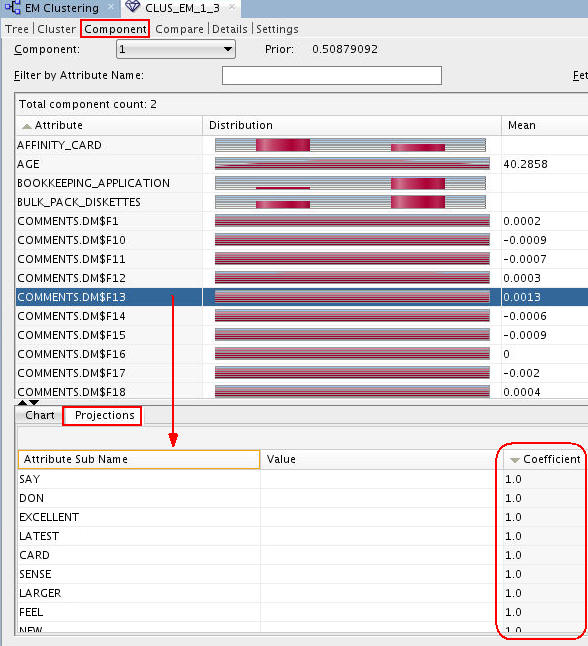
Notes: The Component tab includes distribution plots of the ranked text mining results. In this tab, the bottom pane provides two tabs: (A) The Chart tab provides a larger view of the selected attribute’s distribution chart. (B) The Projections tab (shown in the example) provides a list of the Attribute Sub Name values that best describe the selected attribute. Here, we sorted the list in descending order by Coefficient value.
-
Next, select the Cluster tab.
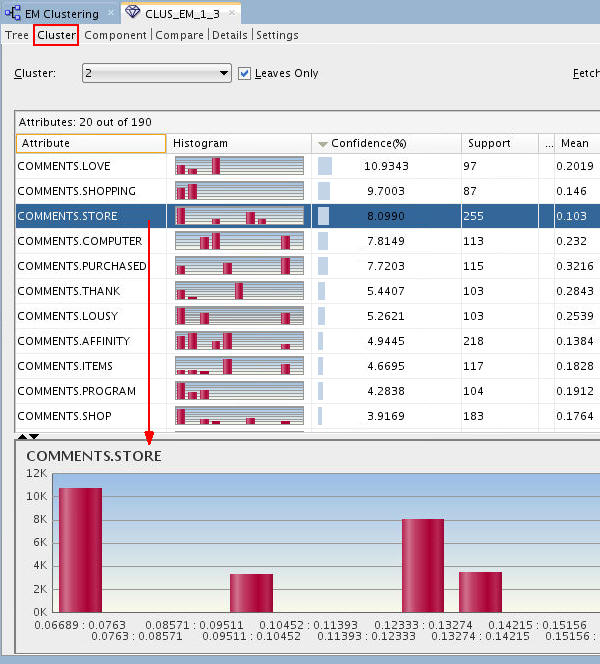
Notes: In this example, Cluster 2 is selected. This is the same cluster that we selected in the Tree viewer. The Cluster tab shows a list of contributing attributes, ranked by Confidence %. A histogram of the selected attribute is shown in the bottom pane.
-
Next, select the Compare tab.
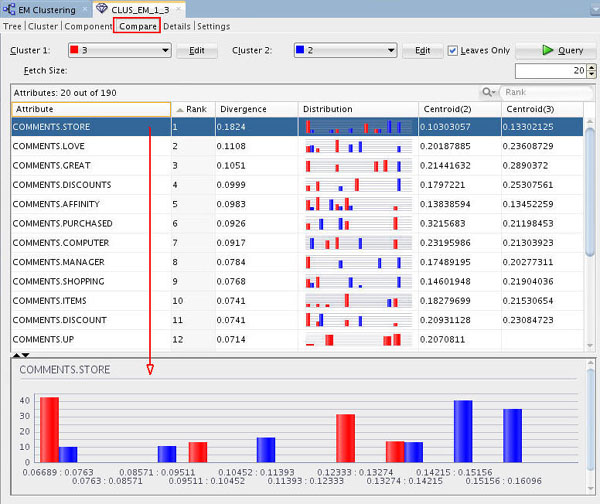
Notes: The Compare tab shows a list of contributing attributes for the selected clusters, sorted by Rank of importance. In this example, Clusters 2 and 3 are compared. A distribution histogram of the selected attribute is shown in the bottom pane
-
Dismiss the model viewer window.
Apply the Model
In this topic, you apply the EM clustering model in order to make predictions.
-
First, add a new Data Source node in the workflow.
A. From the Data group in the Components tab, drag and drop a Data Source node to the workflow pane, as shown below. The Define Data Source wizard opens automatically.
B. Select the MINING_DATA_TEST_APPLY_V view in Step 1 of the wizard.
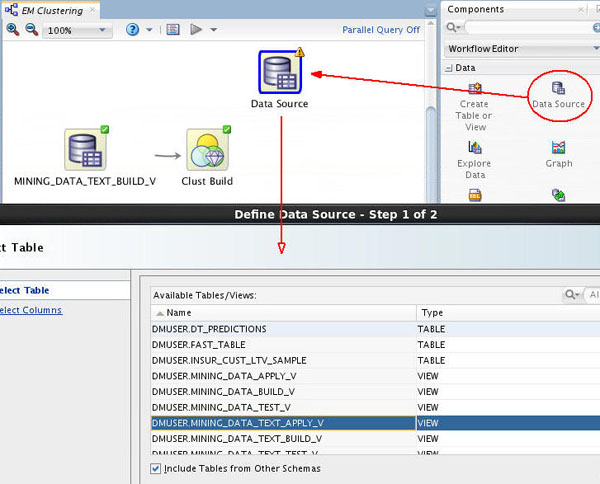
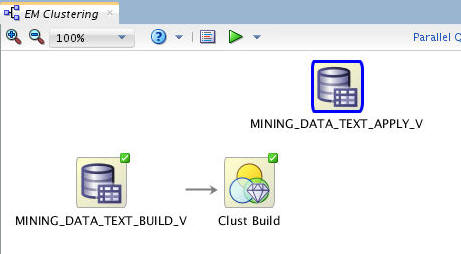
C. Then, click Finish to save the data source definition.
Result: The new data souce node appears in the workflow, like this:
-
Next, expand the Evaluate and Apply category in the Components tab and drag an Apply node to the workflow canvas, like this:
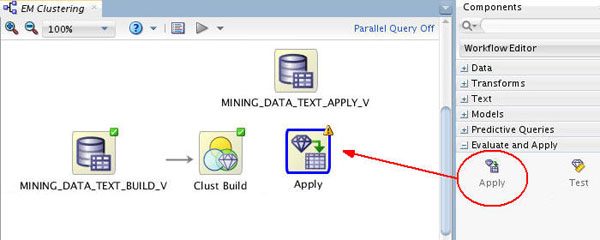
Result: An Apply node is added to the workflow with a yellow exclamation mark in its border. This, of course, indicates that more information is required before this node may be run.
-
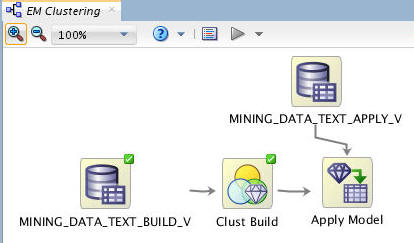
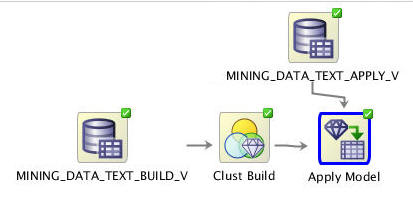
Using the techniques described previously, connect the Clust Build node to the Apply node, and then connect the MINING_DATA_TEXT_APPLY_V node to the Apply node.
Finally, rename the Apply node to Apply Model. The workflow should now look like this:
-
Before you run the Apply Model node, consider the resulting output.
By default, an apply node creates two columns of information for each customer:
- The Cluster ID
- The Cluster Probability
However, you really want to associate the predictive information with a given customer. To get this information, you need to add an additional column to the apply output: CUST_ID. Follow these instructions to add the customer id to the output:
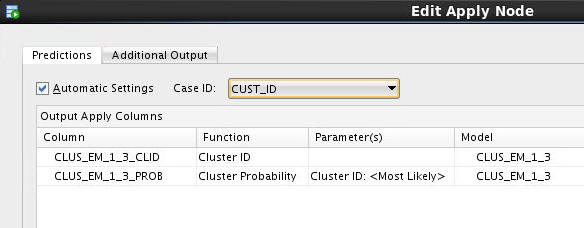
A. Right-click the Apply Model node and select Edit.
B. In the Predictions tab of the Edit Apply Node window, select CUST_ID as the Case ID.
Notice that the two Predictions are automatically defined.
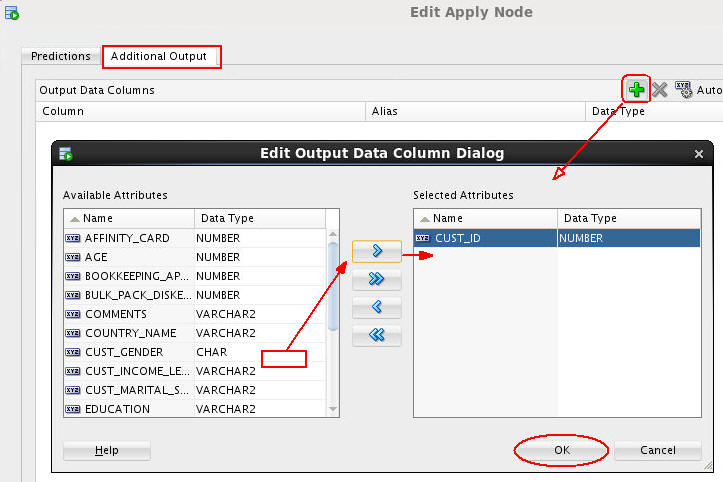
C. Select the Additional Output tab, and then click the green "+" sign.
D. Then, in the Edit Output Data Column Dialog, move CUST_ID from the Available Attributes list to the Selected Attributes list, and click OK.
Result: The CUST_ID column is added to the Additional Output tab, as shown here:
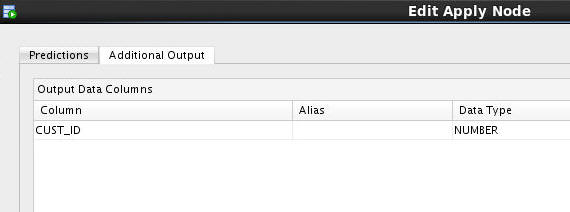
E. Finally, click OK in the Edit Apply Node window to save your changes.
-
Now, you are ready to apply the model. Right-click the Apply Model node and select Run from the menu.
Result: Small green gear icons appear in each of the nodes that are being processed. In addition, the execution status is shown at the top of the workflow pane.
When the process is complete, green check mark icons are displayed in the border of all workflow nodes to indicate that the server process completed successfully.
-
To view the results, perform the following:
A. Right-click the Apply Model node and select View Data from the Menu.
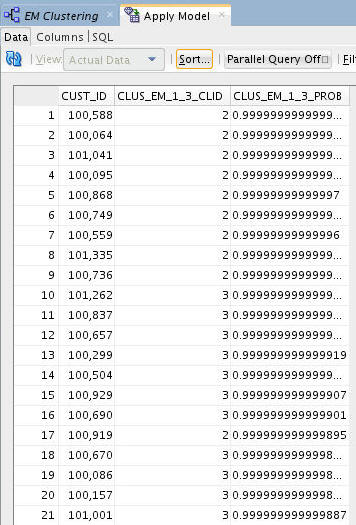
Result: A new tab opens with the contents of the output. The results include three columns: the customer ID, the cluster ID, and the cluster prediction probablility.
B. Click the Sort button, and specify a sort using the prediction probability, in descending order, as shown here:
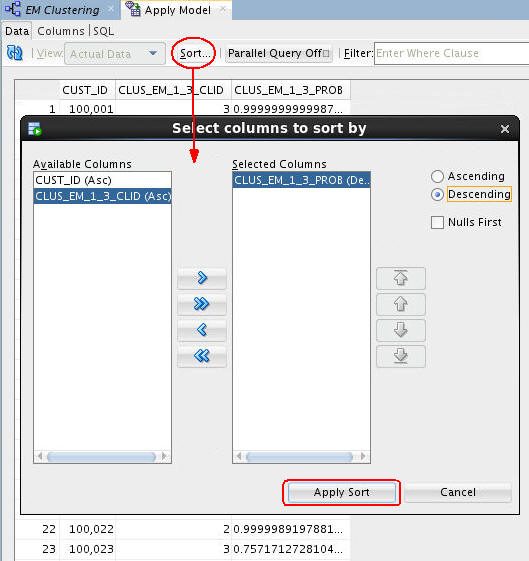
C. Finally, click Apply Sort to view the results.
Result: Your output should look something like this:
-
In addition, you can enter a Where clause in the Filter box to narrow the output results.
A. Enter the following Where clause:
CLUS_EM_1_3_CLID = 2 and CLUS_EM_1_3_PROB > .997
Note: Your column names may be different from those in this example. Make sure to enter the correct column names.
B. Then, press Enter.
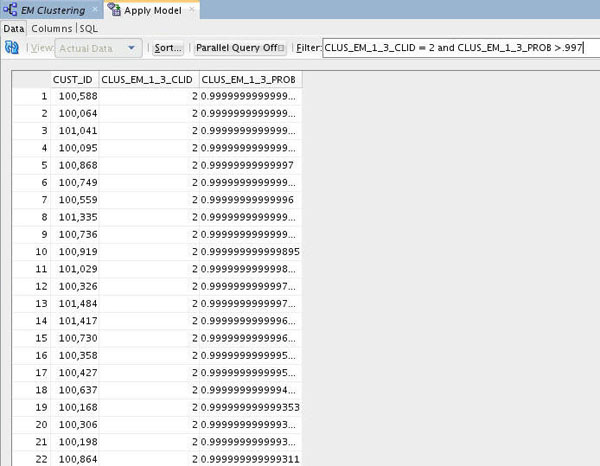
Description of this image Notes:
- The results should show records for those customers who are predicted to be in Cluster 2, with a probability greater than 99.7%.
- Each time you run an Apply node, Oracle Data Miner may take a different sample of the data to display. With each Apply, both the data and the order in which it is displayed may change. Therefore, the sample in your table may be different from the sample shown here. This is particularly evident when only a small pool of data is available, which is the case in the schema for this lesson.
- You can optionally add a Table node to the workflow to persist the results. The table contents can then be displayed using any Oracle application or tools, such as Oracle Application Express, Oracle BI Answers, Oracle BI Dashboards, and so on.
-
When you are done viewing the results, dismiss the Apply Model window, and click Save All.