Tuning .NET Applications in Visual Studio with SQL Tuning Advisor and Oracle Performance Analyzer
Overview
Purpose
This tutorial describes how you can use SQL Tuning Advisor to tune ad-hoc SQL statements in Visual Studio. It also shows how you can use Oracle Performance Analyzer to tune your running application's use of the Oracle Database.
Note: Oracle Performance Analyzer is best used with an Oracle Database that has very little activity from other users. Depending on the configuration of your database as well as other activity from other users you may obtain additional findings or different findings from what is shown here.
Time to Complete
Approximately 65 minutes (Note: 60 of these minutes are simply waiting for performance analysis to complete. During that wait you can work on another lesson)
Introduction
SQL Tuning Advisor and Oracle Performance Analyzer are features of Oracle Developer Tools for Visual Studio. SQL Tuning Advisor provides recommendations to improve performance of SQL statements typed into the Oracle Query Window. Oracle Performance Analyzer examines the use of the database over time by a running .NET application and gives recommendations based on the actual workload on the database.
SQL Tuning Advisor requires that the user have the ADVISOR privilege as well as an Oracle Database license for the Oracle Tuning Pack and Oracle Diagnostic Pack.
Oracle Performance Analyzer requires that the user have SYSDBA privileges as well as an Oracle Database license for the Oracle Diagnostic Pack.
Prerequisites
Before starting this tutorial, you should:
-
Install Microsoft Visual Studio 2013.
-
Install Oracle Database 10.2 or later with the HR sample schema. This lesson will assume that the database connect alias is named ‘ORCL’.
-
Install Oracle 12c Oracle Data Access Components (ODAC) with Oracle Developer Tools for Visual Studio version 12.1.0.2 or later from OTN.
-
Extract these files into your working directory.
Setting Up Your Environment
In this section, you will create two data connections for SYS and HR and also add the Advisor privilege to the HR user. Perform the following steps:
-
Open Visual Studio.
-
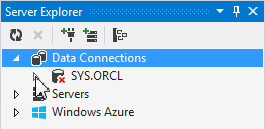
Select View > Server Explorer. The Server Explorer panel opens. If you already have a SYS.ORCL connection, expand it to connect to the database.
Then enter the SYS password and click OK.
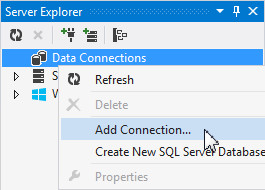
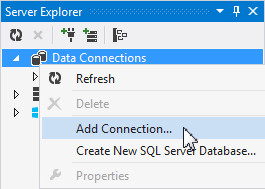
Otherwise, right-click Data Connection and select Add Connection.
-
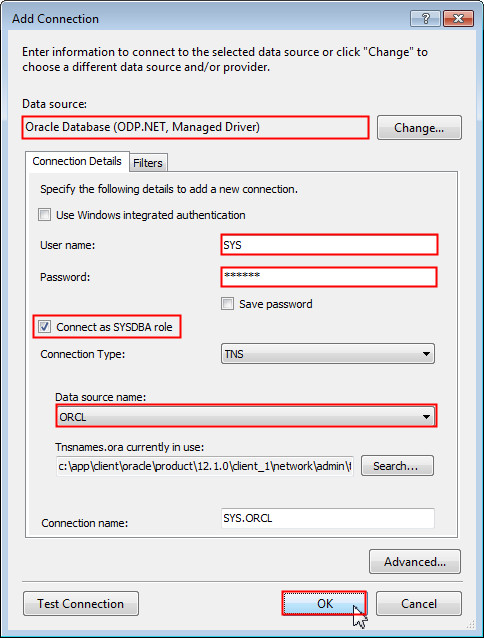
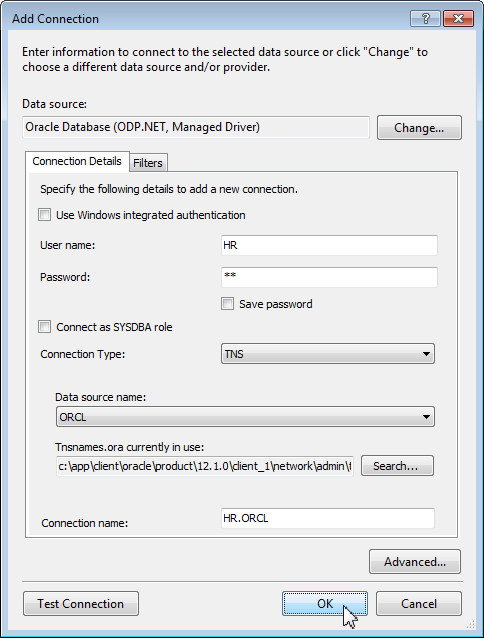
The Add Connection dialog box opens. If Data Source is not already set to Oracle Database (ODP.NET, Managed Driver), click Change to change the Data Source.
Enter sys for User name and provide the SYS password. Select Connect as SYSDBA role and select the Data source name as ORCL. Then click OK.
-
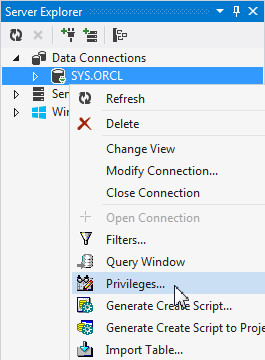
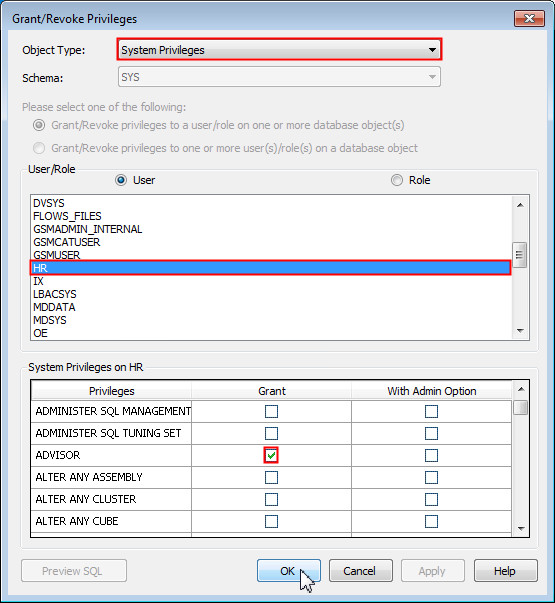
Your SYS.ORCL connection was created successfully. You need to make sure that HR user has the ADVISOR privilege so that you can run the SQL Tuning Advisor as the HR user in the next section of this tutorial. Right-click the SYS.ORCL connection and select Privileges.
-
Make sure that System Privileges is selected for Object Type. Select HR from the list of Users and select the Grant check box for the ADVISOR privilege and click OK.
-
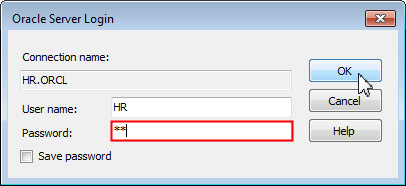
In the Server Explorer panel, if you have already have a HR.ORCL connection, expand it to connect to the database.
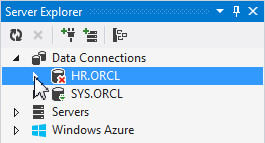
Then enter the HR password and click OK.
Otherwise, right-click Data Connections and select Add Connection.
-
In the Add Connection dialog box, ensure that the Data Source is set to Oracle Database (ODP.NET, Managed Driver). Enter hr for Username and provide the HR password. Select ORCL for Data Source Name and click OK.
Using SQL Tuning Advisor to Tune AdHoc SQL
In this section, you will tune a SQL statement in the Query Window using the SQL Tuning Advisor. Perform the following steps:
-
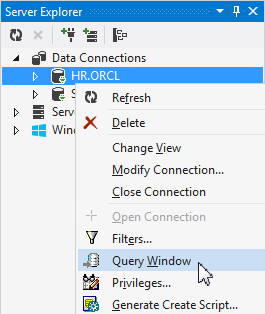
In order to execute SQL, use the Query Window. Right-click the HR.ORCL connection and select Query Window.
-
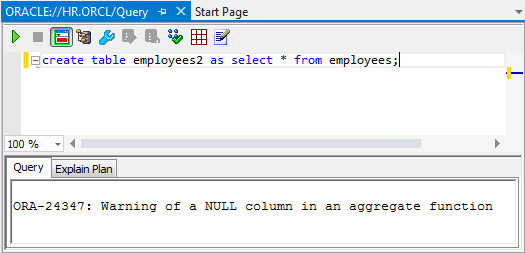
You will create a copy of the EMPLOYEES table. Enter the following SQL statement and click the execute
 icon.
icon.create table employees2 as select * from employees;

-
The table was created successfully. You will receive a warning, as shown in the screnshot, which can be safely ignored.
-
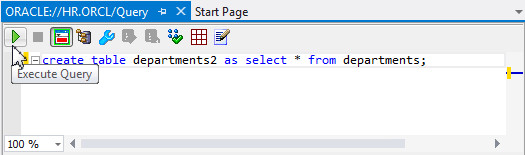
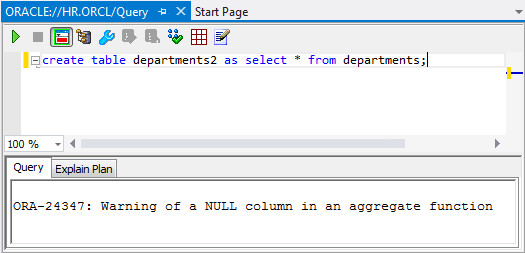
You will create a copy of the DEPARTMENTS table. Enter the following SQL statement and click the execute
icon.create table departments2 as select * from departments;
-
The table was created successfully. You will receive a warning, as shown in the screnshot, which can be safely ignored.
-
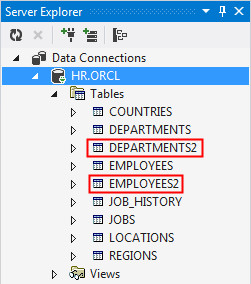
In Server Explorer, expand HR.ORCL > Tables to see the new tables in the list.
-
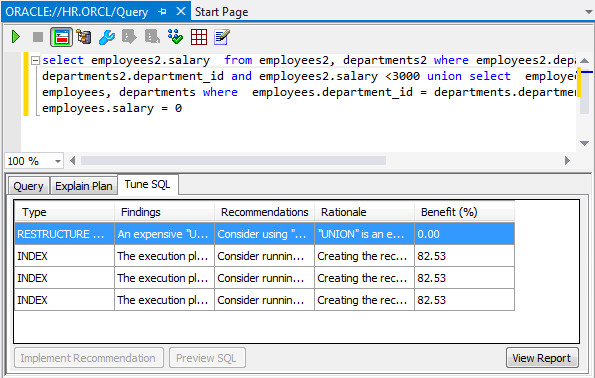
You are now ready to tune some SQL against the EMPLOYEES2 and DEPARTMENTS2 tables. Enter the following query and click the Tune
 icon.
icon.select employees2.salary from employees2, departments2 where employees2.department_id = departments2.department_id and employees2.salary <3000 union select employees.salary from employees, departments where employees.department_id = departments.department_id and employees.salary = 0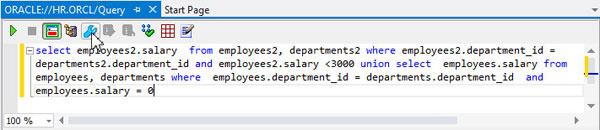
-
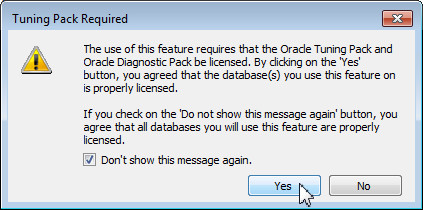
You receive a dialog box asking you if you have a license for the Tuning and Diagnostic Pack. Select the Don't show this message again check box and click Yes.
-
You should get one RESTRUCTURE SQL finding, and three INDEX findings.
-
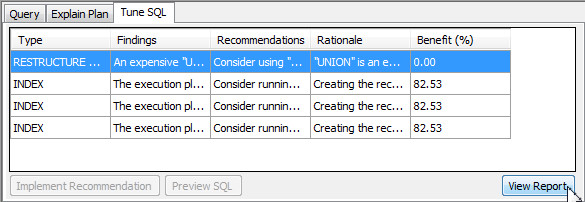
Select RESTRUCTURE SQL in the Tune SQL window and click the View Report button.
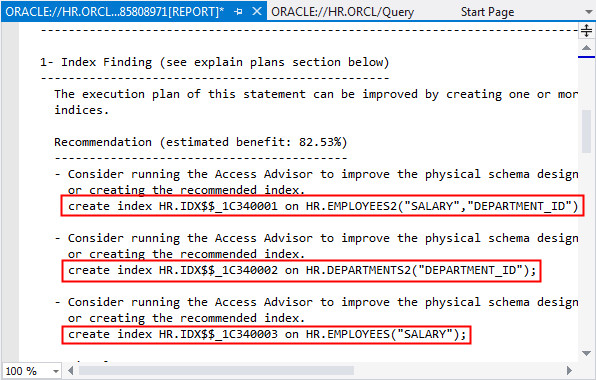
Scroll down in the report and copy the three Create index commands highlighted below.
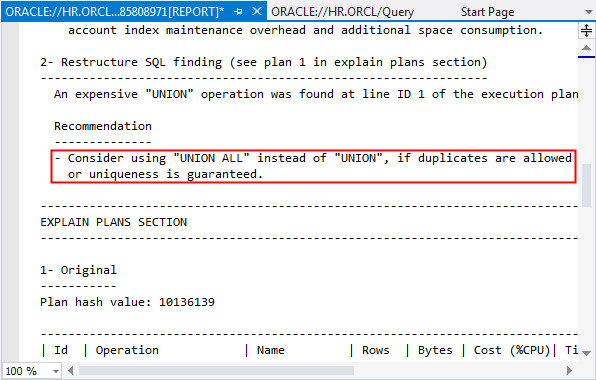
You will choose to ignore the RESTRUCTURE (UNION) recommendation shown below.
-
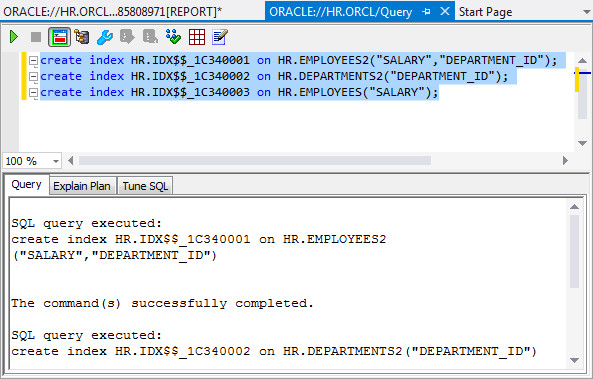
In the Query Window, paste the create index command that you had copied from the report, make sure the three statements are selected, and click the execute
icon.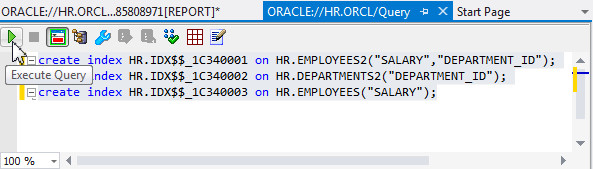
The indexes were created successfully.
-
Enter the same query in the Query Window again, and click the Tune
icon.select employees2.salary from employees2, departments2 where employees2.department_id = departments2.department_id and employees2.salary <3000 union select employees.salary from employees, departments where employees.department_id = departments.department_id and employees.salary = 0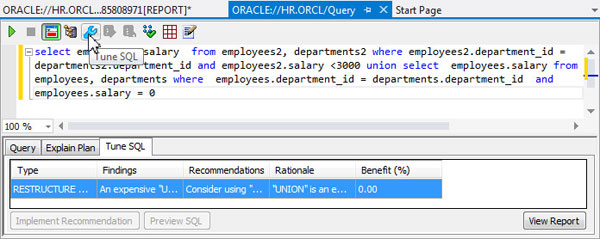
This time the Tuning Advisor did not find any recommedations except the RESTRUCTURE SQL, which you will ignore.
Using Performance Analyzer to Analyze Application Performance
In this section, you will use the Oracle Performance Analyzer to analyze the application and implement recommendations it finds. Perform the following steps:
-
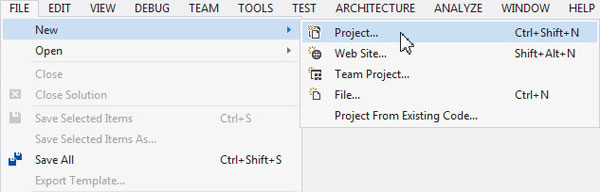
Close all open Query Windows in Visual Studio. Select File > New > Project.
-
Select Visual C#:Windows > Console Application. Rename the project as OraclePerformanceAnalyzer. Click OK.

-
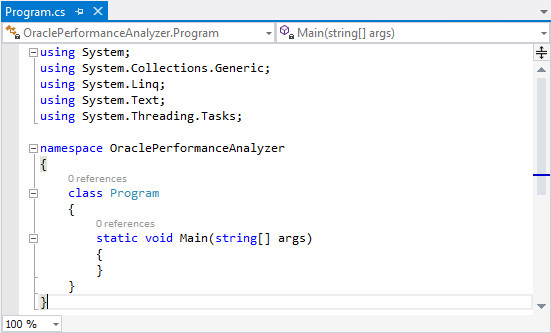
The project OraclePerformanceAnalyzer opens up.
-
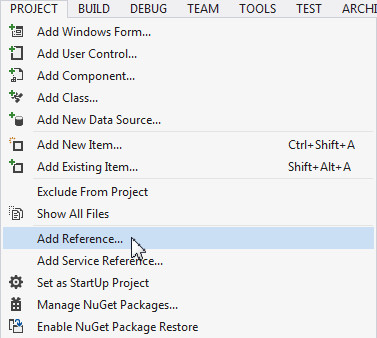
From the Project menu, select Add Reference....
-
Select Extensions menu on the side bar. Scroll down the list of extensions and select Oracle.ManagedDataAccess and click OK.

-
Remove the entire code snippet from the Program.cs window of Visual Studio.
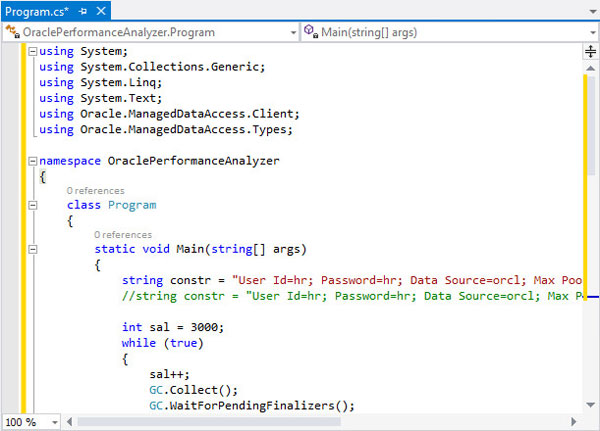
Copy the code in the performance.txt file, present in the working directory, and paste it in the Program.cs window. Modify your connection alias if it is not 'ORCL'.
-
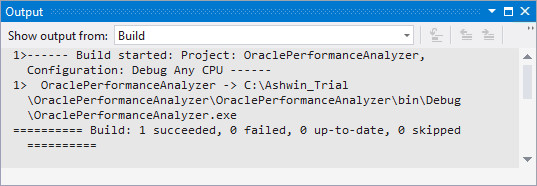
Select Build > Build Solution.
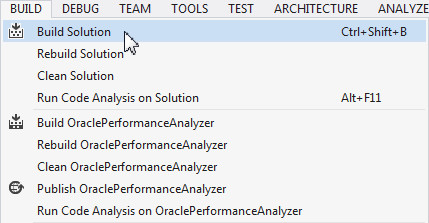
The project is built successfully.
-
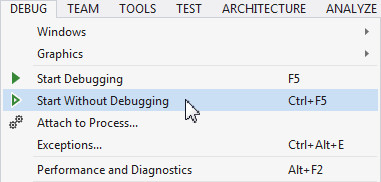
You can now run the application. Select Debug > Start Without Debugging. This runs the application in a tight loop to make it easier to obtain the minimum required 'database time' for a successful analysis ('Database time' is the time that the database spends servicing the application).
-
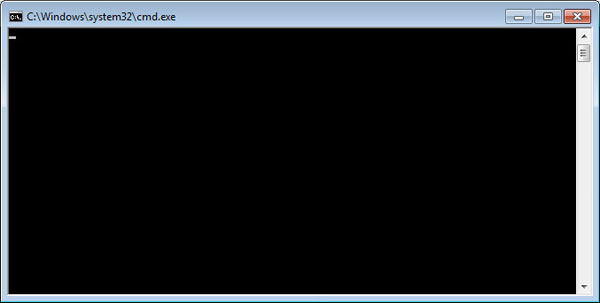
An empty command window appears (the application does not output to the window). If you receive an error, fix the error and run the application again. Leave this window open and switch back to Visual Studio.
-
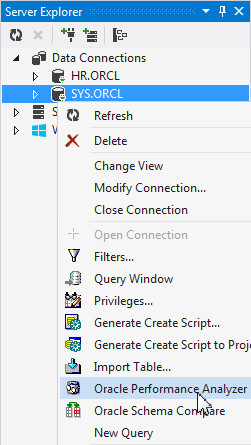
You run Oracle Performance Analyzer as the SYS user. In the Server Explorer, right-click SYS.ORCL connection and select Oracle Performance Analyzer.
The Diagnotic Pack Required dialog box opens. Click Yes.
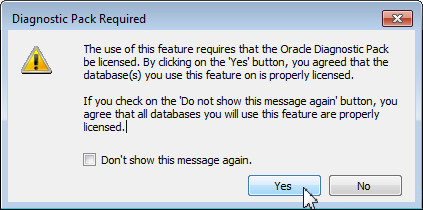
Note: If you are using a Multitenant Container Database, you must run Oracle Performance Analyzer only on the container database. If you run it on a Pluggable Database connection, it will throw an error.
-
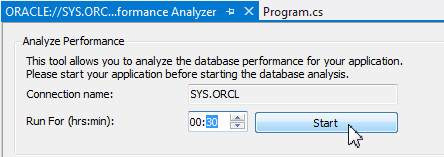
In order to get some recommendations, you need to run the Performance Analyzer for a significant period of time. Change the minutes to 30 and click Start.
-
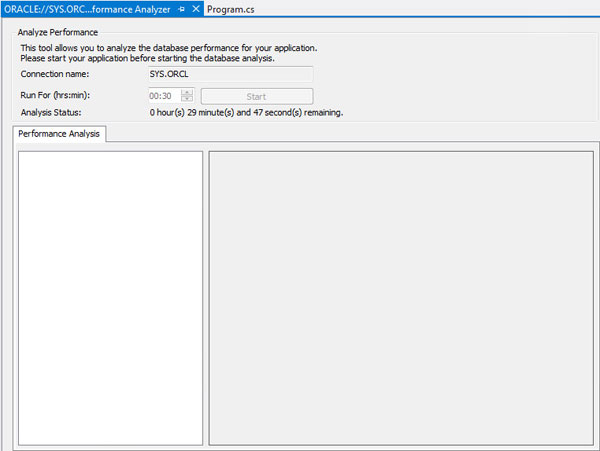
The timer starts. (While waiting for the timer to count down, you can work on another lesson)
-
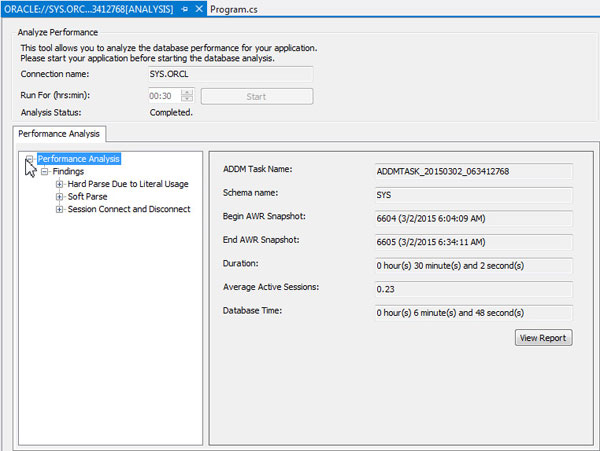
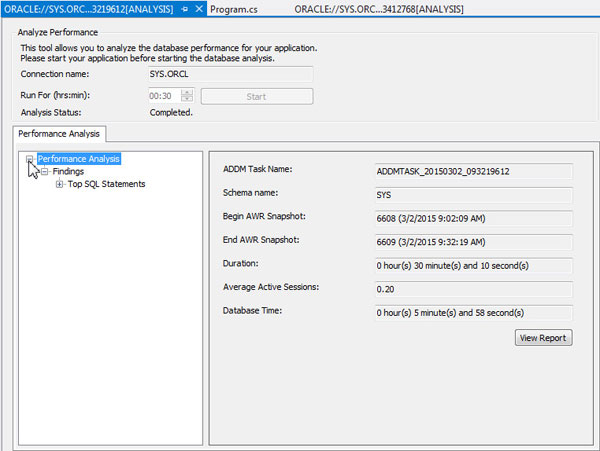
When the time is up the results are displayed. Expand Performance Analysis to view the Findings. You receive three findings: Hard Parse Due to Literal Usage, Soft Parse, and Session Connect and Disconnect.
-
Finding #1 Hard Parse Due to Literal Usage: Investigate application logic for possible use of bind variables instead of literals. The code highlighted in the screenshot is appending a literal value to the end of the WHERE clause causing Oracle Database to have to do a hard parse for every statement. The best practice is to use a bind variable.
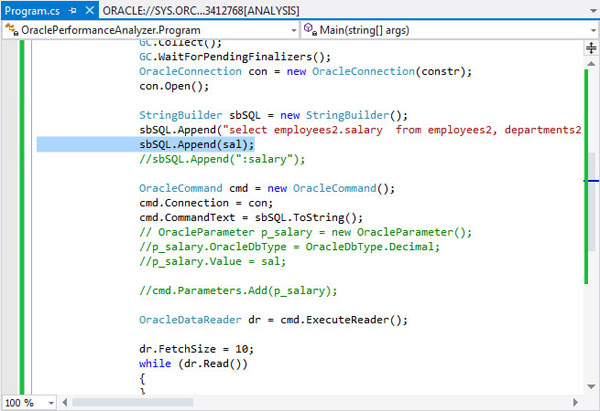
This can be corrected by commenting out the following line in the code:
sbSQL.Append(sal);
And by uncommenting the following lines://sbSQL.Append(":salary"); // OracleParameter p_salary = new OracleParameter(); //p_salary.OracleDbType = OracleDbType.Decimal; //p_salary.Value = sal; //cmd.Parameters.Add(p_salary);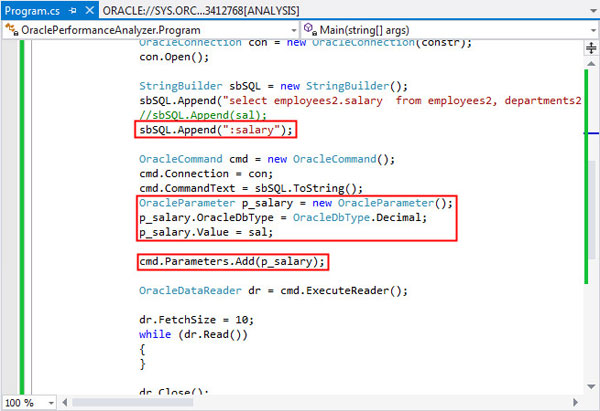
-
Finding #3 Session Connect and Disconnect: Investigate application logic for possible reduction of connect and disconnect calls. For example, you might use a connection pool scheme in the middle tier. The code highlighted in the screenshot forces the connection pool to destroy and recreate connections every second, effectively eliminating the benefit of a connection pool.
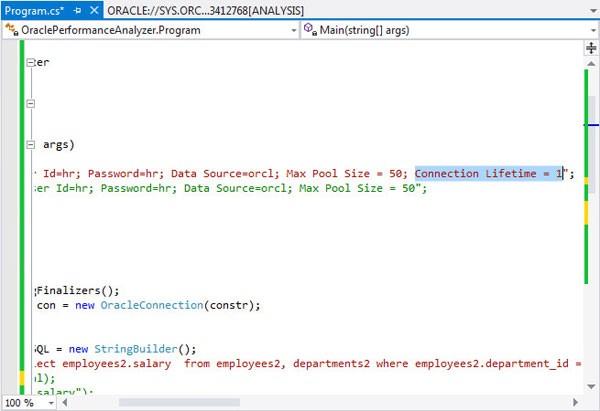
This can be corrected by commenting out the following line in the code:
string constr = "User Id=hr; Password=hr; Data Source=orcl; Max Pool Size = 50; Connection Lifetime = 1";
And by uncommenting the following lines:
//string constr = "User Id=hr; Password=hr; Data Source=orcl; Max Pool Size = 50";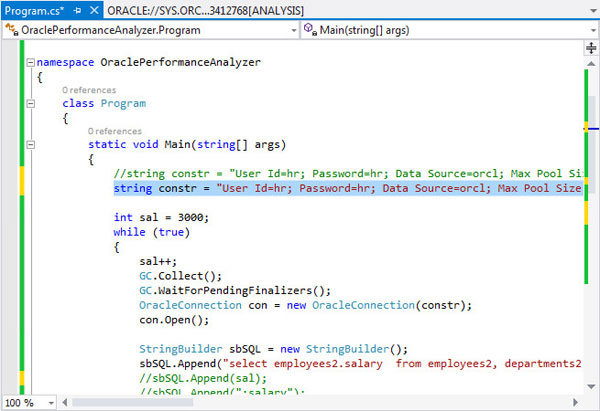
-
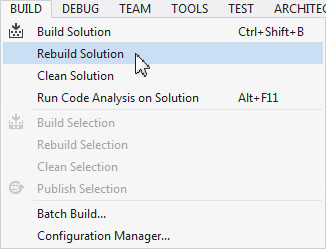
After making these corrections, you rebuild the solution, and run the Oracle Performance Analyzer again for 30 minutes. Select Build > Rebuild Solution. Repeat steps 8 to 12.
-
When the time is up, expand Performance Analysis to view the Findings. You will receive just one finding: Top SQL Statements. This finding is insignificant and can be ignored.
-
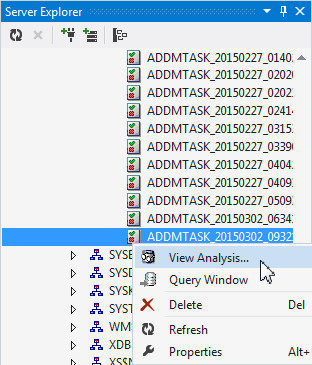
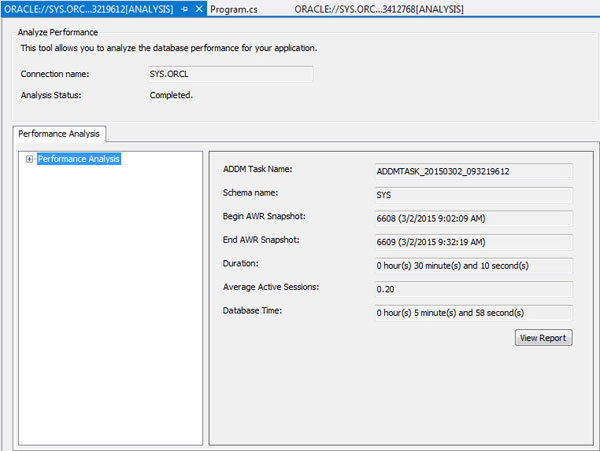
The Performance Analyzer results are stored in the database as ADDM Tasks. From the Server Explorer window, expand SYS.ORCL > Schemas > SYS > ADDM Tasks. Select the ADDM task that was most recently created (at the bottom of the list). You can view the analysis you were just viewing by right-clicking the ADDM Task and select View Analysis.
The Diagnotic Pack Required dialog box opens. Click Yes.
The analysis is displayed again.
Summary
In this tutorial, you have learned how to:
- Use SQL Tuning Advisor to tune adhoc SQL
- Use Performance Analyzer to analyze application performance
Resources
- You may visit the Oracle Technology Network Portal to find out the latest developments in Oracle and .NET.
- To learn more about Oracle, .NET, and Visual Studio refer to additional OBEs in the Oracle Learning Library.
Credits
- Lead Curriculum Developer: Ashwin Agarwal
- Other Contributors: Christian Shay, Alex Keh
To navigate this Oracle by Example tutorial, note the following:
- Topic List:
- Click a topic to navigate to that section.
- Expand All Topics:
- Click the button to show or hide the details for the sections. By default, all topics are collapsed.
- Hide All Images:
- Click the button to show or hide the screenshots. By default, all images are displayed.
- Print:
- Click the button to print the content. The content that is currently displayed or hidden is printed.
To navigate to a particular section in this tutorial, select the topic from the list.