Graph Usage Guideline 

RCUX Document Version 5.0.1 for Oracle® Fusion Middleware 11g Release 1 Patch Set 1 (11.1.1.2.0)
Last Updated 03-Nov-2010
Graphs display numeric and categorical information visually, facilitating rapid understanding of data and their relationships. Common graph types include Bar, Line, Area, and Pie graphs.
- General Principles
- Accessibility
- Types of Graphs
- Primary Graph Types
- Secondary Graph Types
- Scatter Graph
- Bubble Graph
- Spark Chart
- Stock Graph
- Funnel Graph
- Radar Graph
- Polar Graph
- Pareto Graph
- Dual Y-Axis Graphs
- Graph Heuristics
- Configurable Elements
- Alerts and Annotations
- Axes
- Data Labels
- Data Tips
- Legend
- Reference Markers
- Title, Subtitle, and Footnote
- Common Actions
Related Guidelines
| Guideline | Section | For Information About |
|---|---|---|
| Common Formats | All | Label formatting for different data types |
| Language in UI | Capitalization | Graph label capitalization |
| Table Information Design | All | Displaying data using Tables |
| Table Interaction Methods | Links in Tables | Drilling to detail in Tables |
| Gauge | All | Displaying data using Gauges |
Related ADF Elements
Refer to the ADF Faces Rich Client demos page to find demos and tag documentation for the ADF elements related to this component:
| ADF Element | Notes |
|---|---|
| dvt:barGraph | Vertical Bar graph |
| dvt:horizontalBarGraph | Horizontal bar graph |
| dvt:lineGraph | Line graph |
| dvt:areaGraph | Area graph |
| dvt:pieGraph | Pie graph |
| dvt:comboGraph | Combination graph |
| dvt:bubbleGraph | Bubble graph |
| dvt:funnelGraph | Funnel graph |
| dvt:paretoGraph | Pareto graph |
| dvt:radarGraph | Radar graph |
| dvt:scatterGraph | Scatter graph |
| dvt:stockGraph | Stock graph |
| dvt:graph | Advanced Graph |
| dvt:timeSelector | Time Filter |
| dvt:alertSet | Alerts |
| dvt:annotationSet | Annotations |
| dvt:referenceObject | Reference Markers |
General Principles

Graphs display numeric information visually, making it easier to understand large quantities of data. Graphs often reveal patterns and trends that text-based displays cannot; however, when precise values are needed, graphs should be supplemented with other data displays, such as tables.
Accessibility
In Screen Reader Mode, graph data will automatically appear in a tabular format.
When not in Screen Reader Mode, each graph on a page should show a link above the graph that enables the user to switch between the graph and a tabular format. The link should be labeled "Show Table" when the graph is displayed and "Show Graph" when the table is displayed.
Colorblind Users
By default, graphs are not accessible for users who are colorblind.
To accommodate users who are colorblind, teams have a few options:
- Define an accessible color palette for graph data. The colors specified will be used to render the bars, lines, pie slices, and so on in a graph.
- Configure the graph to display in PNG format and, using the Graph API, configure the graph to display patterns instead of colors. This technique works only for Bar graphs, Pie graphs, and Area graphs.
- For Line graphs, teams can use a combination of line markers, line weights, and line styles to represent different data sets independent of color.
- For Scatter graphs, use different marker shapes to represent different data sets independent of color.
Types of Graphs
Primary Graph Types
For most graphing needs, the primary graph types listed below will provide the best means to represent data. It is recommended to use the following five graph types whenever possible.
Bar Graphs
Description:
Bar graphs show quantities associated with categories. Bar graphs show quantities as bar lengths and categories as bars or groups of bars.
Usage:
Use a Bar graph to compare values among categories.
- Bar graphs are most effective when values vary widely or are close to zero. When showing similar values that are much larger or smaller than zero, bar lengths will tend to look the same. In this case, use a Line Graph instead.
- When the vertical or horizontal axis represents a quantity, include zero on the corresponding axis scale.
Table of Bar Graph Types
| Thumbnail | Graph Type | Description | Uses | |
|---|---|---|---|---|
| Vertical | Horizontal | |||
 |
 |
Bar Graph | Compares values among categories. Bar lengths are proportional to data values. |
Use to compare values among categories. Use a Horizontal Bar graph when category labels are long or when the display area is short and wide. |
 |
 |
Stacked Bar Graph | Compares totals among categories. Bar segment lengths are proportional to data values. Bar segments stack, adding up to a total for each group. |
Use to compare totals among categories. Each cluster of bars usually represents a hierarchical grouping of the bar categories. |
 |
 |
Percentage Stacked Bar Graph | Compares percentages of totals among categories. Bar segments always add up to 100%. |
Use to compare contributions to a total among categories. When space is limited, this graph is a good alternative to Multiple Pie and Multiple Ring graphs. |
 |
N/A | Floating Stacked Bar Graph | Compares minimum and maximum values and totals among categories. Bars may have both a minimum and a maximum value. |
Use to compare minimum and maximum values among categories. |
Line Graphs
Description:
Line graphs show quantities over time or by category. Exact data values may be marked with a symbol.
Usage:
Use a Line graph to show trends over time.
- Because of visual similarity between the regular Line graph and other types of Line graphs, it is recommended to use a Stacked Area Graph instead of a Stacked Line Graph, and a Percentage Stacked Area Graph instead of a Percentage Stacked Line graph.
- The vertical axis should contain evenly distributed quantities.
- The horizontal axis should contain evenly distributed sequential values, such as time periods or ordered categories.
- Quantities may have values that are much larger or smaller than zero, and may be both positive and negative.
- Use data value markers if there are few categories and if indicating precise data values is important.
- Include zero on the vertical axis scale.
Table of Line Graph Types
| Thumbnail | Graph Type | Description | Uses |
|---|---|---|---|
 |
Line Graph | Shows trends over time or by category. Each point along the line reflects the data value. |
Use to show trends over time or by category. |
 |
Stacked Line Graph | Shows the trend of the contribution of each value over time or by category. Data values for each line are added up such that the top line represents the total value for each time period or category. |
Not recommended: Because of its visual similarity with the regular Line graph, users may misinterpret data values. Use a Stacked Area Graph instead. |
 |
Percentage Stacked Line Graph | Shows the trend of the percentage each value contributes over time or by category. Data values for each line are expressed as a percentage of the total for each category. Values are added up such that the top line represents 100% of the value for each time period or category. |
Not recommended: Because of its visual similarity with the regular Line graph, users may misinterpret data values. Use a Percentage Stacked Area Graph instead. |
Area Graphs
Description:
An Area graph shows quantities over time or by category. An Area graph is a Line graph for which the regions below or between lines is filled in.
Usage:
Use an Area graph to show the magnitude change over time or to highlight a total value over time.
- Because regions can overlap and cause data to be hidden, it is recommended to use a regular Line Graph instead of a regular Area graph.
- The vertical axis should contain evenly distributed quantities.
- The horizontal axis should contain evenly distributed sequential values, such as time periods or ordered categories.
- Quantities may have values that are much larger or smaller than zero, and may be both positive and negative.
- Include zero on the vertical axis scale.
Table of Area Graph Types
| Thumbnail | Graph Type | Description | Uses |
|---|---|---|---|
 |
Area Graph | Shows the trend of values over time or by category. A Line graph for which the region under each line is filled in. |
Not recommended: Because regions can overlap, some data values may not be visible. Use a Line Graph instead. |
 |
Stacked Area Graph | Shows the trend of the contribution of each value over time or by category. A Line graph for which the regions between lines is filled in. Regions stack, adding up to the total value for each time period or category. |
Use this graph instead of a Stacked Line Graph. |
 |
Percentage Stacked Area Graph | Shows the trend of the percentage that each value contributes over time or by category. A Line graph for which the regions between lines is filled in. Data values are expressed as a percentage. Regions stack, adding up to 100% of the total value for each time period or category. |
Use this graph instead of a Percentage Stacked Line Graph. |
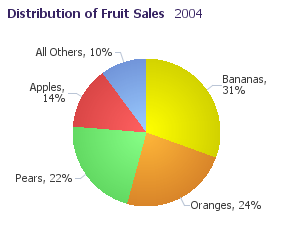
Pie Graphs
Description:
A Pie graph represents a total quantity for a set of categories. The pie is made up of slices, each of which represents a category. The the area of each slice represents each category's value as a percentage of the total.
Usage:
Pie graphs are recommended over other percentage graphs for indicating that the quantities displayed are percentages, because the circular shape of a Pie graph indicates a complete or total quantity; thus, the slices are naturally interpreted as percentages of the total. For this reason, however, the values displayed in a Pie graph must add up to 100%.
- Pie graphs are effective for making relative comparisons between percentages, such as identifying the categories with the largest and smallest percentage.
- Pie graphs are not effective for making accurate comparisons between percentages, such as determining precisely how much larger one percentage is than another.
- When a Pie graph has many slices, it is recommended to display the largest eight to ten slices individually, and to combine the remaining slices into a single slice labeled "Other".
- Exploding slices is not advised because this makes it more difficult to judge the relative sizes of slices.
Table of Pie Graph Types
| Thumbnail | Graph Type | Description | Uses |
|---|---|---|---|
 |
Pie Graph | Shows the contribution of each value to a total. Slice sizes are proportional to data values. |
Consider a Pie graph when:
|
 |
Multi-Pie Graph | Shows contributions to totals across multiple categories. Each pie represents a different category. | Consider a Multiple Pie graph when space permits and there are six or fewer categories. If there are more than six categories, consider a Percentage Stacked Bar Graph instead. |
 |
Pie-Bar Graph | Shows the contribution of each value to a total with a vertical stacked bar that breaks out the contribution of values to the total value of one slice. | Consider a Pie-Bar graph when users need to see the composition of a particular pie slice. |
 |
Ring Graph | Shows the contribution of each value to a total. Ring segment sizes are proportional to data values. The center of the ring shows the total value. |
Consider a Ring graph when the total value needs to be visible. |
 |
Multi-Ring Graph | Shows contributions to totals across multiple categories. Each ring represents a different category. | Consider a Multiple Ring graph when space permits, there are six or fewer categories, and the total value needs to be visible. If there are more than six categories, consider a Percentage Stacked Bar Graph instead. |
 |
Ring-Bar Graph | Shows the contribution of each value to a total with a vertical stacked bar that breaks out the contribution of values to the total value of one ring segment. | Consider a Ring-Bar graph when users need to see the composition of a particular ring segment and the total value needs to be visible. |
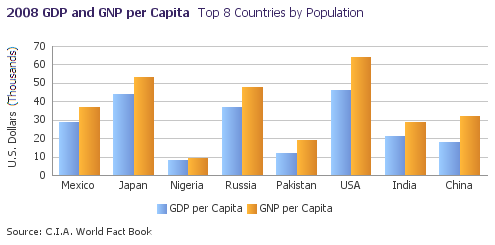
Combination Graphs
Description:
A Combination graph shows quantities over time or by category in a single plot, using any combination of Bar, Line, and Area graphs. Combination graphs are often displayed as Dual-Y graphs.
Usage:
Combination graphs are useful for highlighting relationships between different sets of data that have different value scales, such as product prices (in dollars) and product volume (in units).
- If the graph includes an Area graph, ensure that the Area graph appears beneath other graph types.
- If the graph includes a Line graph, ensure that the Line graph appears on top of other graph types.
- It is not recommended to show more than two types of graphs in a Combination graph. Doing so may make the graph difficult to understand.
| Thumbnail | Graph Type | Description | Uses |
|---|---|---|---|
 |
Combination Graph | Displays any combination of Bar, Line, and Area graphs in a single plot. | Consider a Combination graph when you want to highlight the relationship between two sets of data that have different value scales. |
Secondary Graph Types
The following are less common, special-use graphs that are associated with particular data types or analyses.
- Scatter Graph
- Bubble Graph
- Spark Chart
- Stock Graphs
- Funnel Graph
- Radar Graph
- Polar Graph
- Pareto Graph
Do not use a secondary graph type when the data can be effectively represented using a primary graph type.
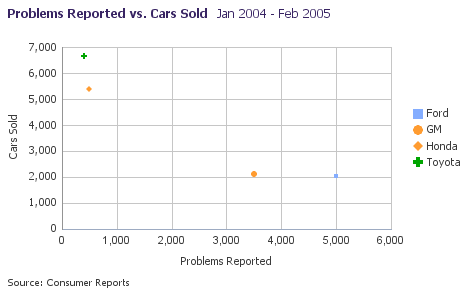
Scatter Graph
Description:
A Scatter graph plots two sets of quantitative data against each other. Plotted points may use colors or symbols to show an additional categorical data set.
Usage:
- Do not show gridlines unless users need to know precisely where data points are plotted. If gridlines are needed, show both vertical and horizontal gridlines.
- Include zero on all axis scales.
- Data values may be positive or negative.
- If there are more than four categories in the categorical data set, consider splitting them up into groups of four and using a separate Scatter graph for each group. Too many categories will make the graph unreadable.
| Thumbnail | Graph Type | Description | Uses |
|---|---|---|---|
 |
Scatter Graph | Shows relationships between two sets of quantitative data. Colors or symbols represent an additional categorical data set. |
Use to explore the correlation between two sets of quantitative data. Use colors or symbols to compare how categories correlate across the plotted data. |
Bubble Graph
Description:
A Bubble graph plots three sets of quantitative data against each other. Bubbles may be colored to show an additional categorical data set.
Usage:
- Do not show gridlines unless users need to know precisely where data points are plotted. If gridlines are needed, show both vertical and horizontal gridlines.
- Include zero on all axis scales.
- Data values may be positive or negative.
- If there are more than four categories in the categorical data set, consider splitting them up into groups of four and using a separate Bubble graph for each group. Too many categories will make the graph unreadable.
| Thumbnail | Graph Type | Description | Uses |
|---|---|---|---|
 |
Bubble Graph | Shows relationships between three sets of quantitative data using bubble positions and size. Bubble color represents an additional categorical data set. |
Use to explore the correlation between three sets of quantitative data. Use bubble color to compare how categories correlate across the plotted data. |
Spark Chart
Description:
A Spark Chart is a tiny graph ideal for display in table cells or in a form layout to present data in a simple, condensed format.
- There are four kinds of Spark Charts:
- Line
- Bar
- Floating Bar
- Area
- A Spark Chart can display a single set of data only.
- Unlike other graph types, Spark Charts have no legend, title, subtitle, footnote, data tips, or data labels. Spark Charts may not include alerts or annotations.
- Teams can customize chart size, bar, line, and area colors, and background color.
| Thumbnail | Spark Chart Type | Description | Uses |
|---|---|---|---|
 |
Line Spark Chart | Same as Line Graph. | Same as Line Graph. |
 |
Bar Spark Chart | Same as Vertical Bar Graph. | Same as Vertical Bar Graph. |
 |
Floating Bar Spark Chart | Same as Floating Bar Graph. | Same as Floating Bar Graph. |
 |
Area Spark Chart | Same as Floating Stacked Bar Graph except that bars do not stack, totals may not be compared. | Same as Floating Stacked Bar Graph. |
Usage:
- Spark charts are recommended when displaying trend data and related information in a tabular format. For example, a tabular display of stock information might include a column showing a spark chart line graph of recent stock prices.
- Spark charts can be displayed in a dashboard to provide additional context to a data-dense display.
- Because it has no title or legend of its own, a spark chart must be accompanied by a descriptive label. When displayed in a table column, the column header label should describe the spark chart.
- Spark charts are typically displayed in multiples so as to maximize the use of space on the page.
- Teams can make spark charts clickable so that users can access additional information, such a through a secondary window.
- Teams can provide additional information in a tooltip.
Stock Graphs
Description:
A Stock graph shows stock prices over time. Two to four different prices for each stock may be displayed for each time period. Candle Stock graphs use color to indicate the direction of price changes.
Each type of Stock graph may also show the number of shares traded (i.e., Volume) for each time period. In this case, the graph uses a Split Dual-Y Axis layout, with volume data on the bottom.
Stock graphs have their own default color palette.
Usage:
- Display data at a level of detail that will not overwhelm users. For example, when showing stock prices for an entire year, show prices at the monthly level rather than at the weekly or daily level. Alternatively, enable users to choose the level of detail (days, weeks, months, etc.) shown in the graph.
- If users want to see many stock prices at a high level of detail, enable Axis Zooming for the time axis.
- When users need to see a single stock price per time period (such as the closing price), use a Line Graph instead.
Table of Stock Graphs
| Thumbnail | Graph Type | Description | Uses | |
|---|---|---|---|---|
| Standard | With Volume | |||
 |
 |
High-Low-Close Stock Graph High-Low-Close Stock with Volume Graph |
Floating bars indicate range between high and low prices. A horizontal line indicates the closing price. Vertical bars show volume. |
Use to show high, low, and closing stock prices over time. |
 |
 |
Open-High-Low-Close Stock Graph Open-High-Low-Close Stock with Volume Graph |
Floating bars indicate range between high and low prices. Horizontal lines indicate the opening and closing prices. Vertical bars show volume. |
Use to show opening, high, low, and closing stock prices over time. |
 |
 |
Open-Close Candle Stock Graph Open-Close Candle Stock with Volume Graph |
Floating bars indicate range between opening and closing prices. Bar color indicates if the price has risen (green) or fallen (red). Vertical bars show volume. |
Use to highlight the direction of price change between opening and closing stock prices. |
 |
 |
Open-High-Low-Close Candle Stock Graph Open-High-Low-Close Candle Stock with Volume Graph |
Floating bars indicate range between opening and closing prices. Vertical lines indicate high and low prices. Bar color indicates if the price has risen (green) or fallen (red) between open and close. Vertical bars show volume. |
Use to highlight the direction of price change between opening and closing stock prices. |
Funnel Graph
Description:
A Funnel graph shows the progress of individual steps in a process. Each slice of the funnel represents a step, and as a step is completed, its slice fills. The Funnel graph is similar to a Percentage Stacked Bar Chart.
The Funnel graph has its own default color palette.
Usage:
- Slice heights may be difficult to compare accurately because they are not vertically aligned.
- By default, slices are colored as follows:
- Red, when the completion percentage is 0% - 40%
- Yellow, when the completion percentage between 40% and 70%
- Green, when the completion percentage is above 70%.
| Thumbnail | Graph Type | Description | Uses |
|---|---|---|---|
 |
Funnel Graph | Each slice represents a step in a process that progresses from left-to-right. The color of a slice and the amount it is filled represent the completion percentage of the step. | Consider this graph when showing the progress of individual steps in a process. The Percentage Stacked Bar Chart is an alternative. |
Radar Graph
Description:
A Radar graph is the equivalent of a Line Graph whose horizontal axis is wrapped, forming a polygonal plot area.
Usage:
Same as Line Graph.
| Thumbnail | Graph Type | Description | Uses |
|---|---|---|---|
 |
Radar Graph | Shows trends over time or by category. Each vertex in the plot area represents a different category. | Use to show cyclical trends over time or by category. |
Polar Graph
Description:
A Polar graph shows how data are distributed in a circular space. For example, a Polar graph can show how light radiates from a lamp at each of the 360 degrees around it.
A polar graph is the equivalent of a Scatter Graph whose horizontal axis is wrapped, forming a circular plot area.
Usage:
Same as Scatter Graph.
| Thumbnail | Graph Type | Description | Uses |
|---|---|---|---|
 |
Polar Graph | Shows relationships between two sets of quantitative data. Colors or symbols represent an additional categorical data set. |
Use to show how quantitative data are distributed in a circular space. Consider this graph type when the horizontal axis represents the full 360 degrees of a circle. Otherwise, use a Scatter Graph instead. |
Pareto Graph
Description:
A Pareto graph is a Dual Y-Axis Combination Graph that shows the relative contributions of parts to a total. For example, a Pareto graph can show which products contribute the most to total sales.
Usage:
- Data must represent all of the individual parts of a total. The graph will mislead users if some parts of the total are missing.
- The Y2 axis range should always be 0%-100%.
| Thumbnail | Graph Type | Description | Uses |
|---|---|---|---|
 |
Pareto Graph | Each bar represents a part of the whole, and bars appear in descending order. The line shows the cumulative percentage of the parts. |
Use to show the largest contributors to a total, for example, to identify which products contribute the most to total sales. |
Dual Y-Axis Graphs
Purpose:
Dual Y-Axis graphs have two distinct y-axes, each with a distinct scale. This technique enables a single graph to show two sets of of data with different units or scales.
There are two types of Dual Y-Axis graphs: Standard Dual-Y Axis Graphs and Split Dual-Y Axis Graphs.
Standard Dual Y-Axis Graphs
Description:
A Standard Dual Y-Axis graph has two Y-axes, each with its own data and range of values. Data for the two Y-axes are plotted together, in the same plot area.
- Both vertical and horizontal graphs may have Standard Dual-Y Axes. According to convention, the axis on the top or on the left is the Y1 axis, and the axis at the bottom or on the right is the Y2 axis.
The following graph types may be displayed as Standard Dual Y-Axis graphs:
- Bar Graph (vertical or horizontal)
- Stacked Bar Graph (vertical or horizontal)
- Line Graph
- Stacked Line Graph
- Scatter Graph
- Bubble Graph
- Combination Graph
- Pareto Graph (the Pareto Graph is always a Standard Dual-Y Axis graph)
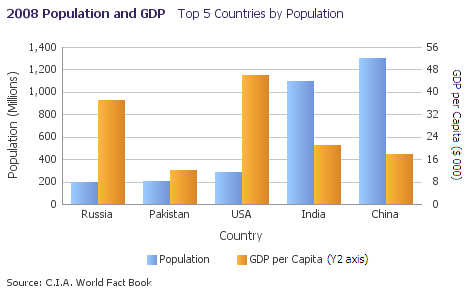
Dual-Y Vertical Bar Graph
Usage:
- Consider using a Dual-Y Axis only for tasks that require comparing data sets with different units or scales.
- Show labels and titles for all graph axes to minimize confusion about which data set belongs with which axis.
- In the legend, indicate that a data set uses the Y2 axis by adding text in parentheses to its legend label as follows: "Unit Sales (Y2 axis)".
Split Dual-Y Axis Graphs
Description:
A Split Dual Y-Axis graph plots two Y-axes in two separate plot areas, one above the other. This type of layout is recommended when plotting two different sets of together but sharing a single plot area would clutter the graph.
The following graph types may be displayed as a Split Dual Y-Axis graph:
- Bar Graph (vertical or horizontal)
- Stacked Bar Graph (vertical or horizontal)
- Area Graph
- Stacked Area Graph
- Stock Graphs with Volume (Stock Graphs with Volume are always Split Dual-Y Axis graphs)
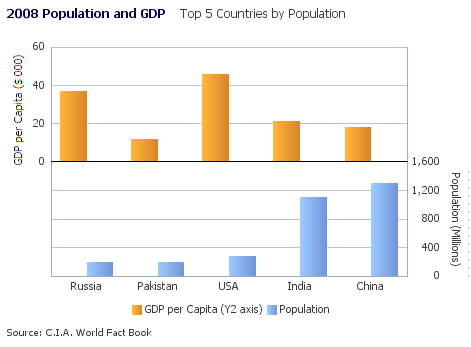
Dual-Y Vertical Bar Graph
Usage:
- The Split Dual-Y Axis format is a good alternative for Bar Graphs or Area graphs that would be difficult to read in the Standard Dual-Y Axis form.
- Consider using a Dual-Y Axis only for tasks that require comparing data sets with different units or scales.
- Give Dual-Y Axis graphs extra vertical space—otherwise the Y axis labels may truncate, making them difficult to read.
- Show labels and titles for all graph axes to minimize confusion about which data set belongs with which axis.
- In the legend, indicate that a data set uses the Y2 axis by adding text in parentheses to its legend label as follows: "Unit Sales (Y2 axis)".
Graph Heuristics
Types of Data
There are two general types of data: Categorical data and Quantitative data.
| Data Type | Data Values | Examples | Usage in Graphs | |
|---|---|---|---|---|
| Categorical | Textual names (with no inherent order) | products, geographic regions, customers | bars, bar segments, pie slices, colors | |
| Quantitative | Non-sequential | Numeric quantities, possibly with duplicate values | prices, number of items sold | bar heights, pie areas, 2D positions, bubble sizes |
| Aggregate | Ranges of numeric quantities | price ranges, percentiles | bars, pie slices, colors | |
| Temporal | Units of time | years, months, weeks, seconds | horizontal axis | |
Types of Data
Categorical Data
Categorical data are names of groups of things. Groups may be nested to form hierarchies. In a graph, categorical data are typically shown using a different bar, pie slice, or color for each category.
Quantitative Data
There are three types of quantitative data: non-sequential, aggregate, and temporal:
- Quantitative data that are the results of counts or measurements are considered "non-sequential" because they may include duplicate values. Non-sequential data are plotted as the heights of bars in Bar graphs, the size of slices in Pie graphs, the positions of markers and bubbles in Scatter graphs and Bubble graphs (respectively), and as color values in Scatter graphs and Bubble graphs.
- In contrast, aggregate and temporal data are sequential, do not have duplicate values, and are typically used to mark the scales of graph axes. Aggregate data is formed when quantitative data are aggregated into uniformly-sized bins or ranges on a sequential scale, such as when salary data are aggregated into salary ranges. Although aggregate data are quantitative, aggregated bins or ranges may also be considered a form of category or group. Aggregate data may be shown using different bars or pie slices for each aggregate bin or range.
- Temporal data are uniformly-spaced units of time such as years, weeks, and seconds. According to convention, temporal dimensions should be plotted on a graph's horizontal axis.
Graph Size
Description:
The size of a graph is one of the most common sources of usability issues. If the graph is too small, users can not easily discern the information being presented or may misunderstand what they see. If the graph is too large, screen real estate is wasted, the user may have a hard time seeing overall patterns because they have to visually scan a large area, and the graph may either push other content out of view or not be fully visible on the page.
Usage:
Whether a graph is too large or too small can depend on its content. Whereas a bar chart with three bars is easy to understand when it is small, a chart with a hundred bars is not. If the amount of content is not known at design time, give the graph extra space. Small graphs should not be used in situations where the amount of content is unpredictable.
- A graph should be large enough to display its content clearly and effectively.
- A graph should never be so tall or wide that the user must scroll the page to see its content.
- If a single graph cannot display its content effectively, split the content into two or more separate graphs.
- In general it is recommended to set the width of a graph to 100% of its enclosing container. This way if users with large monitors widen the browser window, the graph can automatically grow and/or shift legend placement to take advantage of the extra width. Product teams should also set a minimum width to ensure that the graph remains readable when its enclosing container becomes small.
- When setting the height of a graph, it is important to inspect it at runtime using actual labels, titles, and data and adjust the height if the graph looks cramped or contains excess white space.
- When designing graphs, use realistic labels and titles. If the graph is too small, the graph may clip words ("North America" might become "Nort…") or change the orientation of X-axis labels to vertical. Test graphs using labels 100% longer than normal to ensure the graph accounts for translation.
Small Graphs
To improve the readability of a small graph, it is recommended to:
- Show less content, or less-detailed content than in a large graph.
- Avoid pie graphs - use bars instead to express percentages.
- If you must use pie graphs, suppress pie graph labels and rely on a legend instead. Be sure to test using realistic label names, since they could become clipped.
- Instead of the graph's own title and subtitle elements, use a label placed above the graph for its title and subtitle.
- Use the graph subtitle instead of Y-axis titles to display units of measure.
- Reduce the title and subtitle font size, but make it no smaller than 8 pt. size.
- Do not use 3-D effects.
The following example shows two Bar graphs with identical dimensions. The second example makes better use of the space by moving the legend, removing unnecessary labels, using a smaller title font, and turning off 3-D effects.
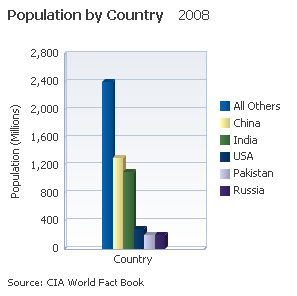
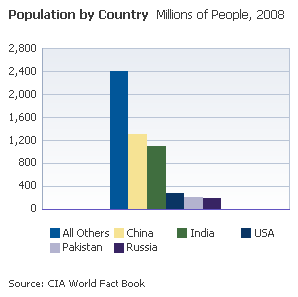
Two Small Graphs with Different Layouts and Settings
Large Graphs
Sometimes, a graph needs to convey data for many time periods or for many items (for example, all fifty US states). There is a temptation in these situations to create a graph that is either very tall or very wide which may require scrolling.
The chief disadvantage of scrolling is that at any point in time, part of the data will be out of view. This may be acceptable if the hidden data is not necessary to convey a larger understanding. For example, in a bar graph which shows population by state, each data point is independent and a user who scrolls down to see Wyoming may not really need to see California on the screen at the same time.
However, in most cases it is important for the user to see the overall pattern, and having part of the pattern hidden can lead to frustration or miscommunication. For example, when analyzing stock performance, it would be hard for the user to grasp long-term trends if thousands of daily numbers were plotted on a very wide graph, only some of which could be seen at any one time. In this type of situation you should enable the user to adjust the graph to different time scales (daily, weekly, monthly, quarterly, yearly, 5-year, 10-year). This way the users can quickly select the time scale they want and the graph will successfully convey the trend.
If you do need to create a graph with many data points you can make it either tall or wide. In general, tall graphs are preferred when listing category values (for example, 50 the fifty States), because vertical scrolling is less disruptive on a web page than horizontal scrolling and horizontal labels are easier to read than rotated or vertical labels.
If space is limited, consider enabling Axis Zooming, which lets users zoom into a graph and scroll to see all the values along a graph axis while the graph itself maintains its size.
Active Data
Purpose:
Refers to data provided through the Active Data Service (ADS), which can be refreshed without user action.
Description:
- Data updates caused by Active Data may be indicated on a graph using Animation.
Usage:
- Active Data is often used when displaying information that is subject to change in real-time, such as stock prices, currency exchange rates, and account balances.
Animation
Purpose:
Graph animation is optional and may be applied to give visual feedback about how graph data are updating in real-time, and/or to give a graph a dynamic effect when it first appears.
Description:
There are two types of graph animation: Data Update Animation and Initial Display Animation.
The following graph types support both types of animation:
- Bar Graph (all types)
- Line Graph (all types)
- Area Graph (all types)
- Pie Graph (all types)
- Combination Graph
- Scatter Graph
- Bubble Graph
Graph types not listed here do not support either type of animation.
Both types of animation may be applied to the same graph.
Data Update Animation
Purpose:
Data Update Animation provides real-time visual feedback about which data values in a graph are changing and how they are changing. A particular piece of graph data can change in one of three ways: it can be added to a graph, removed from a graph, or its values can change.
Description:
Data Update Animation occurs when graph data values are added, removed, or updated in real-time as a result of Active Data updates or updates generated by the application.
Usage:
- Consider Data Update Animation when users are tasked with monitoring real-time data updates. Data Update Animation provides visual feedback about how graph data are changing.
- It is recommended to provide a Toggle Button to enable users to turn Data Update Animation on and off. See the Button guideline for details.
- Use Data Update Animation sparingly on pages with multiple graphs. Although there is no limit to the number of graphs on a page that can use Data Update Animation, users can become confused or frustrated when several graphs update at the same time. Consequently, it is recommended to limit Data Update Animation to three or fewer components per page, including other components on the page (such as Tables) that are updating in real-time.
- It is recommended to set the duration of the Data Update Animation to between 1000 and 1500 milliseconds. This range has been shown to be both effective and pleasing for users.
Initial Display Animation
Purpose:
Initial Display Animation is purely decorative and gives a graph a dynamic effect when the graph first appears on a page.
Description:
Initial Display Animation is different for each graph type. It gives users something pleasing to look at while a page loads.
Usage:
- Initial Display Animation is purely decorative. Consider using Initial Display Animation when demonstrating an application in a sales or marketing situation, in cases where graphs are used infrequently, or in applications for non-technical users. Because initial display animation can adversely affect application performance, it is not recommended for use in high-throughput, production environments.
- If multiple graphs appear in a single page, Initial Display Animation should be enabled either for all of the graphs or for none of the graphs. Users may become confused if some graphs animate while others do not.
Visual Effects
Purpose:
Optional visual effects may be applied to enhance a graph's appearance. These effects are purely decorative and have no other function.
Description:
The appearance of a graph can be enhanced with effects such as an overall 3-D effect, shadows, or gradients. Specific effects vary by graph type.
Usage:
Visual effects are purely decorative. Consider using Visual Effects when demonstrating an application in a sales or marketing situation, in cases where graphs are used infrequently, or in applications for non-technical users. Because visual effects can distort data relationships and distract users' attention from the data, they are not recommended for use in production environments.
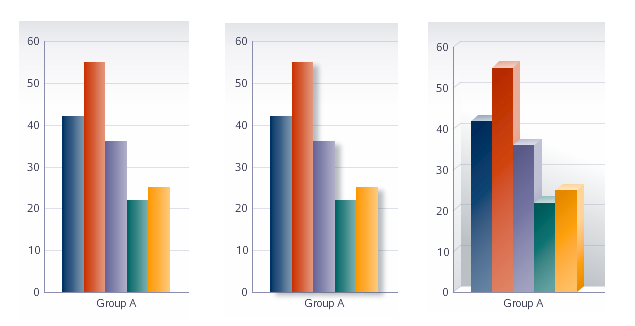
Graph with No Visual Effects, with Graph-Specific Effects (shadows), and with a 3-D Effect
Data-Dense Graphs
Purpose:
Sometimes, a graph must display many data points in a small space. In these situations, users may have difficulty comprehending and working with graph data.
Description:
The following techniques can help users work effectively with graphs that contain many data points.
Usage:
- Ensure that Data Tips are enabled so users can get more information by hovering over data points in a graph. Data Tips are enabled by default.
- Avoid using Visual Effects in data-dense graphs as these effects can distort the data and cause it to take up more space.
- Consider enabling Axis Zooming. This enables users to zoom into a particular region of a graph for closer inspection.
- Consider enabling Show/Hide Data. This enables the user to toggle the visibility of one or more data sets in a graph. To toggle data visibility of a data set, the user clicks a data set's corresponding marker in the legend. Teams must write custom code to enable Show/Hide data.
- Consider enabling Data Highlight. This visually emphasizes the data set that the user hovers over in the graph. The effect also occurs when the user hovers over a data set's corresponding marker in the legend.
Data Highlight
Axis Zoom
Configurable Elements
A graph may include any of the following elements:
| Element | Description | Required? |
|---|---|---|
| Alert * | Displays an icon on a particular data point in a graph. | No |
| Annotation * | Displays text about a particular data point on a graph inside a speech bubble. | No |
| Axes | References for plotting data. Most graphs have a vertical axis and a horizontal axis. | Yes Exceptions: Pie graph, Ring graph |
| Axis Labels | Identify category names (categorical data) or value increments (quantitative data). | Yes Exceptions: Pie graph, Ring graph, and graphs in which Axes are identified elsewhere (such as in the Subtitle) |
| Axis Tick Marks and Gridlines | Lines along on a graph's axis that provide a reference for axis values. Gridlines are Tick Marks that extend across a graph's area. | No |
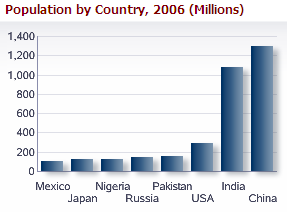
| Axis Title | Identifies the name of a data set plotted on an axis. For a quantitative axis, also identifies units of measure. Example: "Population (Millions)" |
Yes Exceptions: Pie graph, Ring graph, Temporal data |
| Data Labels * | Labels a data point on a graph - used primarily in Pie graph to identify slices. | No |
| Data Tips | Tooltips that show data point names and values. | No |
| Footnote | Provides additional information such as the source of data. Example: "Source: 2007 Annual Report" |
No |
| Legend | Identifies each data set plotted on a graph. | Yes Exceptions: Graph showing a single data set, Pie graph, Ring graph |
| Reference Marker * | Graphically highlights a particular value or range of values on a graph. | No |
| Subtitle | Provides a more specific description of a graph than the Title. Example: "Fiscal Year 2006" |
No |
| Title | Provides a general description of a graph. Example: "Retail Sales by Region" |
Yes |
* Not pictured
Table of Graph Elements
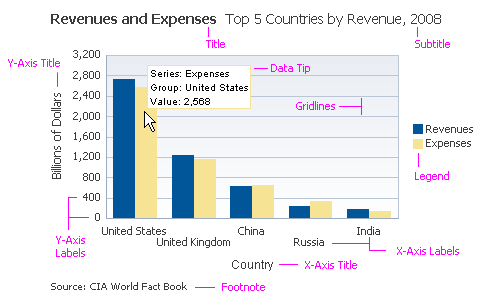
Graph Elements
Alerts and Annotations
Purpose:
Alerts and Annotations are optional elements that visually emphasize particular data values on a graph.
Description:
- An Annotation is associated with a particular graphical element on a graph (for example, a line or bar), so it is displayed next to its associated element. By contrast, an Alert is associated with a particular data value, so it is plotted in the exact position on a graph that corresponds to its associated data value.
- Visually, an Annotation is like a tooltip that is always visible, whereas an Alert is an icon.
Usage:
- When used, Annotations are always visible, so consider using Annotations to show critical information about a particular category or group in a graph that the user needs to see all the time.
- Consider using Alerts to show additional, non-critical information about particular data values on a graph. You can assign an Alert an icon of your choosing to indicate different states or types of information.
- Avoid using Annotations on data-dense graphs — the Annotations may obstruct data points.
- It is recommended to use sentence capitalization for Alerts and Annotations. See Capitalization in the Language in UI guideline for details.
- To ensure readability, it is recommended to display no more than a few Annotations or Alerts on a single graph.
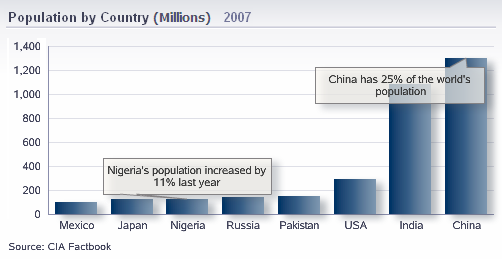
Graph with Two Annotations
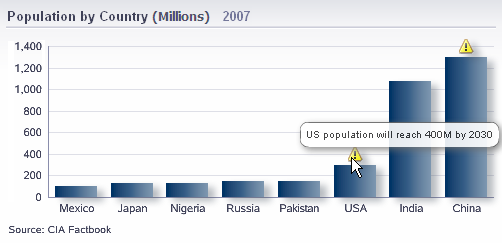
Graph with Two Alerts
Axes
Purpose:
Graph Axes are reference lines for plotting categorical or quantitative data in a graph.
Description:
Most graph types have two axes: a vertical axis, or Y-Axis, and a horizontal axis, or X-Axis. Dual Y-Axis Graphs have two Y-axes.
Axes form a frame around most graph types, and each axis may display Axis Labels, Axis Tick Marks, and an Axis Title.
Pie graphs and Ring graphs do not have axes.
Usage:
- Axes for quantitative data should always include a zero value.
- Axes may be displayed or hidden by default, based on the layout template specified by product teams.
Axis Labels
Purpose:
Axis Labels identify the categories or values increments belonging to a particular axis.
Description:
If categorical data are plotted on an axis, Axis Labels identify categories. If quantitative data are plotted on an axis, Axis Labels identify value increments.
Usage:
- Axis Labels are required for each graph axis.
- It is not recommended to show units of measure in Axis Labels. Units of measure should appear in the Axis Title instead.
- By default, the graph abbreviates numeric units of measure in Axis Labels. However, it is not recommended to show these abbreviations because the they cannot be translated into all languages. For example, a graph will abbreviate the value 1,400,000,000 as 1,400M. To avoid Axis Label abbreviation, it is recommended to change the scale of the data (to reduce label size) and to show units in the Axis Title. See Axis Titles for more information.
- The zero value on an axis containing quantitative data should be labeled.
- Axis Labels are most readable when they are oriented horizontally. Clipping, skipping values, and rotation reduce readability.
- When Axis Labels are sequential (for example, months in a year) and space is limited, labels may be skipped at regular intervals. For example, if every other year is skipped, labels might read: 2000, 2002, 2004, etc...
- It is recommended to use sentence capitalization for Axis Labels. See Capitalization in the Language in UI guideline for details.
In the following figure, the Horizontal Bar graph enables the Axis Labels to appear without rotation, making them easier to read. Notice how, in the Vertical Bar graph, the rotated Axis Labels are more difficult to read.
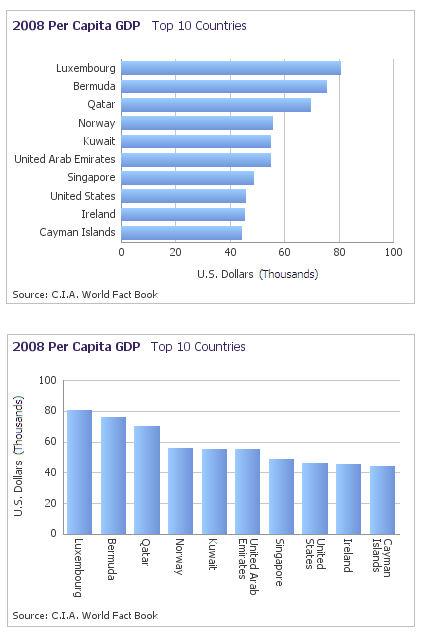
Rotated Axis Labels are More Difficult to Read
Axis Tick Marks and Gridlines
Purpose:
Axis Tick Marks and Gridlines are lines that mark uniform increments along a graph axis. The uniform increments might represent quantitative data values, intervals of time, or category values. Axis Tick Marks and Gridlines are optional.
Description:
Axis Tick Marks are short lines drawn perpendicular to an axis. Gridlines are Tick Marks that extend across the full width or height of a graph.
Usage:
- Generally speaking, it is recommended to display Gridlines only for axes that contain quantitative data.
- For axes containing categorical data, Tick Marks are recommended when some, but not all, category labels are displayed. See to Axis Labels for more information.
- Consider displaying both vertical and horizontal Gridlines on Scatter Graphs so that data point positions are clearly conveyed.
- Displaying both Tick Marks and Gridlines for a particular axis is redundant and adds visual clutter.
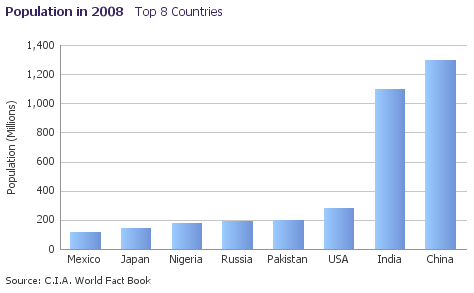
Bar Graph Showing Gridlines on its Quantitative Axis
Scatter Graph with Gridlines
Axis Titles
Purpose:
An Axis Title identifies the name of a data set plotted on an axis. For a quantitative axis, it also shows units of measure.
Description:
Axis Titles are required for all axes except those which contain Temporal data.
Usage:
- Generally speaking, Axis Titles are required for any axis for which a graph's Title, Subtitle, Axis Labels do not sufficiently identify the data set and its units. For example, if Axis Labels show month names, an Axis Title may be necessary to show the year or years to which the months belong.
- For an axis containing quantitative data, the Axis Title should show the name of the data set and its units of measure. When displaying both the data set name and units of measure, units of measure should be displayed in parentheses. For example: "Fulfillment Ratio (%)".
- For an axis containing categorical data, the Axis Title should show the name of the data set. For example: "Product".
- See the Common Formats guideline for information about how to format labels for different types of data.
- The Axis Title for a horizontal axis should appear centered below its axis.
- The Axis Title for a vertical axis should appear centered next to its axis.
- It is recommended to use headline capitalization for Axis Titles. See Capitalization in the Language in UI guideline for details.
Data Labels
Purpose:
Data Labels show data point values as text labels directly on the graph.
Description:
A Data Label shows only a data point's quantitative data values. For example, Data Labels on a Bar graph show the bar's quantitative value, and not the bar's category name. Exceptions are the Pie graph and Ring graph, whose Data Labels may also display categorical information.
Usage:
- Data Labels are optional and should be disabled for most graph types. Exceptions are the Pie graph, Ring graph, and very sparse Line graphs and Bar graphs.
- Consider Data Labels for Line graphs and Bar graphs that show very few data values.
- For Pie and Ring graphs, it is recommended to hide the Legend, and instead display Data Labels containing both the name and the value of each slice. However, if a Pie or Ring graph has long data labels, has many slices, or is very small, use the Legend instead of displaying Data Labels on the graph.
- When Pie or Ring graph Data Labels are displayed, it is not necessary to display a Legend.
Pie Graph with Recommended Data Label Display
Data Tips
Purpose:
A Data Tip shows a data point's name and values in a tooltip.
Description:
A Data Tip appears when the user mouses over a data point on a graph.
Usage:
- Data Tips are enabled by default.
- Although Data Tips are optional, they should be enabled for all graph types.
Legend
Purpose:
The Legend is a key that identifies each data set in a graph. It shows the user what the elements in the graph represent and how they are represented.
Description:
- The Legend shows a visual cue (such as a box or line) and a label for each data series displayed in a graph.
- By default, the layout and placement of the legend is determined automatically, based on the size of the graph and the number of items in the legend. However, product teams may specify a particular layout and placement.
Usage:
- A Legend is required for any graph displaying more than one data set. Exceptions are the Pie graph and Ring graph, which do not require a Legend if their Data Labels show both the name and value of their data sets. See Data Labels for more information.
- The Legend should be positioned either below or to the right of the graph depending on the size of your graph and the layout of your page.
- When a graph is wide, it is recommended to display the Legend oriented horizontally below the graph. This saves space and improves readability.
- When the Legend is positioned next to the graph, it should have a vertical orientation.
- When the legend is vertically-oriented and there are roughly 10 or more individual items to show, consider enabling legend scrolling. Legend scrolling keeps the legend in a single column while still enabling users to see each item in the legend.
- Whenever possible, the information in the Legend should appear in the same order as the information in the graph.
- Display a border around the Legend only when the Legend contains more than a few elements. By default, no border is displayed.
- It is not recommended to display a Legend title. By default, no title is displayed.
- It is recommended to use headline capitalization for the Legend title and sentence capitalization for Legend labels. See Capitalization in the Language in UI guideline for details.
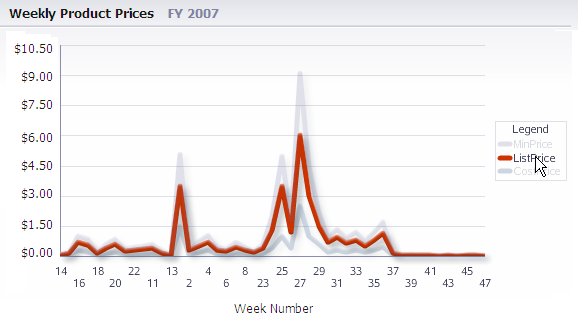
Wide Graph with Horizontal Legend Placed Below
Reference Markers
Purpose:
Reference Markers provide visual references for specific data ranges or data values in a graph.
Description:
A graph may display one or more Reference Lines or Reference Areas that visually highlight data values or data ranges that teams define. For example, a Reference Line might indicate the average temperature over a series of months.
Usage:
- Reference Markers are optional.
- It is recommended to show Reference Markers in the Legend so users understand what they represent.
- To ensure that users can see the graph data clearly, it is recommended to display no more than a couple of Reference Lines or Reference Areas in a single graph.
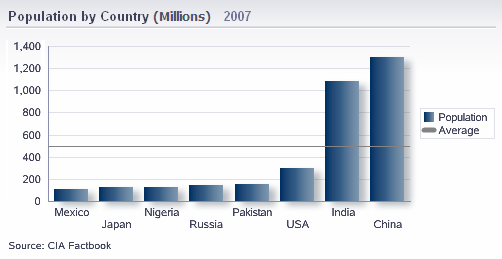
Graph with Reference Line Indicating Average Value
Title, Subtitle, and Footnote
Purpose:
The Title, Subtitle, and Footnote describe the graph and its content.
Description:
Generally speaking, The Title describes the graph overall, the Subtitle adds more specific descriptive information, and the Footnote shows supporting information such as the source of data.
Usage:
- A graph must have a Title describing its contents. A graph may also have a Subtitle. The Subtitle should show more specific information about a graph, such as dates or page values.
- Avoid using abbreviations in Titles, Subtitles, and Footnotes.
- A Title may be displayed or hidden by default, based on the layout template specified by product teams.
- Product teams can use either the graph's own Title and Subtitle elements, which appear inside the graph component, or external labels, which appear outside the graph component.
- Consider using the graph's own Title and Subtitle elements when:
- the graph is large enough to accommodate a title inside
- multiple graphs in one page section require different titles
- Consider using external labels to show a graph Title and Subtitle when:
- the graph is small and/or space is limited
- there is only one graph in the section, or multiple graphs can share the same title
- When using labels, display the Title and Subtitle on a single line, separated by a hyphen.
- The Footnote is optional, and may be used to show additional information about a graph, such as the source of data.
- It is recommended to use headline capitalization for Titles and Subtitles, and sentence capitalization for Footnotes. See Capitalization in the Language in UI guideline for details.
Small Graph Using an External Label for Title
Common Actions
Selection
Purpose:
Enables users to select a single symbol in a Scatter Graph or Bubble Graph.
Description:
When selection is enabled, the appearance of a symbol changes on mouseover and when selected, indicating which item is being acted upon.
Usage:
Enable selection on a Scatter Graph or Bubble Graph when users need to select individual items.
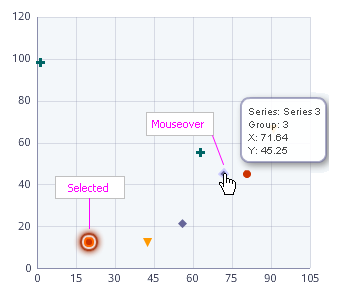
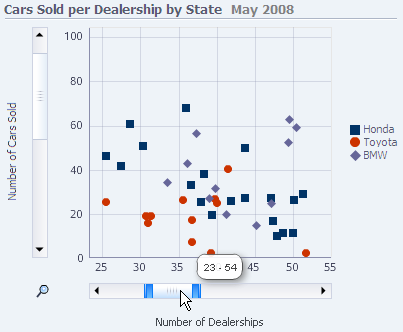
Selection on a Scatter Graph
Accessing Details
Graphs are good at conveying an initial understanding, but users often need to see more details than can be shown in a particular graph.
Providing an alternative, tabular view of data is a simple way to enable users to see details. Each graph on a page should show a link above the graph that enables the user to switch between the graph and a table containing graph data. The link's label should be "Show Table" when the graph is displayed and "Show Graph" when the table is displayed.
Drilling
Drilling is one of the most powerful forms of interaction available to a graph and should be used as appropriate. Drilling in a graph is directly analogous to drilling in a table. Just as users can click a link in a table cell to see more information, they can click on a bar or data point in a graph to do the same thing. Any graph that is directly associated with a table containing drillable cells should enable drilling for the graph elements corresponding to the table cells. Refer to the Links in Tables in the Table Interaction Methods guideline for information about drilling in Tables.
Because it may not be obvious to users which graphs may be drilled and which are not, it is recommended to apply blue underline to axis labels corresponding to drillable graph elements, so they appear as links. This style is applied by default when graph elements are drillable, so teams do not have to do anything special to show it.
Filter by Time
Purpose:
Graphs are often used to show data over time. Sometimes, users want to see an overview of data for a long period of time, and then see more detailed data for a particular portion of that time period.
Description:
The Time Filter requires two graphs. The user selects a time period in one graph, and the second graph updates to show data for only the time period selected.
Users can use the Time Filter to select a time period in one graph and see the detailed data for that time period in another graph, or in another component, such as a table.
Usage:
- The two graphs should be placed next to each other so that their connection is clear to users.
- If the graphs are positioned vertically, they should have the same width; if positioned horizontally, they should have the same height.
- If the two graphs represent the same data, they should use the same colors and should share a legend.
- It is recommended to show the same data at different levels of detail in the two graphs. The graph containing the Time Filter should show less detailed data, whereas the other graph should show more detailed data. For example, the Time Filter graph might show monthly data, and the detail graph might show daily data.
- It is recommended to position the Time Filter over the most recent few time periods by default, so that both graphs show the most recent data when the graph appears.
Print
- A Printing option allows the user to view the graph as a separate PDF document which can then be either printed out, saved, or emailed.
- Alternatively, the browser's built-in printing capability may be used to print a graph directly.
- It is recommended to provide a link labeled "Print" just below the graph. See the Printable Page guideline for more information.
Export
- An Export option allows the user to save the graph as a spreadsheet which can be opened and edited.
- It is recommended to provide a link labeled "Export" just below the graph.