Chart
dvtm:areaChart, dvtm:barChart, dvtm:bubbleChart, dvtm:comboChart, dvtm:funnelChart, dvtm:horizontalBarChart, dvtm:lineChart, dvtm:lineChart, dvtm:pieChart, dvtm:scatterChart, dvtm:sparkChart, dvtm:timeAxisChart
The Chart components display numeric and categorical information visually, facilitating rapid understanding of data and their relationships. Common chart types include Bar, Line, Area, and Pie graphs. There are several different AMX components available for charting:
- Area Chart: Shows quantities over time or by category. This chart is a line chart for which the regions below or between lines is filled in.
- Bar Chart: Shows quantities associated with categories. This chart show quantities as bar lengths and categories as bars or groups of bars.
- Bubble Chart: Shows bubble graph plots three sets of quantitative data against each other. Bubbles may be colored to show an additional categorical data set.
- Combo Chart: Shows quantities over time or by category in a single plot, using any combination of bar, line or area charts. Combination graphs are often displayed as Dual-Y graphs.
- Funnel Chart: Shows the progress of individual steps in a process. Each slice of the funnel represents a step, and as a step is completed, its slice fills. Slice heights may be difficult to compare accurately because they are not vertically aligned.
- Line Chart: Shows quantities over time or by category. Exact data values may be marked with a symbol.
- Pie Chart: Represents a total quantity for a set of categories. The pie is made up of slices, each of which represents a category. The the area of each slice represents each category's value as a percentage of the total.
- Scatter Chart: Plots two sets of quantitative data against each other. Plotted points may use colors or symbols to show an additional categorical data set.
- Spark Chart: Shows a tiny graph ideal for display in table cells or in a form layout to present data in a simple, condensed format.
- Time Axis: Shows quantities over time This chart is a type of line chart.
These components are used on tablets and phones.
Appearance
Appearance characteristics for this component.
General
- All charts except Spark Chart have an optional display of a title, sub title and footer.
- All charts except Spark Chart have an optional display of a legend next to the chart.
- Chart colors can be completely customized.
- Hidden chart data will be shown in the legend as an un-highlighted square.
Bar Chart
- Bars can be displayed in either horizontal or vertical orientation.
Bubble Chart
- The chart supports circle, square, plus, diamond, triangle up, triangle down, human points.
Combo Chart
- The chart supports bar and line elements.
Funnel Chart
- Steps can be displayed in either vertical or horizontal orientation.
Line Chart
- Supports a line over categories
Pie Chart
- Supports either flat or 3 dimensional presentation of the chart.
Scatter Chart
- The chart supports different shaped points.
Spark Chart
- The chart supports bar, line, area, floating bar formats.
Time Axis Chart
- Supports a line over time.
Behavior
Common behaviors for this component.
All Charts, Except Spark Chart
- Press and Hold: All charts support a press and hold (i.e. rollover) behavior where all data is dimmed except the selected data. Dimming does not apply to Funnel Chart and Sunburst.
- Selection: All charts have an option for single data selection, multiple data selection or no data selection.
- Render: All charts have an option to show or hide chart data based on tapping the corresponding legend item.
Usage
Usage guidelines for this component.
Area Chart
- Use to show the magnitude change over time or to highlight a total value over time.
- Because regions can overlap and cause data to be hidden, it is recommended to use a line chart or stacked area chart when there are multiple series.
- The horizontal axis should contain evenly distributed sequential values, such as time periods or ordered categories.
- Quantities may have values that are much larger or smaller than zero, and may be both positive and negative.
- You may have a need to include zero on the vertical axis scale, but this is not recommend by default.
Bar Chart
- Use to compare values among categories.
- Most effective when values vary widely or are close to zero. When showing similar values that are much larger or smaller than zero, bar lengths will tend to look the same. In this case, use a Line Chart instead.
- When the vertical or horizontal axis represents a quantity, include zero on the corresponding axis scale.
Bubble Chart
- Include zero on all axis scales.
- Data values may be positive or negative.
- If there are more than four categories in the categorical data set, consider splitting them up into groups of four and using a separate Bubble Chart for each group. Too many categories will make the chart unreadable.
Combo Chart
- Useful for highlighting relationships between different sets of data that have different value scales, such as product prices (in dollars) and product volume (in units).
- If the chart includes an Area Chart, ensure that the Area Chart appears beneath other chart types.
- If the Chart includes a Line Chart, ensure that the Line Chart appears on top of other chart types.
- It is not recommended to show more than two types of charts in a Combination Chart. Doing so may make the chart difficult to understand.
Funnel Chart
- Use to show progress of individual steps in a process. As a step is completed, its slice fills.
- Do not use this chart if you need to compare slice heights accurately (slices are not vertically aligned).
- Teams can customize color of each slice.
Line Chart
- Use to show trends over time.
- Due to visual similarity between the regular Line Chart and other types of Line Charts, it is recommended to use a Stacked Area Chart instead of a Stacked Line Chart.
- The horizontal axis should contain evenly distributed sequential values, such as time periods or ordered categories.
- Quantities may have values that are much larger or smaller than zero, and may be both positive and negative.
- Use data value markers if there are few categories and if indicating precise data values is important.
- Include zero on the vertical axis scale.
Pie Chart
- Recommended over other percentage charts for indicating that the quantities displayed are percentages, because the circular shape of a Pie Chart indicates a complete or total quantity; thus, the slices are naturally interpreted as percentages of the total. For this reason, however, the values displayed in a Pie Chart must add up to 100%.
- Effective for making relative comparisons between percentages, such as identifying the categories with the largest and smallest percentage.
- Not effective for making accurate comparisons between percentages, such as determining precisely how much larger one percentage is than another.
- When a Pie Chart has many slices, it is recommended to display the largest eight to ten slices individually, and to combine the remaining slices into a single slice labeled "Other".
- Pie slice explosion should be used sparingly, to highlight an important data value or a slice that has been interacted with.
Scatter Chart
- Include zero on all axis scales.
- Data values may be positive or negative.
- If there are more than four categories in the categorical data set, consider splitting them up into groups of four and using a separate Scatter Chart for each group. Too many categories will make the chart unreadable.
Spark Chart
- A Spark Chart is primarily used to display trends.
- A Spark Chart can display a single set of data only.
- Unlike other graph types, Spark Charts have no legend, title, subtitle, footnote, data tips, or data labels. Spark Charts may not include alerts or annotations.
- Teams can customize chart size, bar, line, and area colors, and background color.
Sample
DVTM sample code for this component.
Area DVTM Sample
    <dvtm:areaChart var="row" value="#{bindings.lineData.collectionModel}" id="areaChart1"
                    inlineStyle="#{pageFlowScope.inlineStyle}"
                    dataCursor="#{pageFlowScope.dataCursor}"
                    dataCursorBehavior="#{pageFlowScope.dataCursorBehavior}"
                    dataSelection="#{pageFlowScope.dataSelection}"
                    footnote="#{pageFlowScope.footnote}"
                    footnoteHalign="#{pageFlowScope.footnoteHalign}"
                    hideAndShowBehavior="#{pageFlowScope.hideAndShowBehavior}"
                    rolloverBehavior="#{pageFlowScope.rolloverBehavior}"
                    stack="#{pageFlowScope.stack}"
                    subtitle="#{pageFlowScope.subtitle}"
                    title="#{pageFlowScope.title}"
                    titleHalign="#{pageFlowScope.titleHalign}">

      <amx:facet name="dataStamp">

        <dvtm:chartDataItem group="#{row.group}" value="#{row.value}" series="#{row.series}"/>

      </amx:facet>

      <dvtm:legend position="end" id="l1"/>

    </dvtm:areaChart>
Bar DVTM Sample
    <dvtm:barChart var="row" value="#{bindings.barData.collectionModel}" id="barChart1"
                    inlineStyle="#{pageFlowScope.inlineStyle}"
                    dataCursor="#{pageFlowScope.dataCursor}"
                    dataCursorBehavior="#{pageFlowScope.dataCursorBehavior}"
                    dataSelection="#{pageFlowScope.dataSelection}"
                    footnote="#{pageFlowScope.footnote}"
                    footnoteHalign="#{pageFlowScope.footnoteHalign}"
                    hideAndShowBehavior="#{pageFlowScope.hideAndShowBehavior}"
                    rolloverBehavior="#{pageFlowScope.rolloverBehavior}"
                    stack="#{pageFlowScope.stack}"
                    subtitle="#{pageFlowScope.subtitle}"
                    title="#{pageFlowScope.title}"
                    titleHalign="#{pageFlowScope.titleHalign}">

      <amx:facet name="dataStamp">

        <dvtm:chartDataItem group="#{row.group}" value="#{row.value}" series=" #{row.series}"/>

      </amx:facet>

      <dvtm:legend position="end" id="l1"/>

    </dvtm:barChart>
Bubble DVTM Sample
    <dvtm:bubbleChart var="row" value="#{bindings.bubbleData.collectionModel}" id="bubbleChart1"
                    inlineStyle="#{pageFlowScope.inlineStyle}"
                    dataSelection="#{pageFlowScope.dataSelection}"
                    footnote="#{pageFlowScope.footnote}"
                    footnoteHalign="#{pageFlowScope.footnoteHalign}"
                    hideAndShowBehavior="#{pageFlowScope.hideAndShowBehavior}"
                    rolloverBehavior="#{pageFlowScope.rolloverBehavior}"
                    subtitle="#{pageFlowScope.subtitle}"
                    title="#{pageFlowScope.title}"
                    titleHalign="#{pageFlowScope.titleHalign}">

      <amx:facet name="dataStamp">

        <dvtm:chartDataItem group="#{row.group}" x="#{row.x}" y="#{row.y}" z="#{row.z}">

            <dvtm:attributeGroups id="ag1" type="color" value="#{row.series}" />

            <dvtm:attributeGroups id="ag2" type="shape" value="#{row.group}" />

        </dvtm:chartDataItem>

      </amx:facet>

      <dvtm:legend position="end" id="l1"/>

    </dvtm:bubbleChart>
Combo DVTM Sample
    <dvtm:comboChart var="row" value="#{bindings.barData.collectionModel}" id="comboChart1"
                    inlineStyle="#{pageFlowScope.inlineStyle}"
                    dataCursor="#{pageFlowScope.dataCursor}"
                    dataCursorBehavior="#{pageFlowScope.dataCursorBehavior}"
                    dataSelection="#{pageFlowScope.dataSelection}"
                    footnote="#{pageFlowScope.footnote}"
                    footnoteHalign="#{pageFlowScope.footnoteHalign}"
                    hideAndShowBehavior="#{pageFlowScope.hideAndShowBehavior}"
                    rolloverBehavior="#{pageFlowScope.rolloverBehavior}"
                    stack="#{pageFlowScope.stack}"
                    subtitle="#{pageFlowScope.subtitle}"
                    title="#{pageFlowScope.title}"
                    titleHalign="#{pageFlowScope.titleHalign}">

      <amx:facet name="dataStamp">

        <dvtm:chartDataItem group="#{row.group}" value="#{row.value}"
                            series="#{row.series}"/>

      </amx:facet>

            <amx:facet name="seriesStamp">

                <dvtm:seriesStyle series="#{row.series}" type="bar"
                       rendered="#{(row.series eq 'Series 1') or (row.series eq 'Series 2') or (row.series eq 'Series 3')}" />

                <dvtm:seriesStyle series="#{row.series}" type="line" lineWidth="5"
                       rendered="#{(row.series eq 'Series 4') or (row.series eq 'Series 5')}" />

            </amx:facet>

      <dvtm:legend position="end" id="l1"/>

    </dvtm:comboChart>
Funnel DVTM Sample
    <dvtm:funnelChart
         var="row"
         value="#{bindings.funnelData.collectionModel}"
         styleClass="dvtm-gallery-component"
         id="funnelChart1"
         sliceGaps="on"
         threeDEffect="#{pageFlowScope.threeD ? 'on' : 'off'}"
         orientation="#{pageFlowScope.orientation}"
         dataSelection="#{pageFlowScope.dataSelection}"
         footnote="#{pageFlowScope.footnote}"
         footnoteHalign="#{pageFlowScope.footnoteHalign}"
         hideAndShowBehavior="#{pageFlowScope.hideAndShowBehavior}"
         rolloverBehavior="#{pageFlowScope.rolloverBehavior}"
         seriesEffect="#{pageFlowScope.seriesEffect}"
         subtitle="#{pageFlowScope.titleDisplay ? pageFlowScope.subtitle : ''}"
         title="#{pageFlowScope.titleDisplay ? pageFlowScope.title : ''}"
         titleHalign="#{pageFlowScope.titleHalign}"
         animationOnDataChange="#{pageFlowScope.animationOnDataChange}"
         animationDuration="#{pageFlowScope.animationDuration}"
         animationOnDisplay="#{pageFlowScope.animationOnDisplay}"
         shortDesc="#{pageFlowScope.shortDesc}">

   <amx:facet name="dataStamp">

      <?audit suppress oracle.adfmf.undefined-facet?>

      <dvtm:funnelDataItem
               label="#{row.label}"
               value="#{row.value}"
               targetValue="#{row.targetValue}"
               color="#{row.color}"
               shortDesc="This is a tooltip">
         <?audit suppress oracle.adfmf.invalid-facet-child?>

      </dvtm:funnelDataItem>

   </amx:facet>

   <dvtm:legend
            position="#{pageFlowScope.legendPosition}"
            id="l1"
            rendered="#{pageFlowScope.legendDisplay}"/>

</dvtm:funnelChart>
Line DVTM Sample
    <dvtm:lineChart var="row" value="#{bindings.lineData1.collectionModel}" id="lineChart1"
                    inlineStyle="#{pageFlowScope.inlineStyle}"
                    dataCursor="#{pageFlowScope.dataCursor}"
                    dataCursorBehavior="#{pageFlowScope.dataCursorBehavior}"
                    dataSelection="#{pageFlowScope.dataSelection}"
                    footnote="#{pageFlowScope.footnote}"
                    footnoteHalign="#{pageFlowScope.footnoteHalign}"
                    hideAndShowBehavior="#{pageFlowScope.hideAndShowBehavior}"
                    rolloverBehavior="#{pageFlowScope.rolloverBehavior}"
                    stack="#{pageFlowScope.stack}"
                    subtitle="#{pageFlowScope.subtitle}"
                    title="#{pageFlowScope.title}"
                    titleHalign="#{pageFlowScope.titleHalign}">

      <amx:facet name="dataStamp">

        <dvtm:chartDataItem group="#{row.group}"
                            value="#{row.value}" series=" #{row.series}"/>

      </amx:facet>

      <amx:facet name="seriesStamp">

        <dvtm:seriesStyle series="#{row.series}" color="#{row.lineColor}"
                          lineWidth="#{row.lineWidth}" lineStyle="#{row.lineStyle}"
                          markerDisplayed="true" rendered="true"/>

      </amx:facet>

      <dvtm:legend position="end" id="l1"/>

    </dvtm:lineChart>
Pie DVTM Sample
    <dvtm:pieChart var="row" value="#{bindings.pieData.collectionModel}" id="pieChart1"
                    inlineStyle="#{pageFlowScope.inlineStyle}"
                    dataSelection="#{pageFlowScope.dataSelection}"
                    footnote="#{pageFlowScope.footnote}"
                    footnoteHalign="#{pageFlowScope.footnoteHalign}"
                    hideAndShowBehavior="#{pageFlowScope.hideAndShowBehavior}"
                    rolloverBehavior="#{pageFlowScope.rolloverBehavior}"
                    subtitle="#{pageFlowScope.subtitle}"
                    threeDEffect="#{pageFlowScope.threeDEffect}"
                    title="#{pageFlowScope.title}"
                    titleHalign="#{pageFlowScope.titleHalign}">

      <amx:facet name="dataStamp">

        <dvtm:pieDataItem label="#{row.label}" value="#{row.value}"/>

      </amx:facet>

    </dvtm:pieChart>
Scatter DVTM Sample
    <dvtm:scatterChart var="row" value="#{bindings.scatterData.collectionModel}" id="scatterChart1"
                    inlineStyle="#{pageFlowScope.inlineStyle}"
                    dataSelection="#{pageFlowScope.dataSelection}"
                    footnote="#{pageFlowScope.footnote}"
                    footnoteHalign="#{pageFlowScope.footnoteHalign}"
                    hideAndShowBehavior="#{pageFlowScope.hideAndShowBehavior}"
                    rolloverBehavior="#{pageFlowScope.rolloverBehavior}"
                    subtitle="#{pageFlowScope.subtitle}"
                    title="#{pageFlowScope.title}"
                    titleHalign="#{pageFlowScope.titleHalign}">

      <amx:facet name="dataStamp">

        <dvtm:chartDataItem group="#{row.group}" x="#{row.x}" y="#{row.y}">

          <dvtm:attributeGroups type="color shape" value="#{row.series}" id="attributeGroups1"/>

        </dvtm:chartDataItem>

      </amx:facet>

      <dvtm:legend position="end" id="l1"/>

    </dvtm:scatterChart>
Spark DVTM Sample
    <dvtm:sparkChart var="row" value="#{bindings.sparkData.collectionModel}" id="sparkChart1"
                     color="#{pageFlowScope.color}"
                     inlineStyle="#{pageFlowScope.inlineStyle}"
                     type="line" >

      <amx:facet name="dataStamp">

        <dvtm:sparkDataItem value="#{row.value}" date="#{row.date}" color="{row.color}"/>

      </amx:facet>

    </dvtm:sparkChart>
Time Axis DVTM Sample
    <dvtm:lineChart var="row" value="#{bindings.stockData.collectionModel}" id="lc1"
                    styleClass="dvtm-gallery-component"
                    dataCursor="off"
                    title="Stock Trends"
                    timeAxisType="enabled"
                    dataSelection="#{pageFlowScope.dataSelection}"
                    zoomAndScroll="#{pageFlowScope.zoomAndScroll}">
                    <!-- Until bug 17782626 is fixed, you may have to disable XML validation
                         to deploy the demo. Otherwise, itt will complain about unsupported
                         zoomAndScroll attribute. -->
                    <!--viewportChangeListener="#{PropertyBean.viewportChangeListener}"-->

      <amx:facet name="dataStamp">

        <dvtm:chartDataItem group="#{row.date}" value="#{row.value}" series="#{row.name}" id="cdi1"
                            label="#{pageFlowScope.labelDisplay ? row.value : ''}"/>

      </amx:facet>

      <amx:facet name="overview">

        <dvtm:overview id="ovw" rendered="#{pageFlowScope.overviewDisplay}" inlineStyle="height:15%;"/>

      </amx:facet>

      <dvtm:xAxis viewportMinValue="2010-06-02T09:16:39.637Z" viewportMaxValue="2011-06-02T09:16:39.637Z">

        <dvtm:majorTick lineColor="rgb(128,128,128)"/>

      </dvtm:xAxis>

      <!--dvtm:xAxis viewportMinValue="1293840000000" viewportMaxValue="1325376000000">

        <dvtm:majorTick lineColor="rgb(128,128,128)"/>

      </dvtm:xAxis-->

      <dvtm:legend position="#{pageFlowScope.legendPosition}" id="l1" rendered="#{pageFlowScope.legendDisplay}"/>

    </dvtm:lineChart>
Related
- Used On: Phone, Tablet
- Also Called: Graphic, Graph
- Related Components: Gauge
- Resources: None
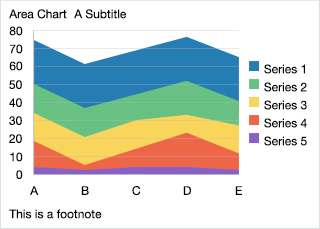
Fig 1. iOS and Android - Area Chart
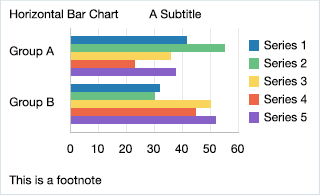
Fig 2. iOS and Android - Bar Chart Horizontal
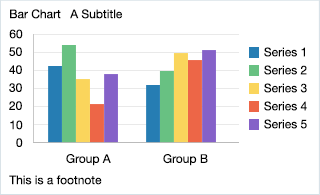
Fig 3. iOS and Android - Bar Chart Vertical
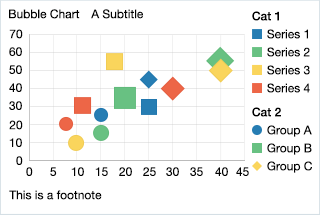
Fig 4. iOS and Android - Bubble Chart
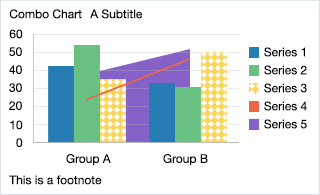
Fig 5. iOS and Android - Combo Chart
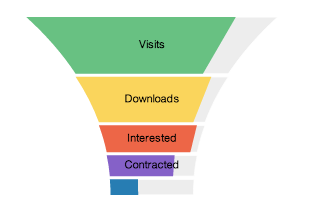
Fig 11. iOS and Android - Funnel Chart
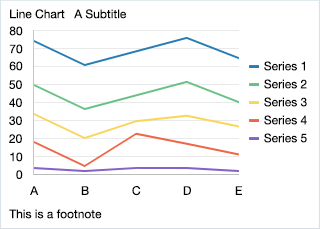
Fig 6. iOS and Android - Line Chart
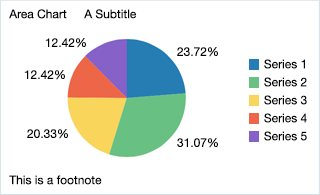
Fig 7. iOS and Android - Pie Chart
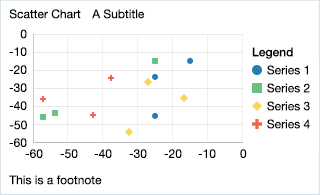
Fig 8. iOS and Android - Scatter Chart
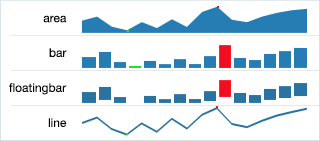
Fig 9. iOS and Android - Spark Chart
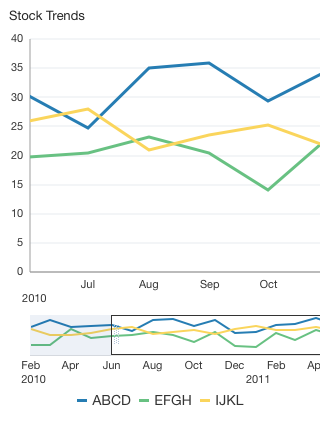
Fig 10. iOS and Android - Time Axis Chart