Debugging Swing Applications with the UI Debugger
Written by
Frank Nimphius and
Shay Shmeltzer, Oracle,
December 2005
Introduction
When you look at a developers building Swing applications you mostly see them using a visual layout editing, like the one in JDeveloper, to create their application. But when it comes to debugging Swing, most developers have to do with "regular" line debugger without any visual help. While developing JDeveloper, in itself quite a complex Swing applications, the developers at Oracle wanted a better way to debug Swing applications, and this led to the creation of the unique Swing UI Debugger available in JDeveloper. The idea behind the visual debugger is to be able to debug the application without looking at the code and figuring out what it does.
In this article we'll look at some of the capabilities of this debugger.
Debugging the Swing Demos
To ilustrate how easy it is to use the UI Debugger, let's show you how to make sense of the Swing demos distributed with the JDK and find out their internal working.
First let's set up a project in JDeveloper for the swing demos. Create a new application and project in JDeveloper. Go to the project properties and in the project content remove the existing directory and add instead the demo/jfc/swingset2/src directory from the JDK distribution you are working with.

Now let's debug the demos Click on the SwingSet2.java file and from the debug menu choose UI Debug The Swing demo application will start running.

Click on the Jslider Demo icon and note how when you move the "Minor Ticks" slider there is a message showing down at the bottom of the screen with the value. How did they do that?

This is the time to get the UI Debugger into action. Without closing the running application, switch to the JDeveloper window. In the UI Outline debugger window in JDeveloper click the little camera icon to take a snapshot of your application. In the snapshot click the "Minor Ticks" slider to focus on it, you want to find out who is listening on events from this object. Right click the slider and choose "show listeners".

A window with the list of listeners for this object appear. You can choose the listener and click the go-to-source button that will take you directly to see the code that will be invoked.

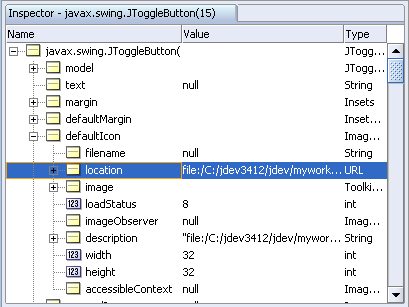
Another useful feature is the ability to inspect objects on the screen, for example lets say you want to find out the location of the icon for one of the buttons in the toolbar. Right Click one of the buttons at the top and choose "inspect".

The inspect window will appear and you'll be able to locate the value for the icon location.
You've just seen how easy it is to find out what is going on in a Swing user interface without going down into the code level.
Now let's explore another example that highlights the UI Tree view provided by the UI Debugger.
The UI Tree Search Example
While on the surface the structure of the Swing application looks simple the reality is that technically a Swing UI is a complex nesting of components and containers similar to the famous Russian doll that contains other dolls. In opposite to Russian dolls, which follow a simple form of nesting, Swing UIs can have very complex nesting hierarchies that make you wonder how to find the location of a specific component to work with.
Let's see how the visual Swing UI Debugger in Oracle JDeveloper helps application developers locate and debug UI components in Swing applications.
Introducing the Sample Application
To help us guide you through this how-to we created this simple application. Download the sample file, extract it on your disk, and then open the the swingLogon.jws file using JDeveloper 10.1.3.
Our application is quite simple, it consists of the RunnerFrame which has one button that calls the LogonDialog. The LogonDialog has two fields for username and password as well as an "OK" and "Cancel" buttons.
A common design functionality in GUI dialogs is that the tab key is used for field navigation while the enter key is used to submit the dialog. To implement this functionality in our logon dialog, we'll add a keyboard listeners for the username and password field to invokes the ok button when the enter key is pressed.
The code executed by the event listener looks similar to the following:
                                    private void mPassword_keyPressed(KeyEvent e) {
  if (e.getKeyCode() == KeyEvent.VK_ENTER){
        ((JButton)#path to button#.getComponent(0)).doClick();
   }
}
The development challenge is to determine the access path to the ok button on the JOptionPane dialog. Let's see how the Swing GUI Debugger in Oracle JDeveloper becomes handy in such a case.
Working with the Swing UI Debugger
To use the Swing UI Debugger, click the RunnerFrame file in the navigator and from the debugger menu choose the UI debugger option.

Now click the logon button in the applicaiton this will pop-up a logon dialog. At this point , press one of the photo camera icons in either the UI Tree window or UI Outline window. The UI outline window shows the screen capture of the current user interface and allows you to select the UI component to debug. Checking the "outline" option shows the outline of the container holding the components.

Now you can click on the "ok" button in the UI Outline window. The UI Tree window is synchronized with the UI outline window and shows the location of a selected component in the UI components tree. You can click on other components in the image, such as the username field, to see their relative location.
For our dialog, the image of the UI Tree shows that in order to get from the username field to the ok button we need to go to level up and then three levels down we can also see in the UI Tree the order of the items in each container. The component above the current component, the ancestor, is accessed by a call to the selected component's getParent method, while the component below the current component, the descendent, is access by a call to getComponent. The access path to the button therefore is
             JPanel topPanel = (JPanel) usernameField.getParent().getParent() ;

             JOptionPane buttonOptionPane = (JOptionPane) topPanel.getComponent(2);
             JPanel buttonPanel = (JPanel) buttonOptionPane.getComponent(1);
             JButton okButton = (JButton) buttonPanel.getComponent(0);
Figuring this path out without the UI Debugger surely would have required longer time. Using the class type information for each level in the hierarchy allows developers to write more efficient code when parsing the tree.
Summary
The Swing UI debugger in JDeveloper offers an easier way to debug Swing based applications by providing a visual way to access and analyze the complex structure of a Swing applicaiton. It is a must have feature for any serious Swing developer.