
실시간 통합 데이터를 통해 최적의 효율성 확보하고 위험 낮추기
오늘날의 제조업체들은 여러 공장 전반의 모든 라인이 얼마나 효율적으로 구동되고 있는지 파악할 수 있어야 합니다. 또한 문제가 발생하면 5분 또는 10분 뒤가 아니라 그 즉시 문제 발생 사실을 알 수 있어야 합니다. 하지만 문제를 즉시 파악하는 일 자체가 이들의 가장 큰 도전 과제 중 하나입니다. 여러 원격 위치의 데이터에 실시간으로 액세스할 수 있어야 하지만, 인터넷 연결이 제한되거나 산발적인 경우가 많기 때문입니다. 이 문제를 해결하기 위해서는 머신 러닝(ML)과 데이터 수집을 네트워크 에지로 확장해야 합니다.
에지에서 의사결정 간소화하기
우리는 Oracle Roving Edge Device(RED)를 Oracle Data Platform에 포함해 구성함으로써 이 도전 과제를 해결할 수 있습니다. 각 RED는 데이터로부터 인사이트를 수집, 저장, 실행, 관리, 확보할 수 있도록 설계됩니다. 또한 RED는 에지에서 의사결정 프로세스 및 제조 장비 관리를 자동화할 수 있는 역량을 제조업체에 부여합니다. 제조업용 Oracle Data Platform에는 이상 감지 기능도 포함되어 있습니다. 이 기능은 제조 라인 중단 문제를 해결하고, 유지관리 관련 인사이트를 제공해 문제의 완화 및 수정 작업을 개선하는 데 사용될 수 있습니다.
다음 아키텍처는 Oracle Data Platform이 첨단 분석 및 머신러닝을 에지에서 배포함으로써 공장 데이터 통합을 지원하고, 이상을 감지하고, 스마트한 데이터 수집을 수행하고, 실시간 운영 정보를 제공하는 방식을 보여줍니다.
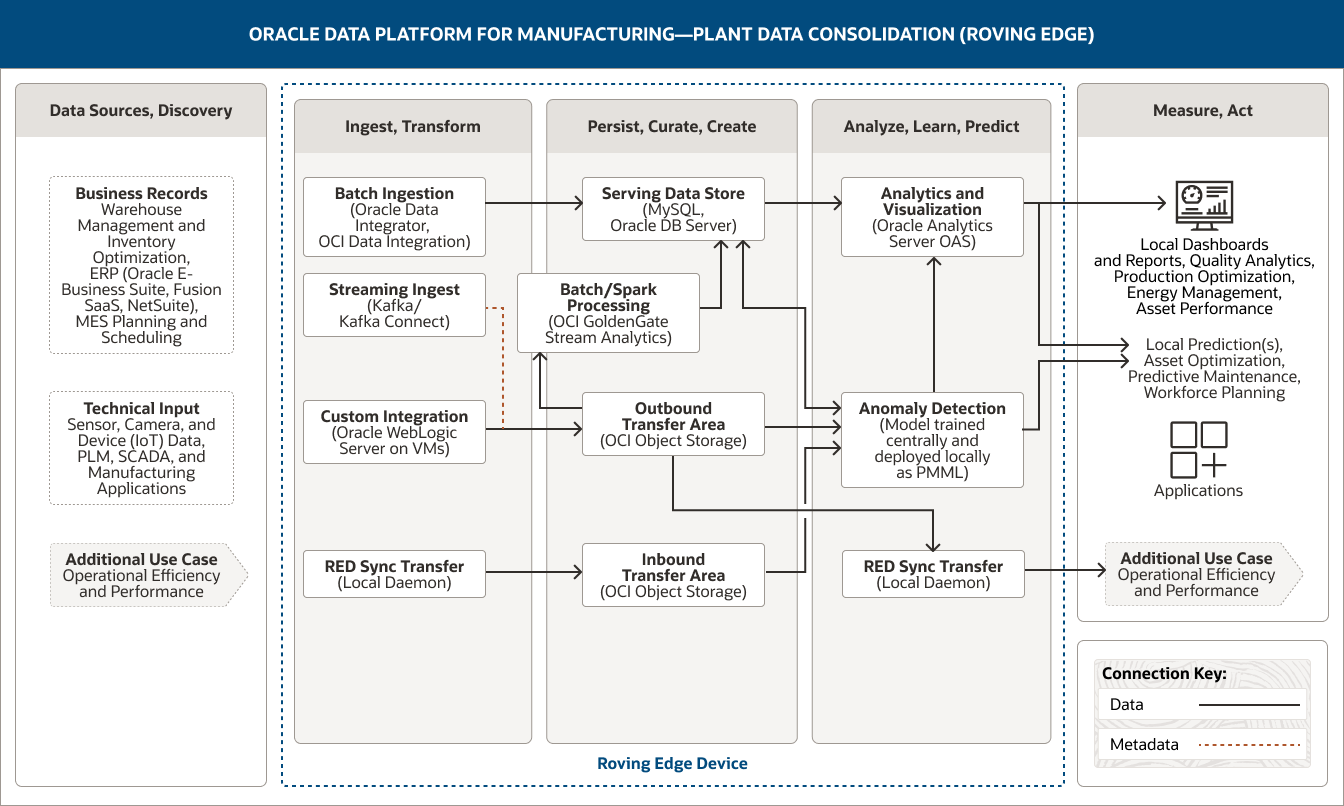
이 이미지는 제조업용 Oracle Data Platform을 사용해 공장 데이터를 통합하는 방법을 보여줍니다. 본 플랫폼의 구성 요소들은 다음의 5가지 제품군으로 분류됩니다:
- 1. 데이터 소스, 검색
- 2. 수집, 변환
- 3. 유지, 선별, 생성
- 4. 분석, 학습, 예측
- 5. 측정, 실행
데이터 소스, 검색 제품군에는 2가지 범주의 데이터가 포함됩니다.
- 1. 비즈니스 기록 데이터는 웨어하우스 관리 및 재고 최적화 데이터, ERP(Oracle E-Business Suite, Fusion SaaS, NetSuite) 데이터 및 MES 계획 수립 및 일정 관리 데이터로 구성됩니다.
- 2. 기술 입력 데이터에는 센서, 카메라, 장치(IoT) 데이터 및 PLM, SCADA, 제조 애플리케이션으로부터 수집한 데이터가 포함됩니다.
수집, 변환 제품군은 4가지 기능으로 구성됩니다.
- 1. 일괄 수집은 Oracle Data Integrator와 OCI Data Integration을 사용합니다.
- 2. 스트리밍 수집은 Kafka Connect를 사용합니다.
- 3. 맞춤 통합은 VM 기반 Oracle WebLogic Server를 사용합니다.
- 4. RED 동기화 전송은 로컬 데몬을 사용합니다.
배치 수집은 서비스 데이터 저장소에 단방향으로 연결됩니다.
스트리밍 수집 및 맞춤형 통합은 아웃바운드 전송 영역에 단방향으로 연결됩니다.
RED 동기화 전송은 인바운드 전송 영역에 단방향으로 연결됩니다.
유지, 선별, 생성 제품군은 4가지 기능으로 구성됩니다.
- 1. 서비스 데이터 저장소는 MySQL 및 Oracle DB 서버를 사용합니다.
- 2. 일괄 처리/Spark 처리는 OCI GoldenGate Stream Analytics를 사용합니다.
- 3. 아웃바운드 전송 영역은 OCI Object Storage를 사용합니다.
- 4. 인바운드 전송 영역은 OCI Object Storage를 사용합니다.
이상의 기능들은 해당하는 제품군 내에서 서로 연결됩니다. 일괄/Spark 처리는 서비스 데이터 저장소에 단방향으로 연결됩니다.
아웃바운드 전송 영역은 일괄/Spark 처리에 단방향으로 연결됩니다.
3가지 기능이 분석, 학습, 예측 제품군에 연결됩니다:
서비스 데이터 저장소는 분석 및 시각화 기능에 단방향으로 연결되고, 이상 감지 기능에 양방향으로 연결됩니다. 아웃바운드 전송 영역은 이상 감지 및 RED 동기화 전송 기능에 단방향으로 연결됩니다.
인바운드 전송 영역은 이상 감지 기능에 단방향으로 연결됩니다.
분석, 학습, 예측 제품군은 3가지 기능으로 구성됩니다.
- 1. 분석 및 시각화 기능은 Oracle Analytics Server를 사용합니다.
- 2. 이상 감지 기능은 중앙에서 학습되고 로컬 영역에서 PMML로 배치된 모델을 사용합니다.
- 3. RED 동기화 전송 기능은 로컬 데몬을 사용합니다.
이상 감지 기능은 제품군 내 분석 및 시각화 기능에 단방향으로 연결됩니다.
3가지 기능이 측정, 실행 제품군에 연결됩니다. 분석 및 시각화 기능은 로컬 대시보드 및 보고서, 로컬 예측 기능에 단방향으로 연결됩니다. 이상 감지 기능은 로컬 예측 기능에 단방향으로 연결되고, RED 동기화 전송 기능은 추가 사용 사례에 단방향으로 연결됩니다.
측정, 실행 제품군은 통합 공장 데이터의 사용 방식을 수집합니다. 이와 같은 잠재 사용 방식은 4개의 그룹으로 분류됩니다.
- 첫 번째 그룹에는 로컬 대시보드와 보고서가 포함됩니다.
- 두 번째 그룹에는 로컬 예측이 포함됩니다.
- 세 번째 그룹에는 애플리케이션이 포함됩니다.
- 네 번째 그룹에는 운영 효율성 및 성과에 해당하는 추가 사용 사례가 포함됩니다.
Oracle Roving Edge Device는 3개의 중심 제품군—수집, 변환/유지, 선별, 생성/분석, 학습, 예측—을 지원합니다.
제조업체가 운영 효율성 및 성능에 대해 쉽게 이해할 수 있도록 돕기 위한, 데이터를 아키텍처에 주입하는 4가지 주요 방법이 있습니다.
- Oracle Integration Repository의 맞춤 통합은 사용자가 다양한 소스로부터 수집한 데이터(정형 및 비정형 데이터)를 통합하여 기기, 맞춤형 API 등과 상호작용할 수 있게 해 줍니다. 모든 애플리케이션 개발 유형(예: 독립형 Java 또는 Python 코드, Oracle WebLogic Server 기반 애플리케이션, Kubernetes 기반 애플리케이션)의 데이터를 수집할 수 있습니다. 데이터는 추가 세분화, 아웃바운드 전송 또는 AI 모델 훈련을 위해 객체 스토리지에 저장됩니다.
- RED 데이터 동기화는 중앙 위치에서(예: Oracle Cloud Infrastructure(OCI) 내 학습된 모델의 객체 스토리지 저장소) 에지로 ML 모델을 전송하기 위한 효율적이고 단순한 방법입니다. 이 사용 사례에서 에지의 정의는 공장 내에 RED가 다른 기기들과 함께 배치됨을 의미합니다. 새로운 버전의 모델들은 '독립형' Predictive Model Markup Language(PMML) 형식으로 저장됩니다. 로컬 데몬은 새로운 모델이 발견되는 경우 업데이트를 수행하며, 이를 RED로 자동으로 푸시합니다. RED 데이터 동기화는 하루종일 다양한 RED가 수집한 모든 데이터를(예: 유의미한 이상 징후, 신호 등) 중앙 위치, 대체로는 OCI 기반 객체 스토리지로 전송하는 좋은 방법이기도 합니다. 이 데이터는 운영 보고서 작성 및 ML 모델 훈련에 사용됩니다. 이 RED 데이터 동기화 프로세스에 관여하는 데이터의 양이 에지-데이터 센터 통신과 위성 대역폭 중 어떤 것이 필요한지 결정하는 요인이 됩니다.
- 일괄 수집은 Oracle Data Integrator를 사용합니다. Oracle Data Integrator는 대용량, 고성능 일괄 로드에서부터 이벤트 기반, Trickle-Feed 수집 프로세스 및 SOA 지원 데이터 서비스에 이르기까지 모든 데이터 통합 요구 사항을 처리하는 종합 데이터 통합 솔루션입니다. 실시간 수집에 대한 니즈가 진화하는 한편, ERP, 계획 수립, 웨어하우스 관리, 운송 관리 시스템의 가장 흔한 추출 방식은 추출, 변환 및 로드 또는 추출, 로드 및 변환 프로세스를 사용하는 것입니다. 이와 같은 추출은 10분 또는 15분 간격으로 자주 이루어질 수 있지만, 개별 트랜잭션이 아닌 트랜잭션 그룹 단위로 데이터를 추출 및 처리하는 만큼 본질적으로는 대량 수집에 해당하는 방식입니다. OCI는 배치 수집을 처리하기 위해 다양한 서비스를 제공하며, 여기에는 네이티브 OCI Data Integration 서비스 및 OCI Compute 인스턴스에서 실행되는 Oracle Data Integrator가 포함됩니다. 데이터의 양 및 유형에 따라 데이터를 객체 스토리지로 로드하거나, 영구적 저장을 위해 정형 관계형 데이터베이스로 직접 로드할 수 있습니다.
- 여러 소스로부터 수집한 데이터에 대한 실시간 분석은 제조 기업들에게 운영 효율성 및 전반적인 성능에 대한 가치 있는 인사이트를 제공하는 데 도움을 줄 수 있습니다. Oracle Data Platform은 스트리밍 수집을 사용하여 SCADA(supervisory control and data acquisition) 시스템, 프로그래밍 가능한 논리 제어, 배치 자동화 시스템 등 여러 ISA-95 Level 2 시스템으로부터의 데이터 스트림을 수집합니다. 스트리밍 데이터(이벤트)가 수집되고, 데이터가 객체 스토리지에 저장되기 전에 몇 가지 기본 변환/집계가 수행됩니다. 스트리밍 분석은 서로 연관된 이벤트들을 식별하는 데 사용될 수 있으며, 식별된 패턴은 원시 데이터에 대한 데이터 과학 조사를 위해 (수동으로) 전달될 수 있습니다. 기존 분석 도구는 저장된 데이터로부터만 정보를 추출하는 반면 스트리밍 분석은 전송 중인 데이터로부터, 즉 실시간으로 데이터의 가치를 평가합니다.
데이터 지속성 및 처리는 3개의 구성 요소를 기반으로 구축됩니다.
- 서비스 데이터 저장소 내의 데이터는 데이터 처리를 위해 Oracle Database Server 또는 MySQL이 관리합니다. 서비스 데이터 저장소는 SQL 기반 도구를 통해 최종 사용자에게 데이터를 직접 제공하기 위해 사용되는 영구 관계형 계층을 제공합니다. 또한 전문 분석을 위한 서비스 계층 역할도 수행합니다.
- 데이터 소스로부터 원시 형식(네이티브 파일 또는 추출)으로 수집된 모든 데이터는 객체 스토리지에 수집 및 로드되어 현재 또는 미래의 ML 모델 교육에 사용됩니다. 클라우드 객체 스토리지는 Oracle 데이터 플랫폼을 위한 가장 일반적인 데이터 영구 계층으로, 인바운드 전송 영역 및 아웃바운드 전송 영역의 역할을 모두 수행합니다. 또한 정형 및 비정형 데이터 저장에도 사용할 수 있습니다.
- 객체 스토리지를 주요 데이터 영구 계층으로 사용하는 OCI GoldenGate Stream Analytics는 주요한 처리 엔진입니다. 일괄 처리는 기본 노이즈 처리, 누락된 데이터 관리, 사전 정의된 아웃바운드 데이터 세트에 기반한 필터링을 비롯한 여러 작업으로 구성된 과정입니다. 처리된 데이터는 요구되는 처리 방식 및 사용된 데이터 유형에 따라 객체 스토리지의 다양한 계층 또는 영구 관계형 저장소에 다시 작성됩니다.
분석, 학습, 예측 역량은 2가지 기술을 바탕으로 구축됩니다.
- 분석 및 시각화 서비스는 묘사 분석(히스토그램 및 차트를 사용한 현재 트렌드 설명), 예측 분석(미래 이벤트 예측, 트렌드 파악, 불확실한 결과의 가능성 예측), 규범 분석(최적의 의사결정으로 이어질 적절한 활동 제안)을 제공합니다. Oracle Analytics Server는 운영 보고 및 규범 분석과 관련된 묘사 분석을 제공합니다. 또한 ML 모델은 Oracle Analytics Server의 데이터 플로에 직접 내장될 수 있습니다. Oracle Analytics Server는 온프레미스에서 실행되도록 설계되었으며 대시보드, 보고, 경고, 셀프 서비스 데이터 준비 및 최종 사용자 중심 머신 러닝 알고리즘을 제공합니다. 제조 산업용 Oracle Data Platform은 완전히 개방적이고 유연합니다. 따라서 원하는 경우 이 플랫폼 대신 서드파티 도구를 사용할 수 있습니다.
- 고급 분석을 위한 사용 외에도, ML 모델은 이상 감지를 지원하기 위해 개발, 교육 및 배포됩니다. OCI Anomaly Detection은 주요 인시던트 발생 시 플래그를 지정해 개발자가 비즈니스 전용 이상 감지 모델을 더욱 손쉽게 구축할 수 있게 해 주는 AI 서비스로, 이상 감지 및 해결 속도를 높여줍니다. 이 모델들은 중앙 위치에서 훈련되고, PMML 형식으로 배포되어 Java 또는 Python 코드로 로컬에서 실행됩니다.
수익성 증대를 위해 의사결정 자동화하기
Oracle Data Platform은 제조업체가 가용한 모든 데이터로부터 최대의 가치를 창출하고, 동시에 데이터 액세스 및 스토리지를 간소화 및 단순화할 수 있게 해 줍니다. Oracle Roving Edge Devices를 통해 데이터 컬렉션 및 ML 점수 부여를 에지로 푸시하는 기능은 제조업체가 정확한 정보를 바탕으로 보다 효과적인 비즈니스 의사결정을 내릴 수 있게 해 줍니다. 제조업체가 필요할 때마다 데이터를 활용할 수 있기 때문에 효율성과 생산성을 높이고 비용을 절감할 수 있습니다.
관련 리소스
-
사용 사례
데이터를 활용한 직장 내 보건 및 안전 개선
임직원의 보건과 건강 개선을 지원하는 고급 분석 기술을 갖춘 데이터 플랫폼으로 보다 안전한 제조 운영 환경을 구축하는 방법을 확인해 보세요.
-
사용 사례
데이터를 활용한 제조 운영 효율성 및 성과 개선
머신러닝으로 성과 개선을 지원하는 데이터 플랫폼을 사용하여 제조 운영을 보다 효율적으로 관리하는 방법을 확인해 보세요.
-
사용 사례
데이터를 활용해 사후 유지보수에서 예측적 유지보수로 전환하기
머신러닝을 바탕으로 예측적 유지보수를 지원하는 데이터 플랫폼을 활용하여 자산을 최적화하는 방법을 살펴보세요.
시작하기
30일 체험판으로 20개 이상의 Always Free 클라우드 서비스를 체험해 보세요.
Oracle이 제공하는 무료 체험을 통해 Autonomous AI Database, Arm Compute, Storage 등을 무기한 사용할 수 있으며 추가 클라우드 서비스를 체험할 수 있는 미화 300달러 상당의 무료 크레딧이 함께 제공됩니다. 자세한 내용을 확인하고 지금 바로 무료 계정을 생성해 보세요.
-
Oracle Cloud Free Tier에는 어떤 항목이 포함되어 있나요?
- Autonomous AI Database 인스턴스 2개, 각 20GB
- AMD 및 Arm Compute VM
- 총 200GB의 블록 스토리지
- 10GB의 객체 스토리지
- 매달 10TB의 아웃바운드 데이터 전송
- 10개 이상의 Always Free 서비스
- 30일 동안 사용 가능한 미화 300달러 상당의 무료 크레딧
단계별 안내에 따라 학습하기
튜토리얼 및 실습을 통해 다양한 OCI 서비스를 경험해볼 수 있습니다. 개발자, 관리자, 분석가, 각 사용자에 적합한 방식으로 OCI 작동 방법을 보여드리겠습니다. 대부분의 실습은 Oracle Cloud 무료 체험, 또는 Oracle에서 제공하는 무료 실습 환경에서 실행됩니다.
-
OCI 핵심 서비스 시작하기
이 워크샵에 포함된 실습에서는 VCN(가상 클라우드 네트워크)과 컴퓨트 및 스토리지 서비스를 비롯한 OCI(Oracle Cloud Infrastructure) 핵심 서비스를 다룹니다.
OCI 핵심 서비스 실습 바로 시작하기 -
Autonomous AI Database 빠르게 시작하기
이 워크숍에서는 Oracle Autonomous AI Database를 시작하기 위한 단계를 안내합니다.
Autonomous AI Database 빠른 시작 실습 시작하기 -
스프레드시트에서 시작하는 앱 구축
이 실습에서는 스프레드시트를 Oracle Database에 업로드하여 생성한 새 테이블로 애플리케이션을 생성하는 과정을 소개합니다.
지금 실습 랩 시작하기
150개 이상의 모범 사례 디자인 살펴보기
Oracle의 아키텍트 및 기타 고객들이 엔터프라이즈 앱, HPC, 마이크로서비스, 데이터 레이크 등 다양한 워크로드를 배포하는 방식을 확인할 수 있습니다. 모범 사례들로부터 정보를 얻고, Oracle의 Built & Deployed 시리즈를 통해 고객사 아키텍트들이 공유하는 관련 내용들을 살펴보세요. '클릭하여 배포(click to deploy)' 기능을 활용하거나 Oracle의 GitHub 저장소에 직접 액세스하여 다양한 워크로드를 배포할 수도 있습니다.
인기 아키텍처
- MySQL Database 서비스를 사용하는 Apache Tomcat
- Jenkins를 사용하는 Kubernetes 기반 Oracle Weblogic
- 머신러닝(ML) 및 AI 환경
- Arm 환경의 Tomcat과 Oracle Autonomous AI Database
- ELK 스택을 활용한 로그 분석
- OpenFOAM를 사용하는 HPC
OCI에서의 비용 절감 효과 확인
Oracle Cloud는 저렴한 가격을 전 세계적으로 동일하게 적용하며, 간편하고 다양한 사용 사례를 지원합니다. 예상 요금 절감액을 확인하려면, 비용 계산기를 사용하여 필요에 맞게 서비스를 구성해보세요.
차이를 확인해보세요
- 1/4의 아웃바운드 대역폭 비용
- 가격 대비 컴퓨트 성능 3배
- 모든 리전에 동일하게 적용되는 저렴한 가격
- 장기 약정 없이 저렴한 가격 책정