Product Tour—Oracle Replenishment Planning
Leverage demand-driven planning
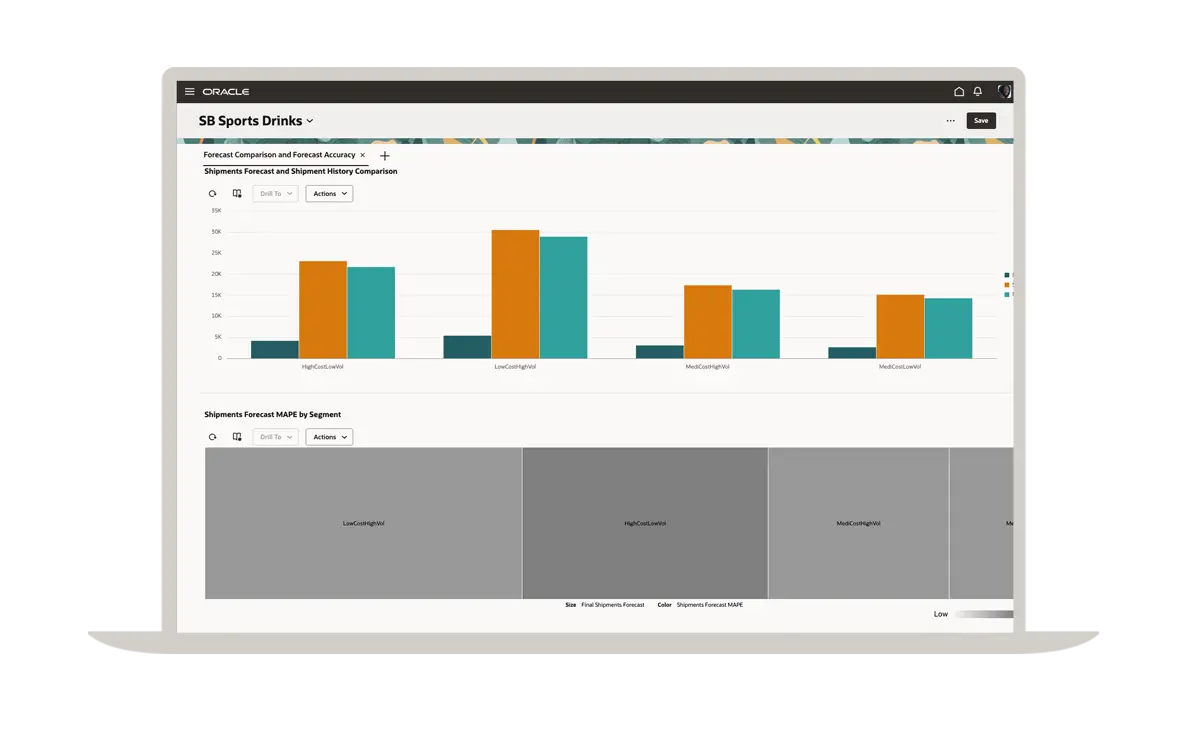
An effective replenishment plan starts with an accurate demand forecast. With Oracle Demand Management, you get the capabilities of a world-class demand planning solution, so you can easily manage new item launches, low-volume products, seasonality, and one-time events. Here you can see a comparison of shipment forecasts with shipment histories across various segments.
Manage by segments
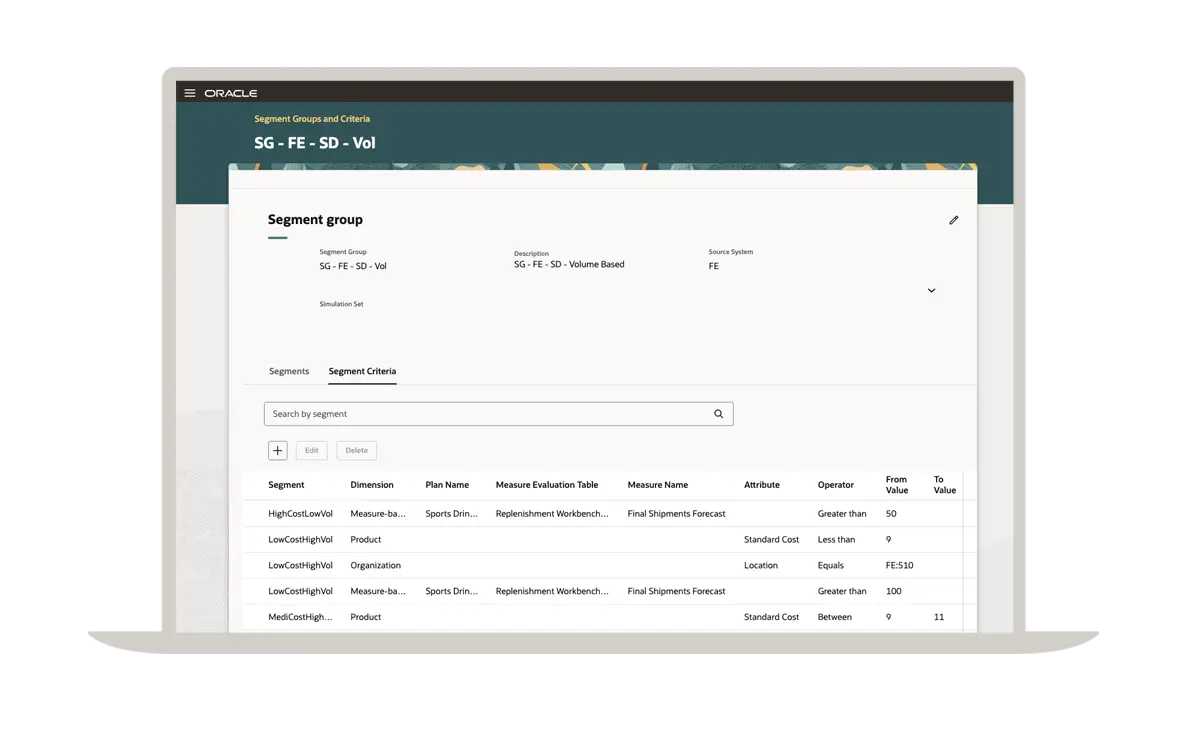
Demand patterns and inventory objectives can vary widely across replenishment locations. Divide your business into dynamic, rule-based segments with independent policies. For example, you can define segments based on cost, volume, volatility, and many other attributes. Here, segments are set up for low-, medium- and high-cost items.
Monitor performance
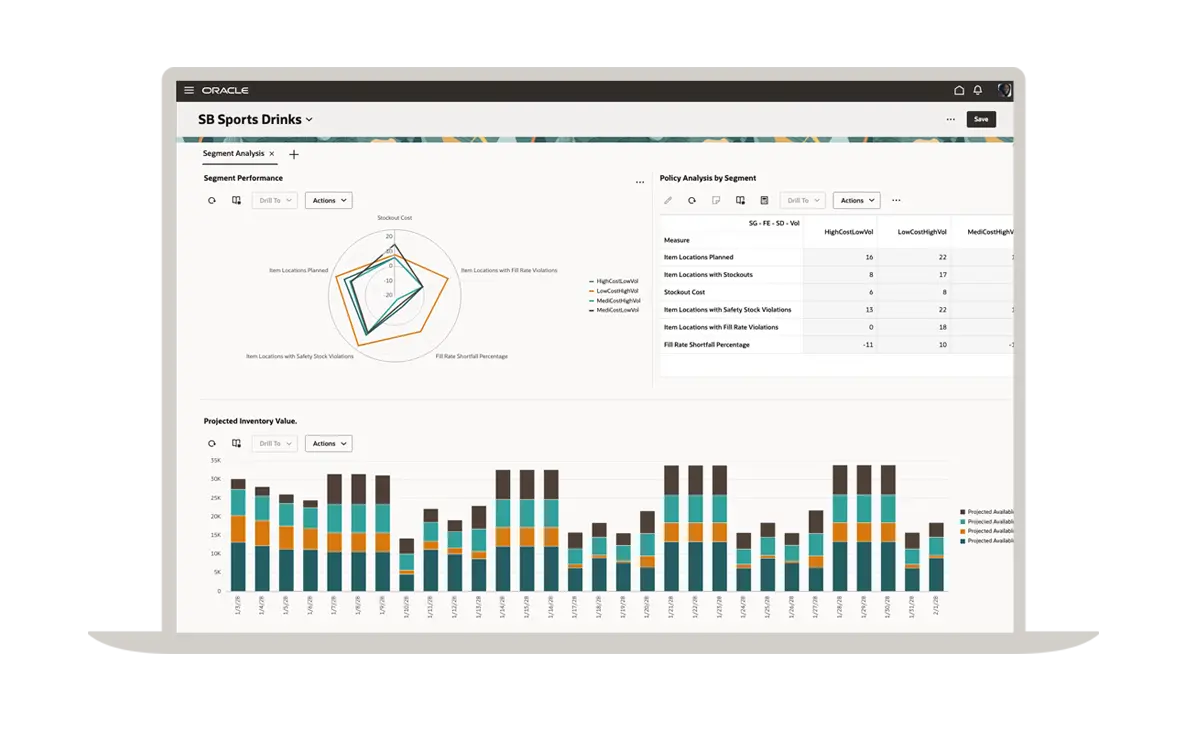
When you run a plan, you can see the effectiveness of your replenishment planning segments at a glance. Compare stockouts, fill rates, and costs to decide which segments need to be adjusted.
Prioritize issues
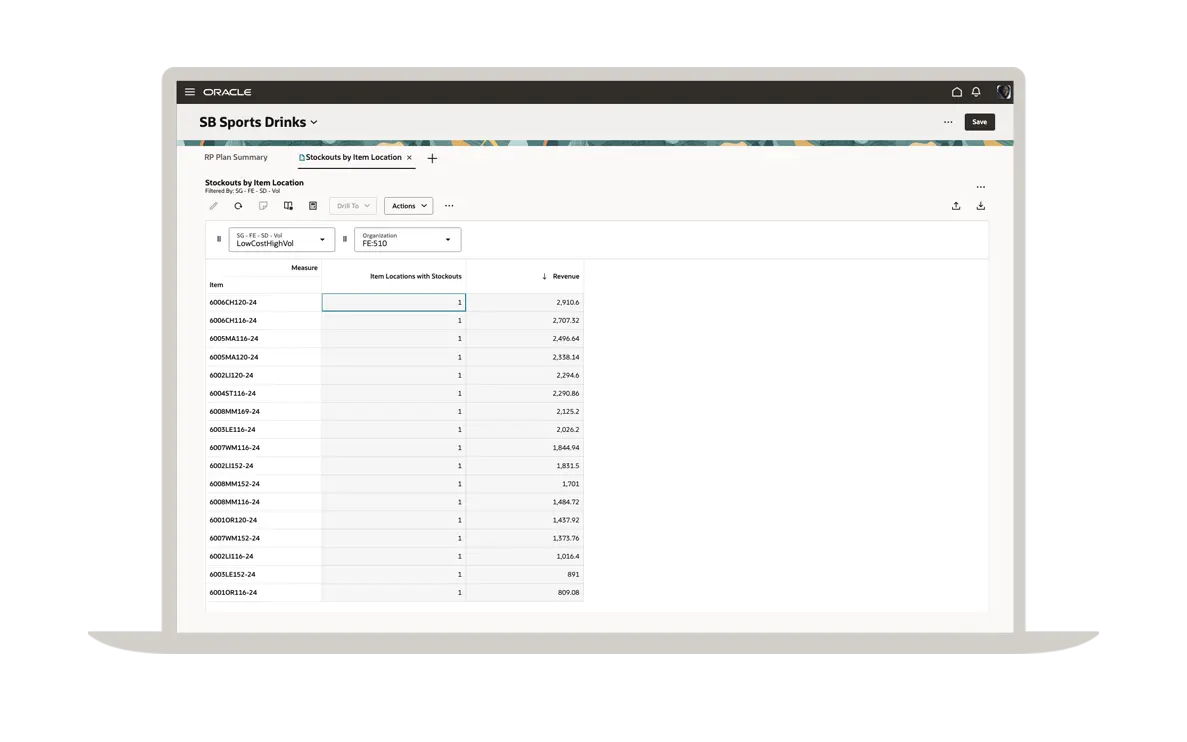
Quickly identify the specific items and locations that are performing poorly. Here you can see the fill rate shortfall percentages in decreasing order. This enables you to review the fill rate shortfall percentages for low-cost, high-volume items in a particular facility. You can click on any item to drill down to a workbench where you can address the issue.
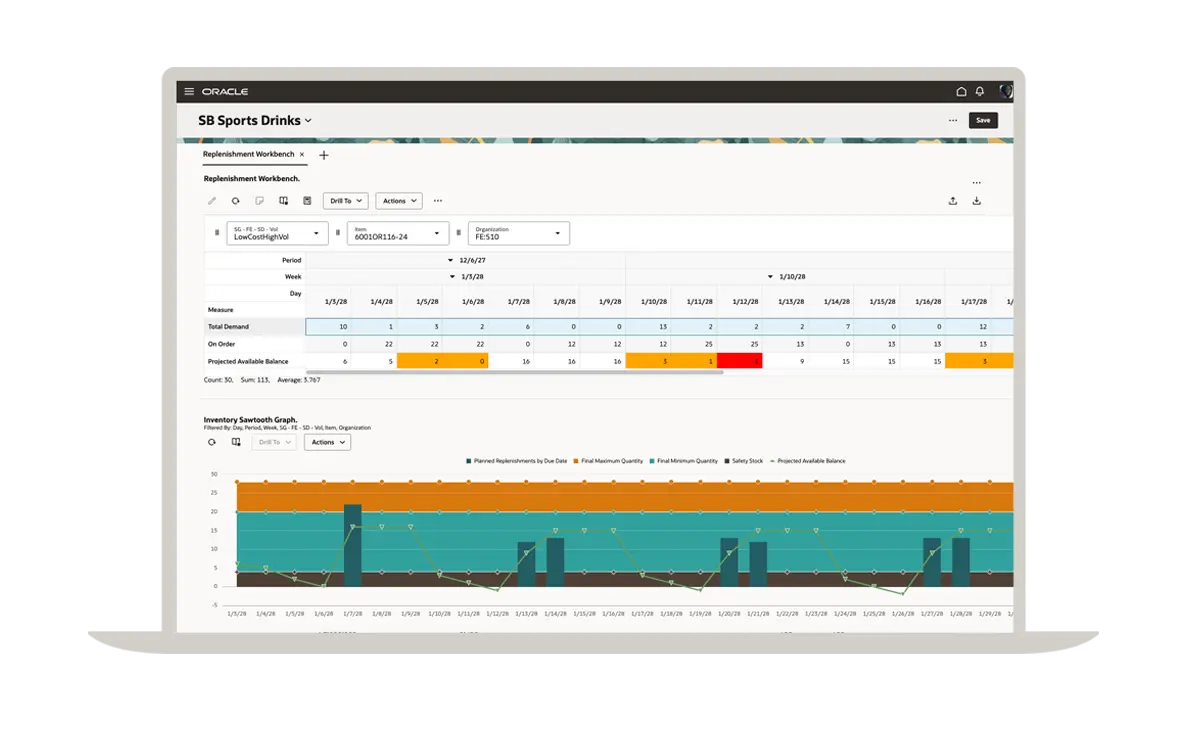
Explore an issue in depth
The replenishment planning workbench gives you a time-phased view of demand, supply, and planned replenishments, along with min-max inventory and safety stock thresholds. In this case, the maximum inventory threshold is too low to meet an upcoming demand spike, potentially triggering stockouts on 1/12 and 1/19.
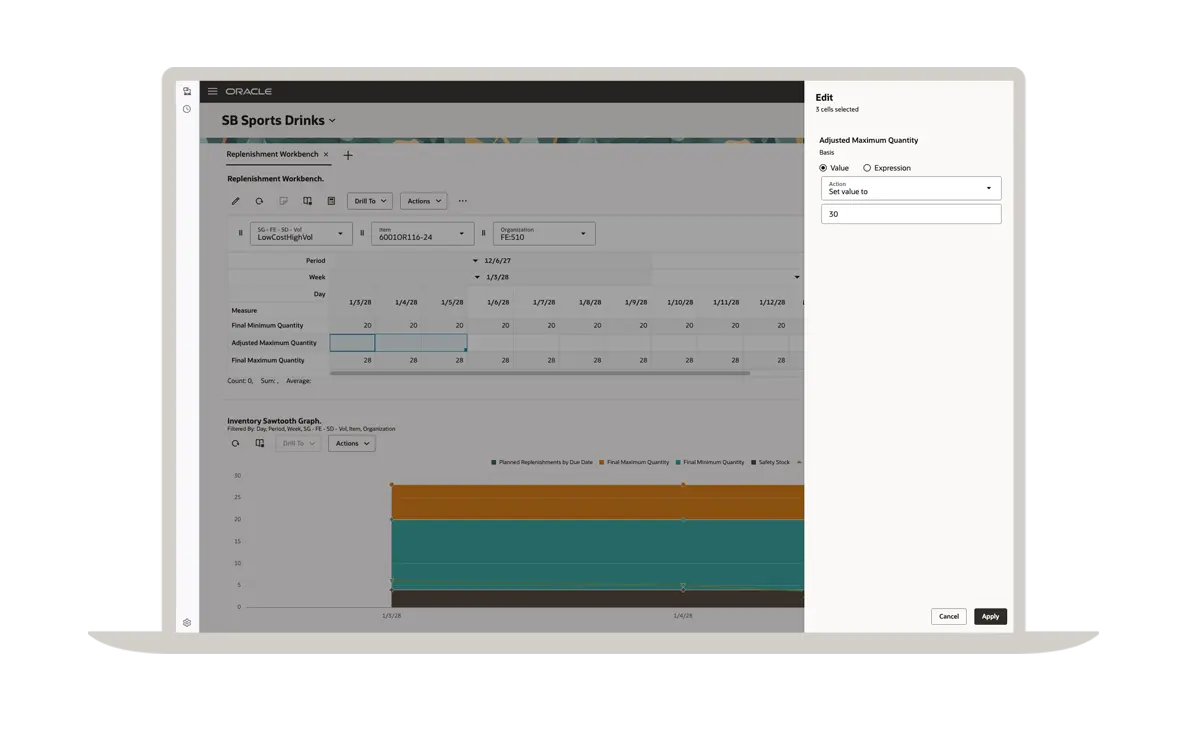
Adjust plans to simulate solutions
You can override policy parameters, adjust the demand forecast, and edit replenishment quantities to address one-time issues such as this one.
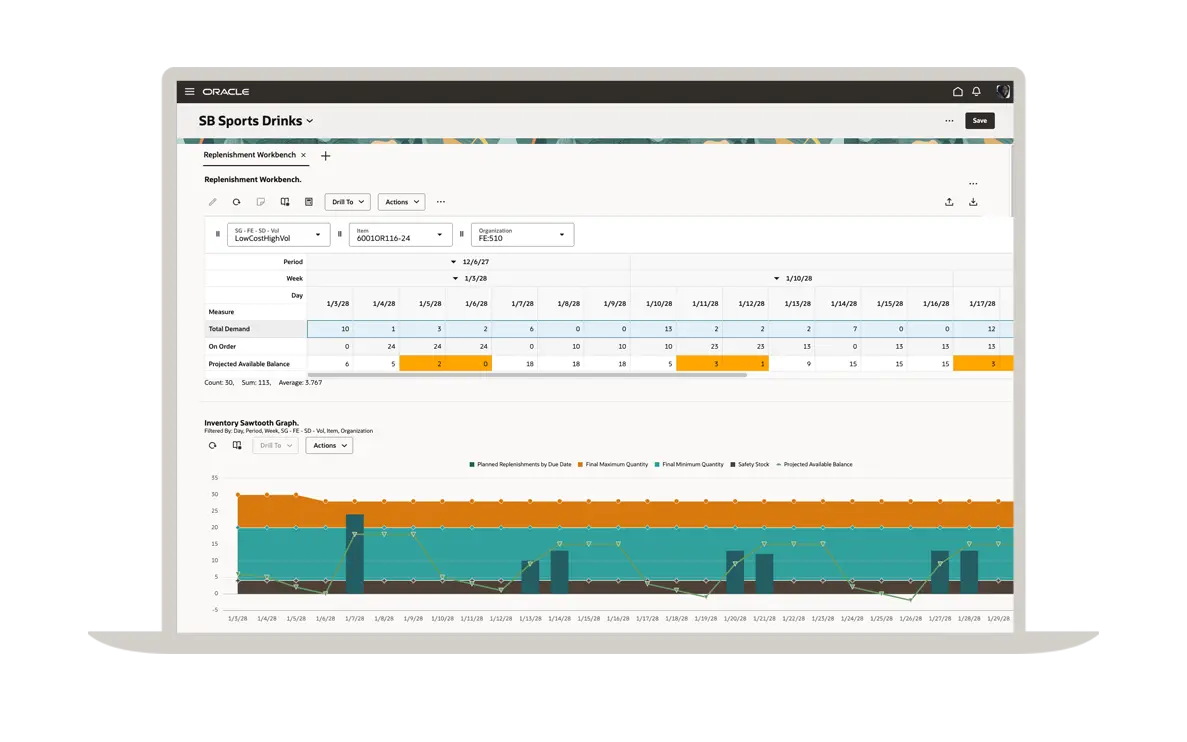
Review simulation results
Get immediate feedback on your changes. In this case, revising the min-max thresholds solved the stockout problem on 1/12.
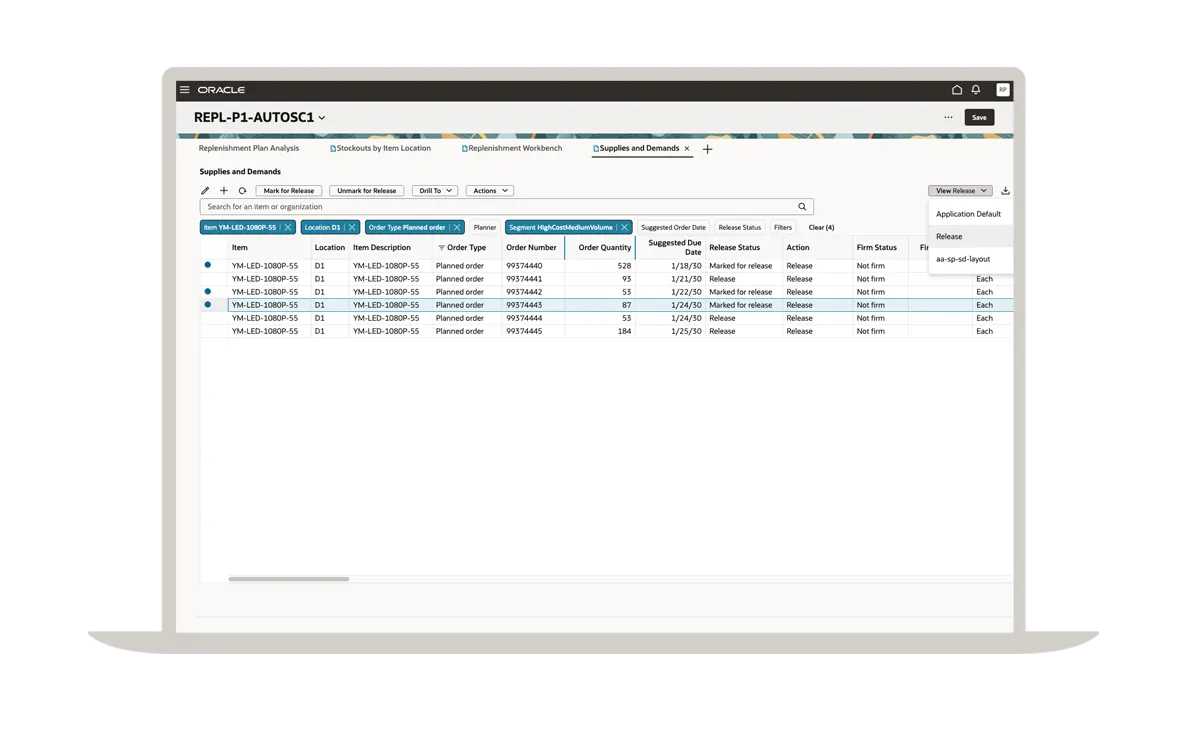
Release supply to execution systems
When you're satisfied with the results, you can review and release the planned replenishment orders.
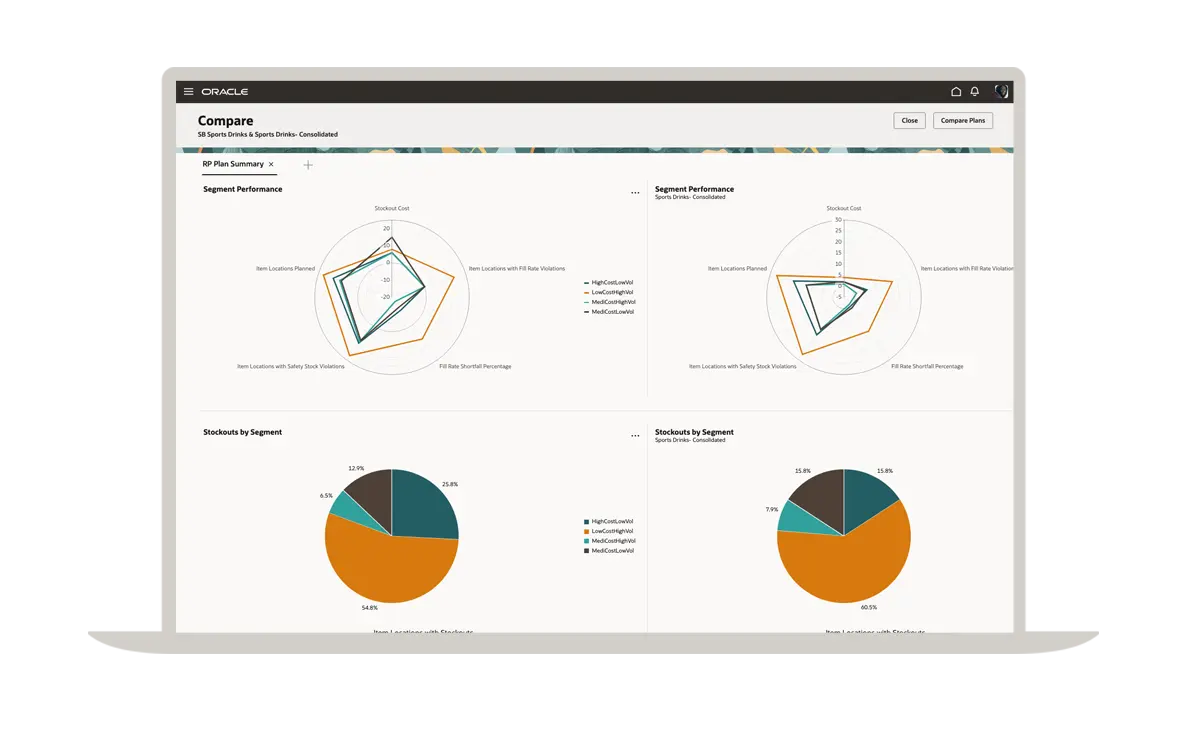
Compare before-and-after results
By simulating replenishment planning over an extended period, you can project your inventory investment, evaluate service level goals, and compare the impact of different policy parameters. Here you can see that resolving the stockout violations in the high-cost, high-volume segment has increased the projected fill rate and the total inventory investment.
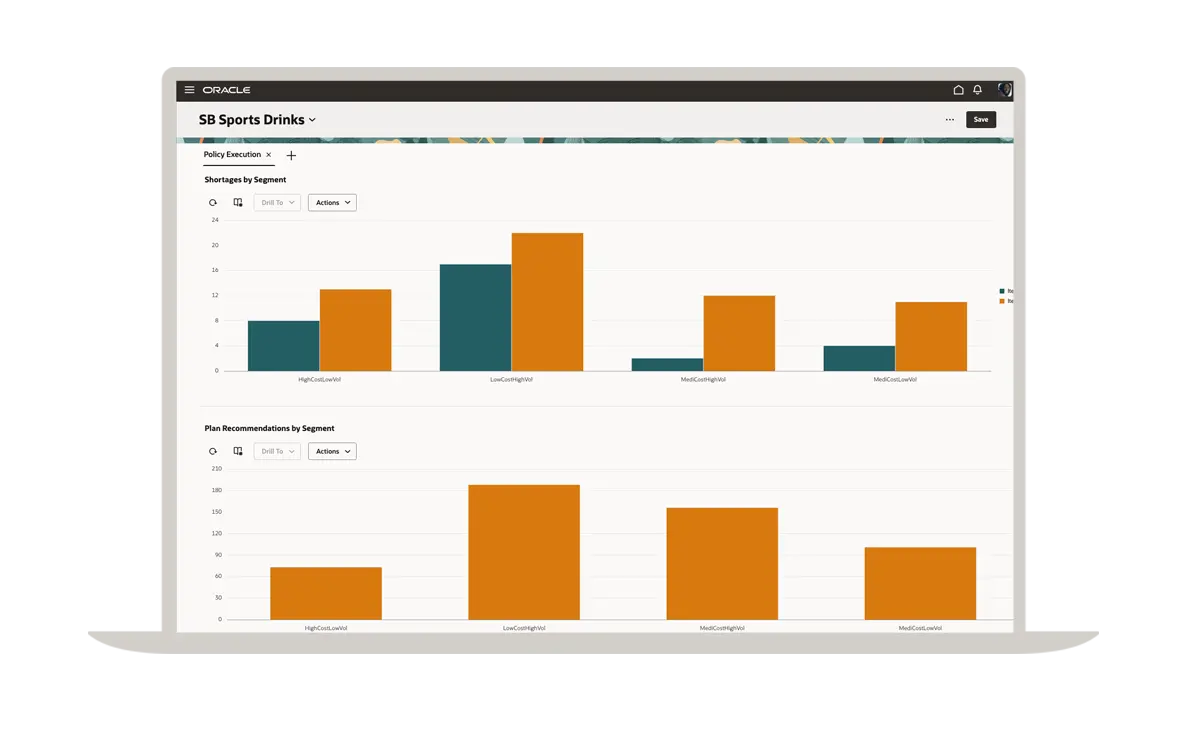
Automate the process
Once you've put the right policies into place, you may be able to replenish many products and locations simultaneously. Automated replenishment calculates requirements and releases planned orders whenever inventory positions are updated. Exception summaries highlight any issues. Here, 30 item locations appear to have shortages, which can be drilled down and addressed by segment if needed.
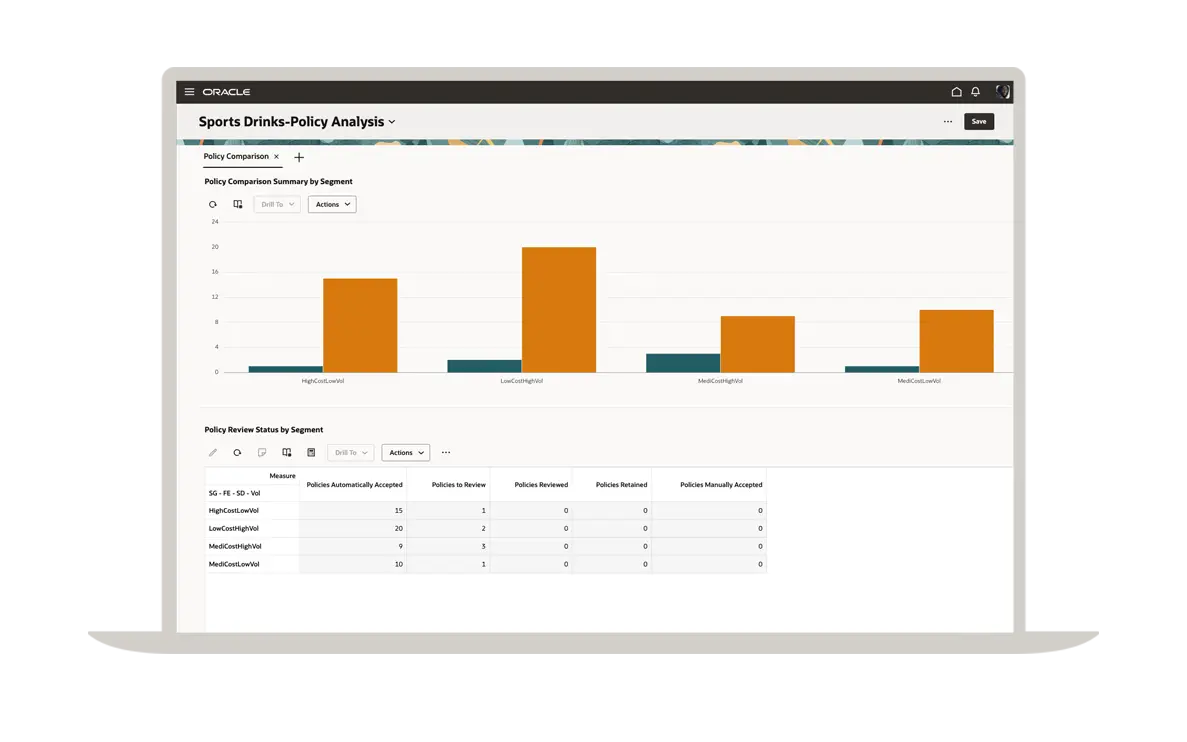
Review inventory policy effectiveness
You can compare the effectiveness of your active replenishment policies to your current business conditions. Here the newly calculated policies are automatically accepted if they’re within the thresholds. If the policy values are outside the defined thresholds, you can perform a policy review to accept, retain, or manually override the new policy values.
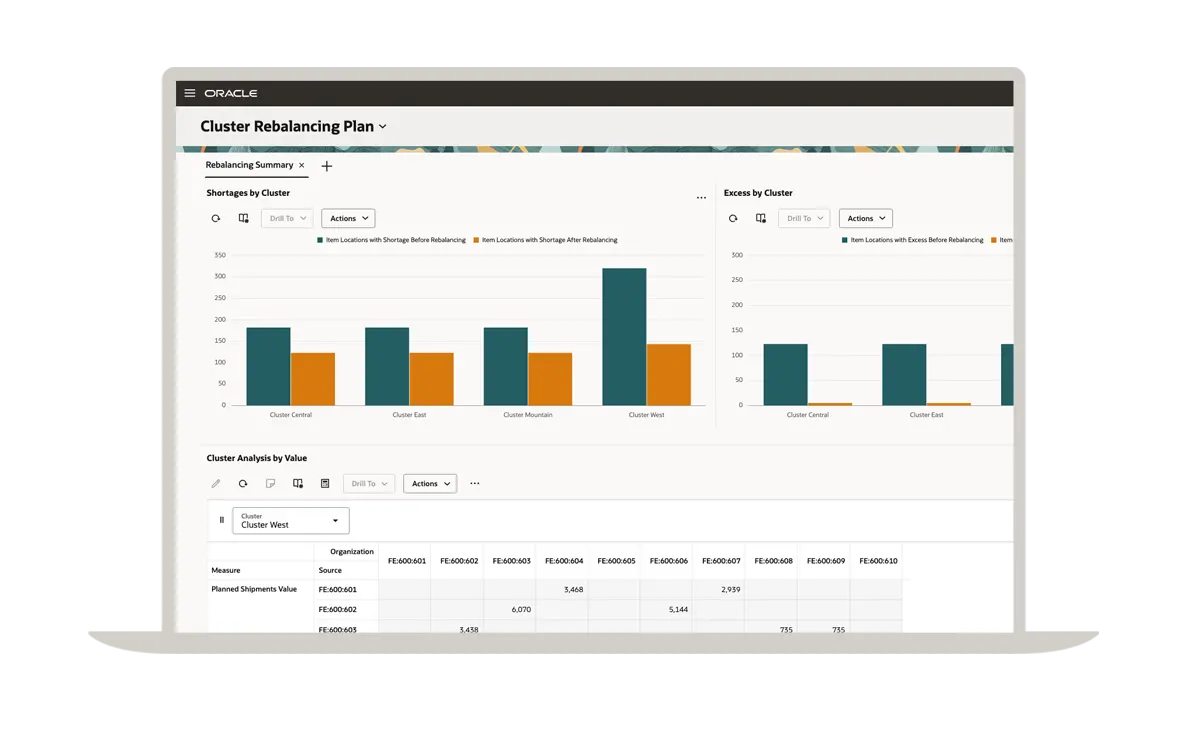
Rebalance inventory within a group of locations
Due to varying demand and supply, some facilities end up with excess inventory while others end up with a shortage. Excess inventory leads to increased holding costs and shortages lead to lost sales. In such scenarios, you can move inventory between nearby facilities to minimize the costs incurred by procuring material from upstream facilities or suppliers.