Exploring
and Visualizing Data Using Oracle Data Visualization Desktop
Exploring
and Visualizing Data Using Oracle Data Visualization Desktop Before You Begin
This 15-minute tutorial shows you how to use Oracle Data Visualization Desktop to explore and visualize the data within the Oracle Big Data Cloud.
This is the 4th tutorial in the Analyzing and Visualizing Data on Big Data Cloud series. Perform the tutorials sequentially.
- Creating a Trust Store File
- Configuring the Memory Settings for the Spark Thrift Server Process
- Connecting Oracle Data Visualization Desktop to Big Data Cloud
- Creating a Data Visualization Desktop Data Set
- Exploring and Visualizing Data Using Oracle Data Visualization Desktop
What Do You Need?
- Access to an instance of Big Data Cloud
- Oracle Data Visualization Desktop
 Create
a First Visualization (Trips by Age by Gender)
Create
a First Visualization (Trips by Age by Gender)
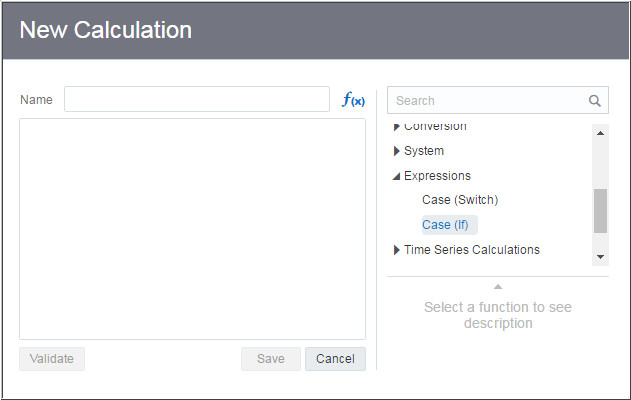
- Right-click My
Calculations and choose Add
Calculation.

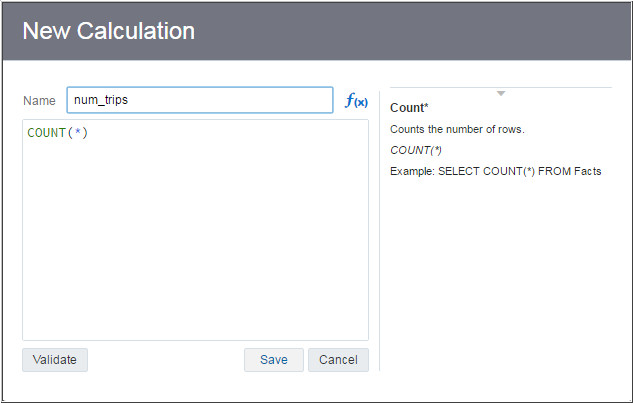
Description of the illustration a1.jpg - Expand Aggregate
and double-click Count(*). Enter
the Name as num_trips
and click Save.
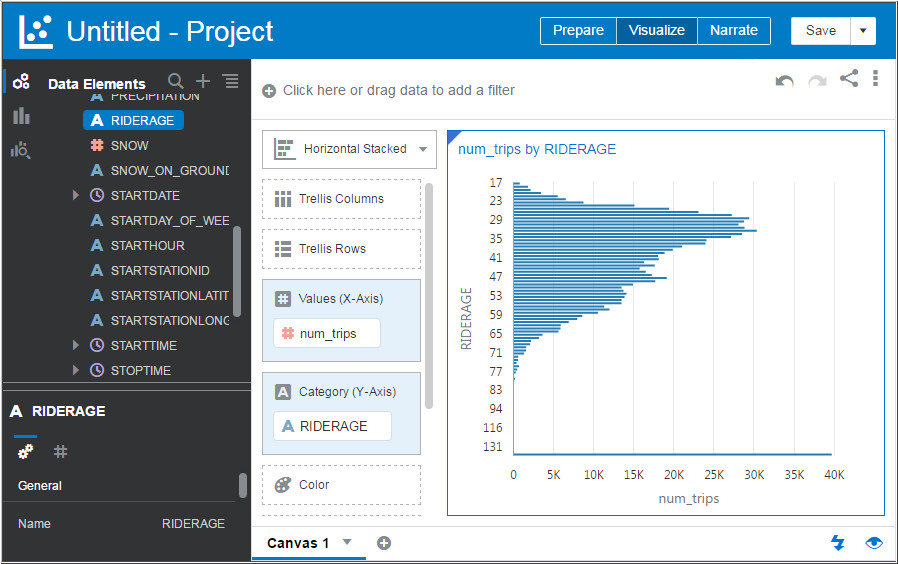
Description of the illustration a2.jpg - Drag num_trips and
RIDERAGE onto the
Canvas.
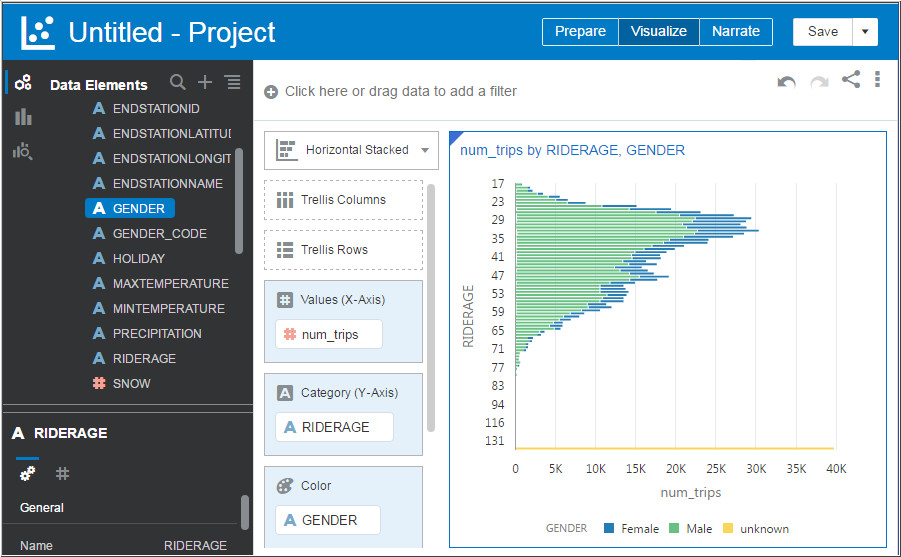
Description of the illustration a3.jpg - Drag GENDER on the
Color section and let the chart update.
Description of the illustration a4.jpg
 Create
a Second Visualization (Trips Per Hour)
Create
a Second Visualization (Trips Per Hour)
- Click the + sign next to Canvas1 to create a new canvas.
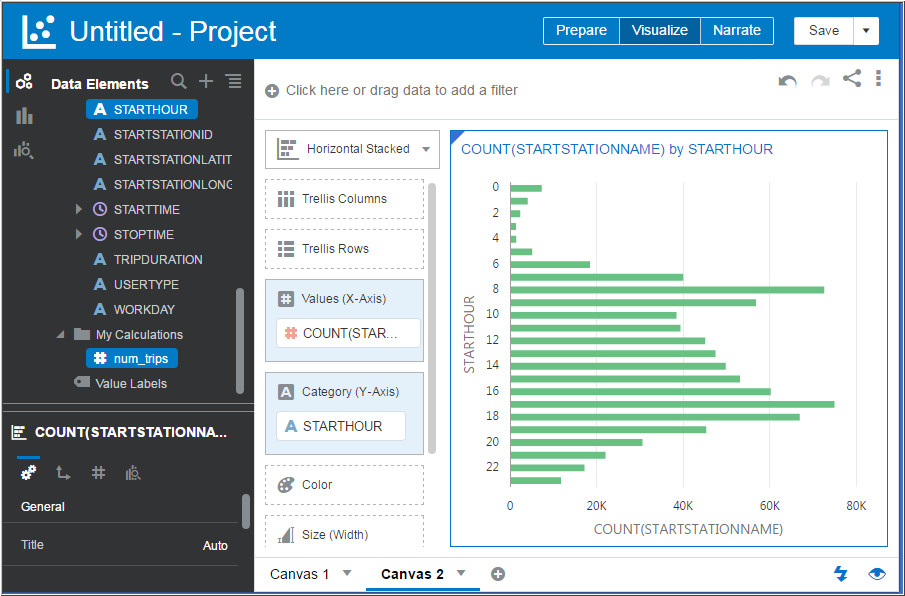
- Drag num_trips and
STARTHOUR onto the
canvas to visualize number of bike trips per hour.
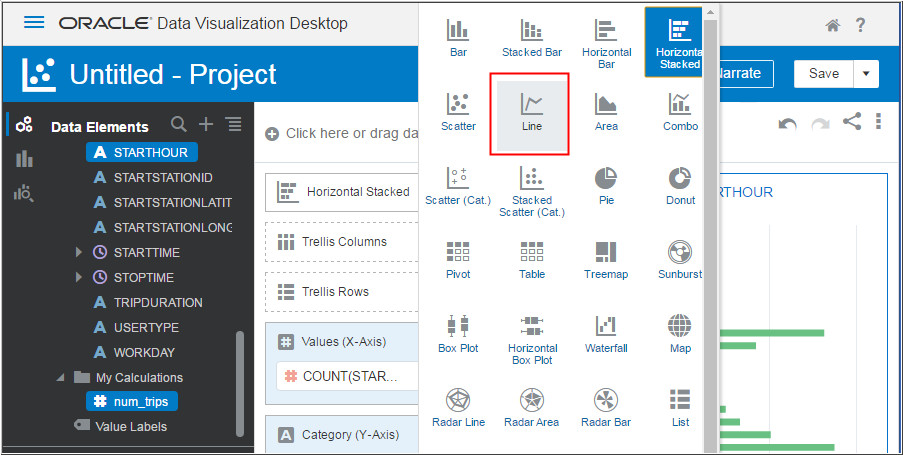
Description of the illustration b2.jpg - Click the Horizontal Stacked drop-down arrow and change the
visualization to Line.
Description of the illustration b3.jpg

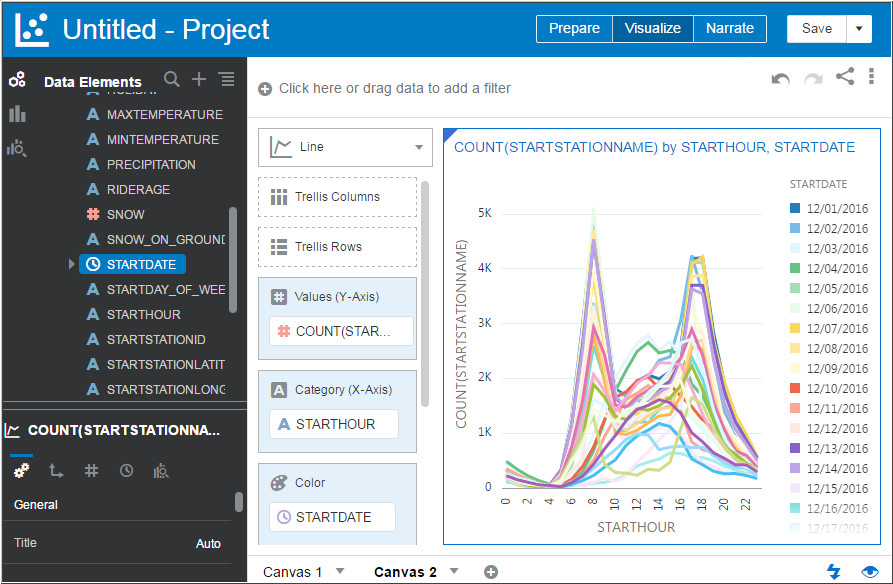
Description of the illustration b3_1.jpg - Drag the STARTDATE
to the Color Section and WORKDAY
to the Trellis Columns section to visualize number of bike
trips per hour based on startdate and workdays.
Description of the illustration b4.jpg 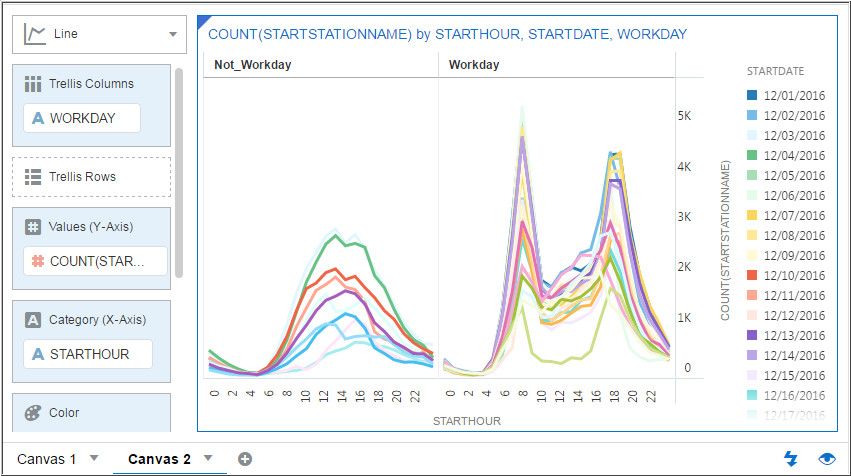
Description of the illustration b4_1.jpg
 Create
a Third Visualization (Trips per hour based on workdays and
weather)
Create
a Third Visualization (Trips per hour based on workdays and
weather)
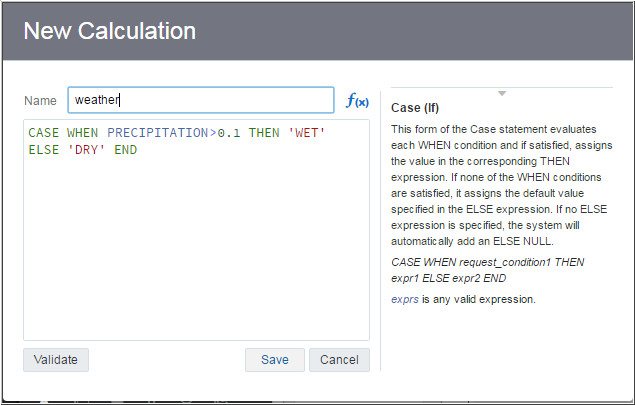
- Right-click My Calculations and select Add Calculation. Expand Expressions and double-click Case (If).
- Enter weather for
the Name and
CASE WHEN PRECIPITATION>0.1 THEN 'WET'
                    ELSE 'DRY' END
in the expression field.
Description of the illustration c2.jpg
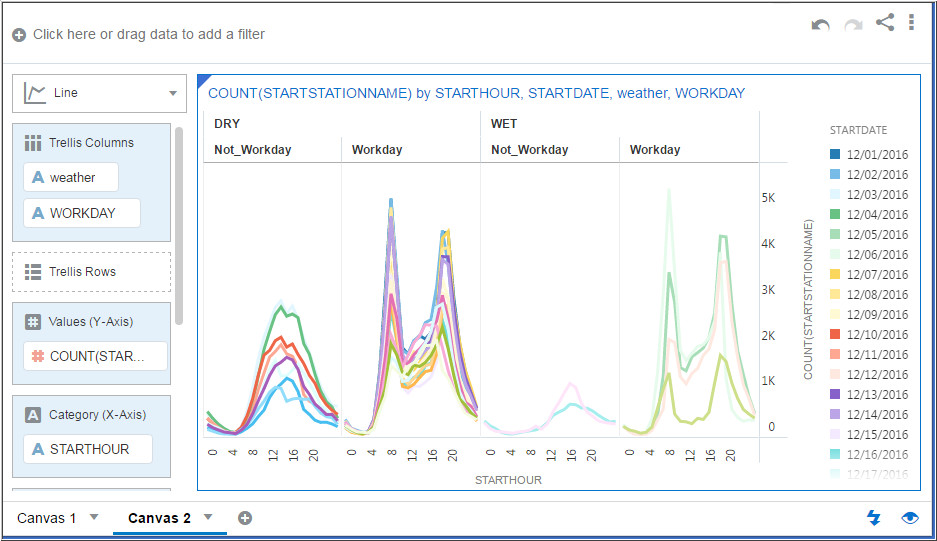
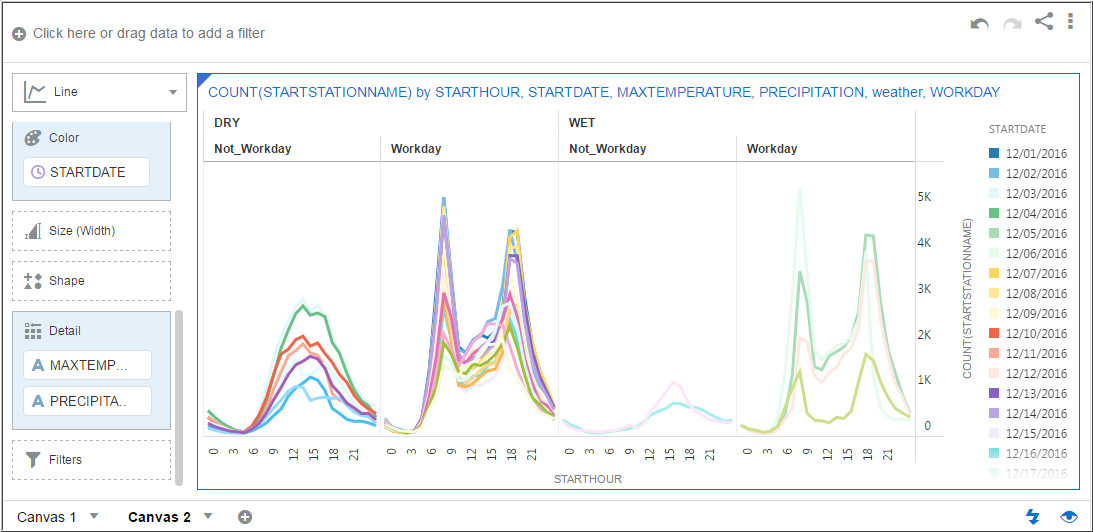
- Drag WEATHER to the
Trellis Columns section and PRECIPITATION
and MAXTEMPERATURE to
the Item (Detail) section.
Description of the illustration c3.jpg
Description of the illustration c3_1.jpg
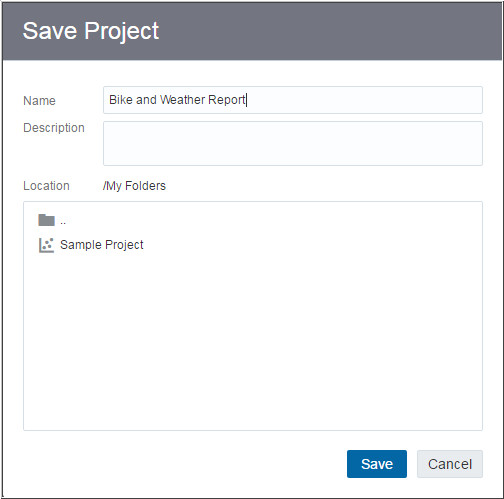
- Click Save to save
the project.Enter Bike and Weather Report as
the project name and click Save.
Description of the illustration c4.jpg