 Creating
a Data Visualization Desktop Data Set
Creating
a Data Visualization Desktop Data Set Before You Begin
This 10-minute tutorial shows you how to create a data set in Data Visualization Desktop.
This is the 4th tutorial in the Analyzing and Visualizing Data on Big Data Cloud series. Perform the tutorials sequentially.
- Creating a Trust Store File
- Configuring the Memory Settings for the Spark Thrift Server Process
- Connecting Oracle Data Visualization Desktop to Big Data Cloud
- Creating a Data Visualization Desktop Data Set
- Exploring and Visualizing Data Using Oracle Data Visualization Desktop
Background
Data visualization describes the presentation of abstract information in graphical form. Data visualization allows you to spot patterns, trends, and correlations that otherwise might go unnoticed in traditional reports, tables, or spreadsheets.
What Do You Need?
- Access to an instance of Big Data Cloud
- Oracle Data Visualization Desktop
 Create
a DV Desktop Data Set
Create
a DV Desktop Data Set
- Open Data Visualization Desktop.
- Click the Navigator
 icon and select Data.
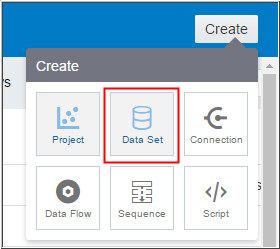
 - Click Create and
select Data Set.
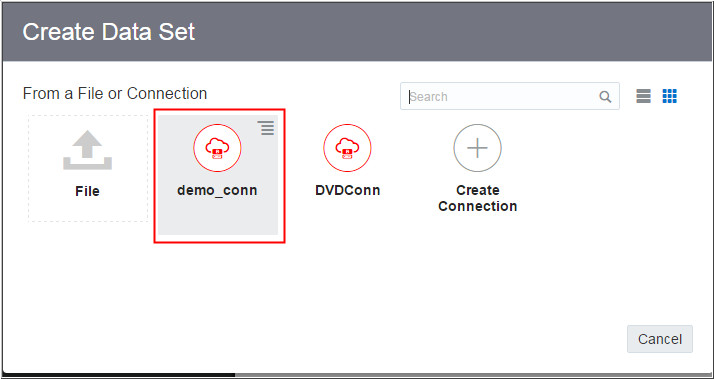
Description of the illustration a3.jpg - Select the demo_conn connection. Click
the default database.
Description of the illustration a4.jpg 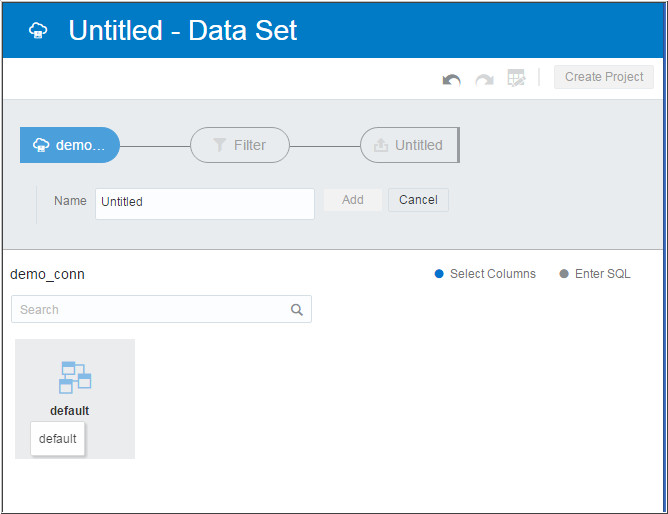
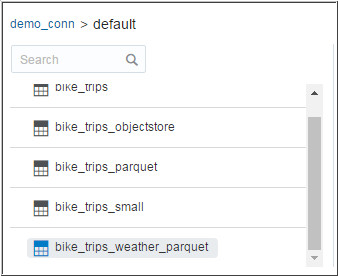
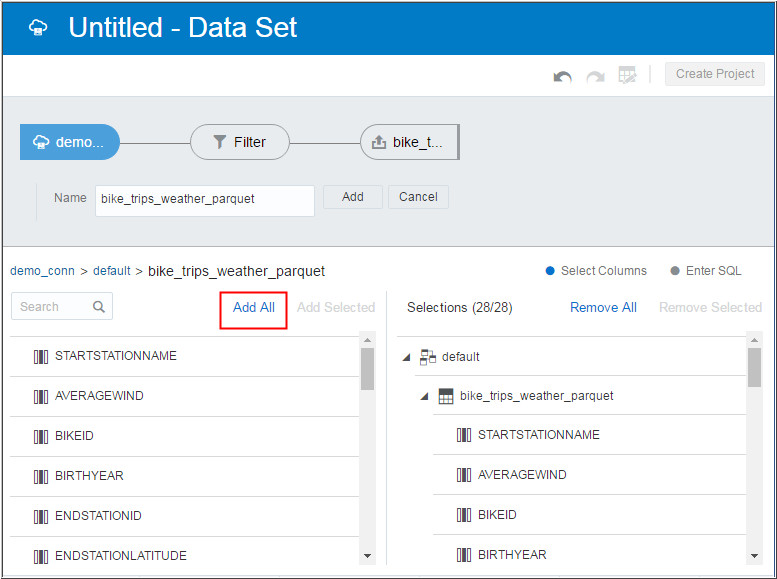
Description of the illustration a4_1.jpg - Select the bike_trips_weather_parquet
table. And click Add All
to add all the columns.
Description of the illustration a5.jpg
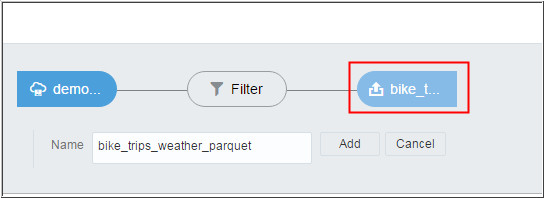
Description of the illustration a5_1.jpg - Click the upload icon next to the filter icon in the
dataflow pipeline.
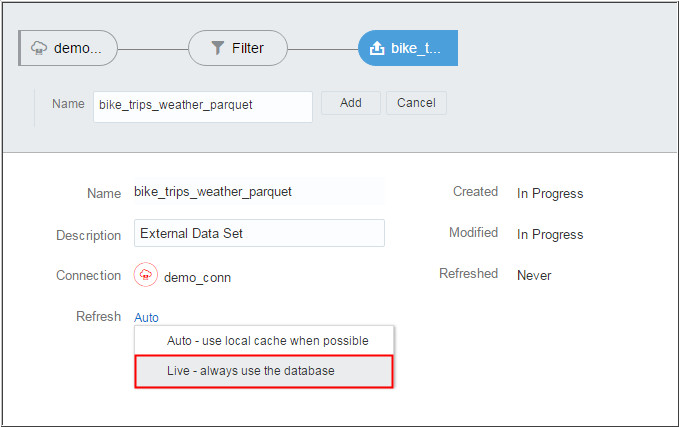
Description of the illustration a6.jpg - Click the Refresh
property and change the status to Live
- Always use the database.
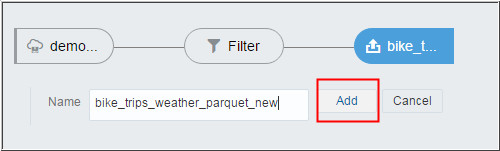
Description of the illustration a7.jpg - Enter a new name for data source and click Add.
It will take a moment while DVD inspects the data.
Description of the illustration a8.jpg 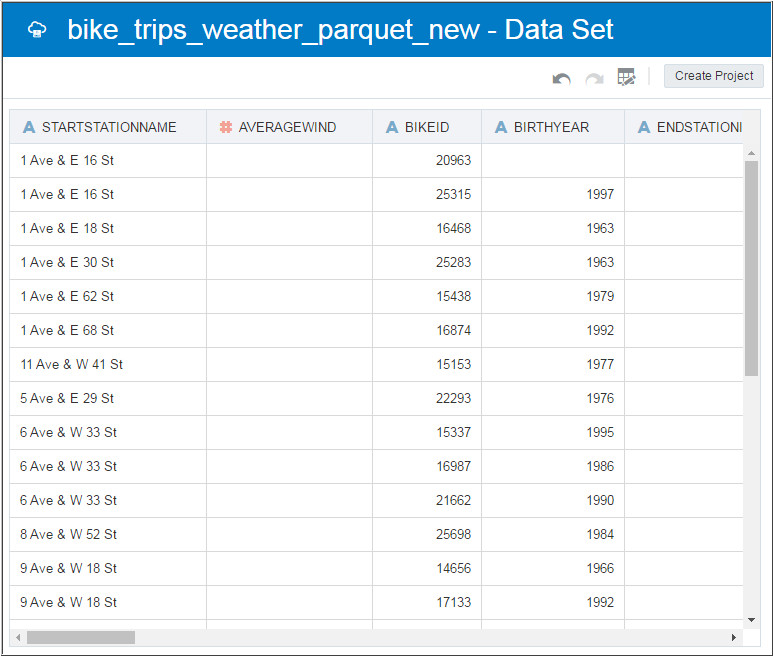
Description of the illustration a8_1.jpg - Scroll to the
PRECIPITATION column and click the
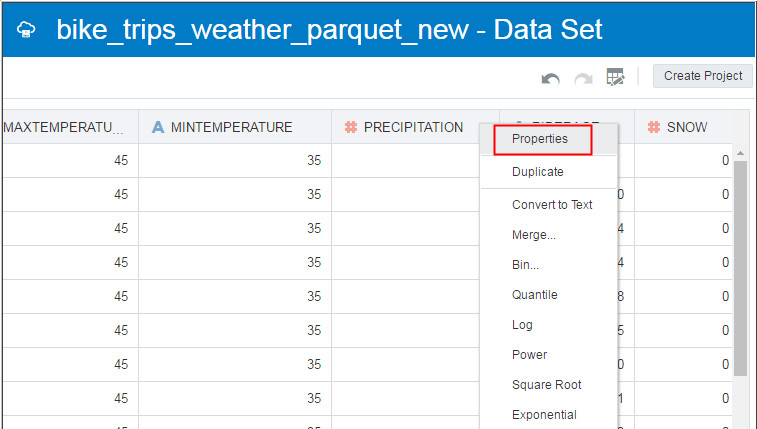
column header menu. Click
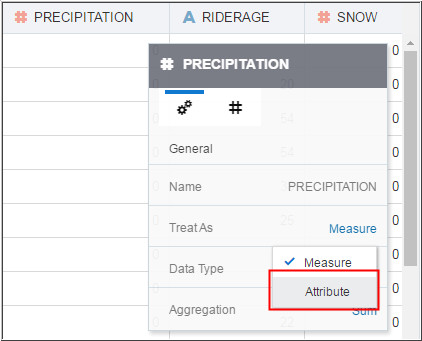
Properties and change Treat
As to attribute.
Description of the illustration a9.jpg
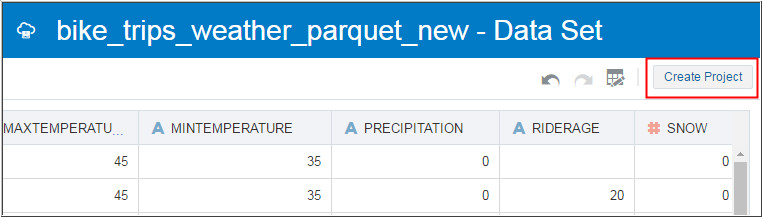
Description of the illustration a9_1.jpg - Click Create Project
to create your first visualization project.
Description of the illustration a10.jpg
 Next
Tutorial
Next
Tutorial
Exploring and Visualizing Data Using Oracle Data Visualization Desktop