The results area displays the results of the most recent comparison or configuration report. The results area is subdivided into multiple panels, and the layout depends on the complexity of the components being analyzed.
The results area always contains a component list, which displays the top-level components included in the analysis, and a details pane which contains the details of the report for the currently selected component:
If you select a process in the component list, a processor list will be added to the details pane:
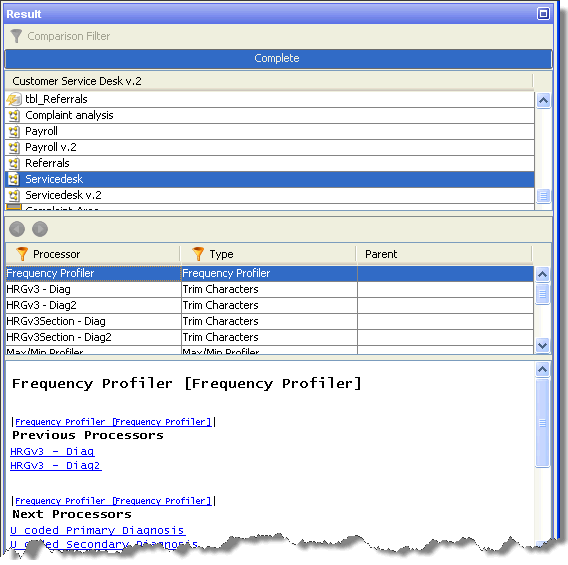
This contains a list of all the processors in the selected process.
The component list holds a list of all the components covered by the analysis. If analysis is performed on a single component, such as a process or a set of reference data, there will only be a single entry in this list. If multiple components are covered by the analysis, there will be multiple entries in the list.
The information presented in the results area depends on whether you are browsing comparison results or configuration report results. For report results, each line simply contains the component name and an icon indicating the type of the component (job, process, snapshot and so on):

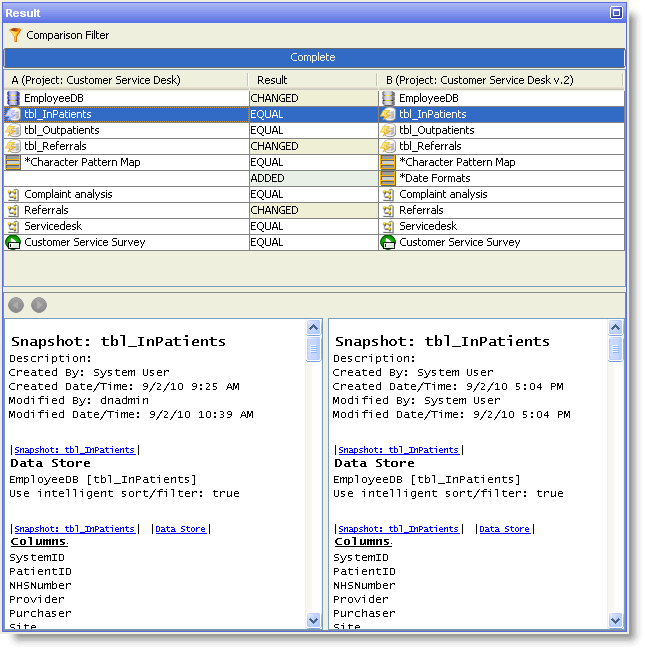
For comparison results, each line contains the name of the component as seen on both sides of the comparison, and the result of the comparison. The Comparison Filter can be used to filter the items in the list based on the results of the comparison (see Filtering Comparison Results for more details):

For more details, see the comparison results and report results topics, respectively.
The details pane contains a list of the various configurable attributes for the selected component, and their values. When comparing two components, the configuration differences are highlighted using colored backgrounds for the appropriate rows:
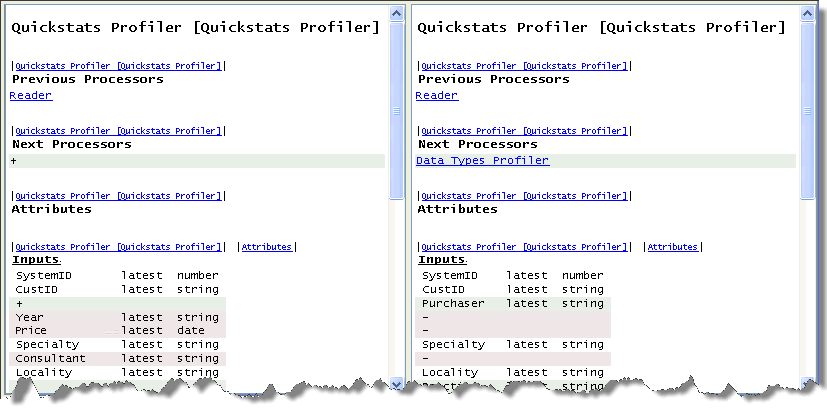
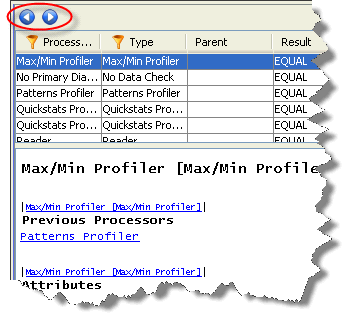
Whether you are running comparisons or configuration reports, the results are provided complete with automatically inserted hyperlinks for ease of navigation. The hyperlinks are rendered in blue, underlined text, and can be used to move between the sections of data for a component, or between components. For example, the following excerpt is from a page of a process configuration report. It details the configuration of a Patterns Profiler processor:
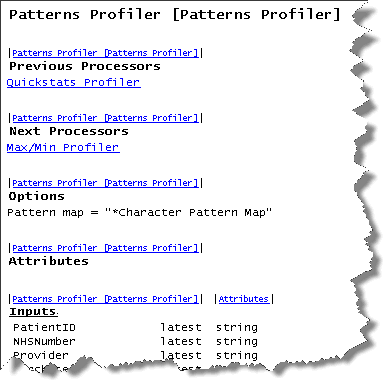
Each section, such as the 'Options' section, is preceded by a link back to the top of the current page of the report. Subsections are preceded by a link back to the top of the page, and a link to the top of the section. For example, in the figure above, 'Inputs' is a subsection of the 'Attributes' section. As such, it is preceded by a link back to the top of the 'Patterns Profiler [Patterns Profiler]' page, and to the top of the 'Attributes' section.
In addition, links are provided to the previous and next processors in the process.
If you click on a hyperlink in a report, you will build up a browsing history based on your path through the report. This will activate the navigation buttons at the top of the details pane, which can then be used to retrace your path through the report, as required:
The processor list only appears when a process is selected in the component list. The processor list contains a list of all the processors in the selected process. If a comparison is being performed, each row shows the processor as it appears in each version of the process, and the results of comparing those two processors:

For each processor, its name and type are given (for each side of the comparison, if appropriate). It is possible to filter the results by processor name and processor type, if required (see Filtering Comparison Results and Filtering Report Results for more details). In addition, if the process includes grouped processors, the Parent column will be visible. This column shows the group to which the processor belongs.
If you have launched Configuration Analysis from within Director, a link is created between the applications. You can use this link to navigate from processors listed in the analysis results back to the location of those processors on the Canvas.
To navigate from the results to the Canvas, right click on the results row which corresponds to the processor you wish to investigate.
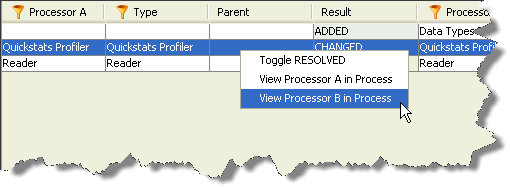
The options you are offered will depend on the type of analysis you have performed and, in the case of comparisons, the results associated with the selected processor:
Oracle ® Enterprise Data Quality Help version 9.0
Copyright ©
2006,2011 Oracle and/or its affiliates. All rights reserved.