Before You Begin
Purpose
This tutorial covers data lineage analysis, or more simply, Show me where the data is coming from.
Time to Complete
Approximately 20 minutes.
Introduction
This Oracle By Example (OBE) is fourth in a series of seven OBEs. The recommendation is to do them in order. The series is:
- Installing OEMM, on a Windows PC.
- Harvesting Metadata from Various Sources: DB, ODI, OBIEE, and others.
- Managing the Configuration and Metadata Stitching with OEMM, including backup and restore.
- Configuring Data Lineage Analysis, graphically and exporting to Excel (you are currently viewing this OBE).
- Using Impact Analysis, the "opposite" of data lineage.
- Creating a Business Glossary in OEMM, using the enterprise edition.
- Administering OEMM, creating users, roles, and scripts.
Scenario
You have a report that was generated using BI, and you want to see where all the data came from (its lineage). You want to see this information graphically as well as to export it to a Microsoft Excel (spreadsheet) format.
Software and Hardware Requirements
The following is a list of software and hardware requirements used in this Oracle By Example (OBE):
- Software
- Oracle Database 11.2.0.4.0 or higher
- Oracle Business Intelligence Enterprise Edition (OBIEE) was installed at one time, but no longer is installed.
- Oracle Enterprise Metadata Manager (OEMM) 12.1.3.0.2 or higher. The OEMM Install and Setup Guide is available online and in the product itself.
- Oracle Data Integrator (ODI) 12.1.3 or higher. At least one copy of ODI for Windows must be on the same machine as OEMM. (ODI is not a requirement for OEMM, but is a requirement for parts of this OBE.)
- Alternatively, the VM contains Database, ODI, and OEMM sample repositories (but not OEMM software) pre-installed with Oracle Enterprise Linux (OEL) 6.4. The VM (approx 7 GB) requires Oracle VirtualBox to run. The VM is available in either of two places (both are the same VM):
- internally for employees only
- externally on OTN for all students and customers
- Hardware
- At least 2 GB RAM for each target (database or ODI)
- At least 5 GB RAM for the VM (if you are using that)
Prerequisites
Before starting this tutorial, you should:
- Have an account to download Oracle software.
- Have access to or have installed the sample lab artifacts
- Have attended ODI 12c training, [D82167GC10] Oracle Data Integrator 12c: Integration and Administration, or equivalent experience. (ODI is not a requirement for OEMM, but is a requirement for parts of this OBE.)
Typographic Conventions
These are the conventions used throughout this practice to indicate who types what.
-
Filenameor/path/subdirectory/. Often you can navigate to a destination without having to type it. - Command or value that you type, such as gedit .bashrc. Be mindful of periods at the end of sentences that are not part of the command.
- Click this such as or .
- Some variable or
<variable>as something you replace. Often prefixed with "my" such as<myName>or<myHost>. - A Menu Item or dialog Field Prompt or Tab name. For example, "click the Designer tab and select Models > New Model".
- Generally a red rectangle in the graphics is not part of the original image, but added to draw your attention to an item.
1. View the Source (a BI Report)
Browse the BI model that is harvested from an OBIEE server.
1.1 Exploring the BI Report
-
Open Repository > Oracle Tutorial > BI Reports and notice the Reports (Folder) and BI Repository (RPD Content).
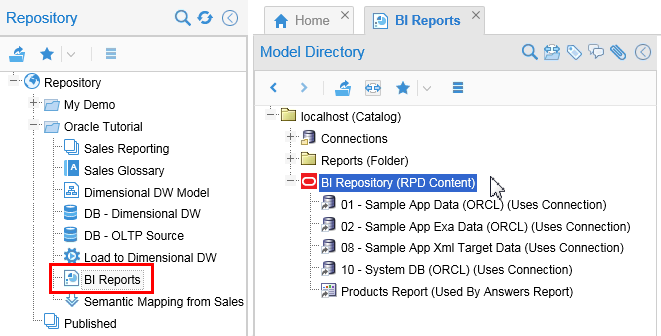
Description of this image Trivia:
RPD
is not an acronym, it does not stand for anything! It is just a metadata file extension. -
Open BI Repository to see the logical/physical/presentation layers. Explore the BI RPD nodes.
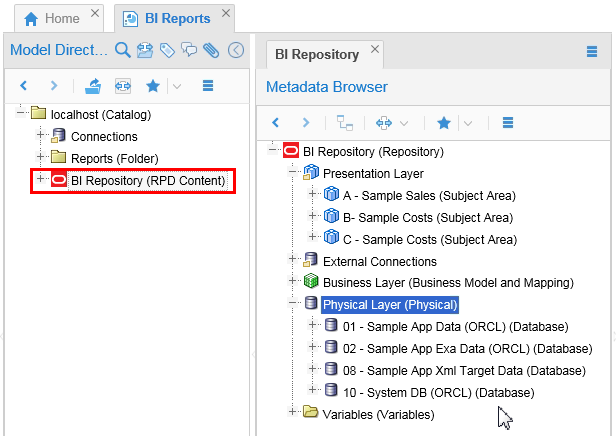
Description of this image You can browse the content in OEMM without needing to install or use the BI Admin tool.
-
Now open Reports > User Folders > My Folders > Products Report and view it graphically by clicking Data and Semantic Flow overview (
 ). It shows the report and its link to the presentation layer.
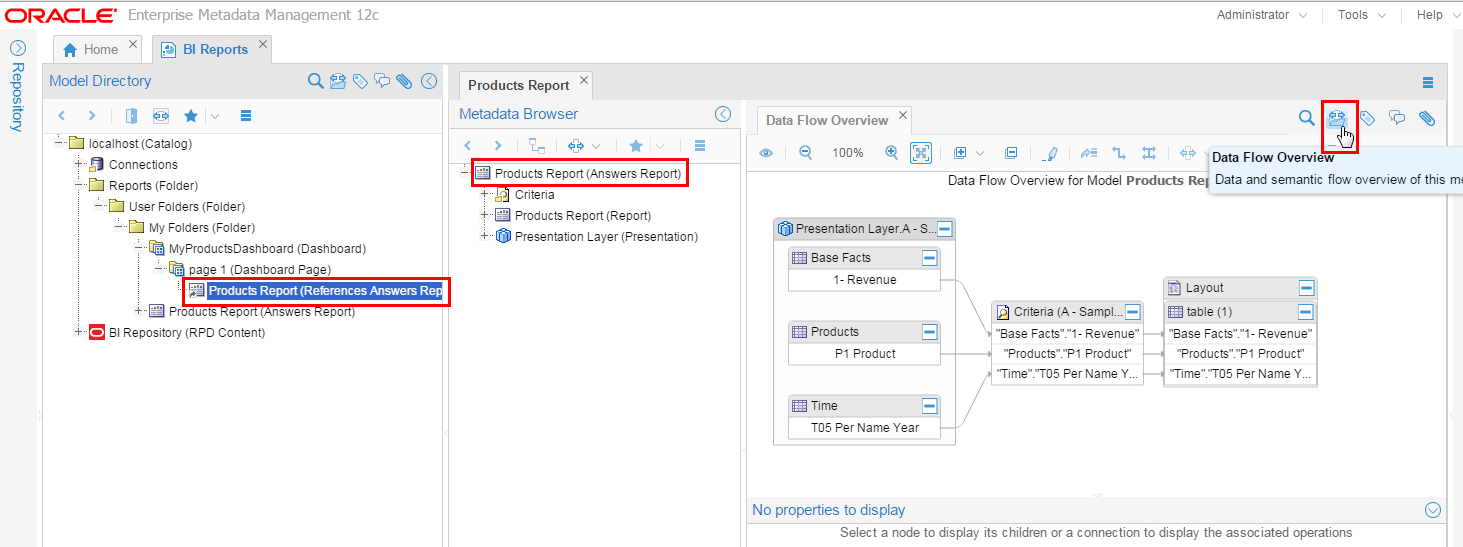
Description of this image You may need to collapse some sections by clicking collapse-left (
 ).
).
This is the report that will be analyzed for data lineage. Leave the tabs open for the next topic.
This shows the final state of the report, but what you are interested in is, "How did the data get there?"
2. Generate Data Lineage
In order to display where the data came from, perform the following steps:
2.1 Basic Analysis
-
After browsing the report, you want to see where the data is coming from. Collapse (
) left and right ( ) side panes to have a better view of the report. You can click Fit Contents (
 ) to automatically zoom and adjust the graph.
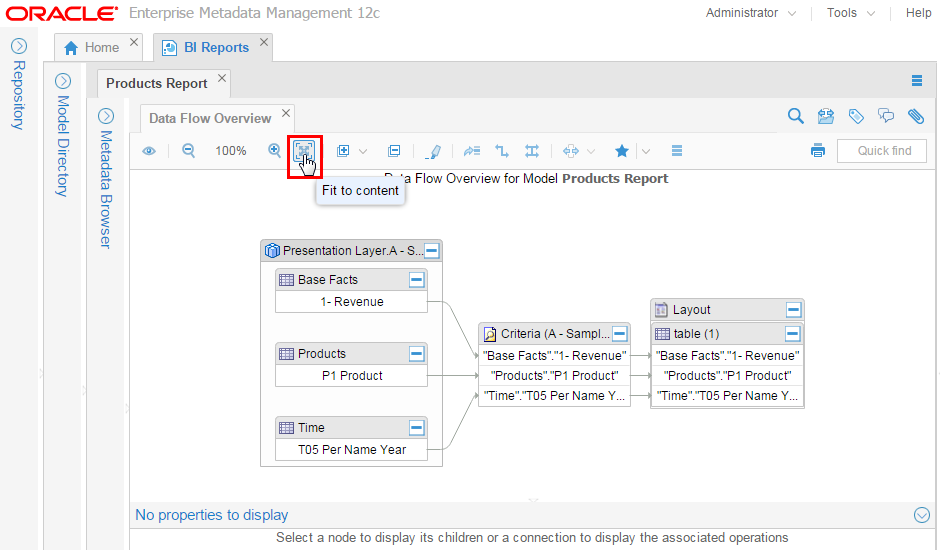
Description of this image You can always expand the collapsed panels by clicking those
left and right icons again. -
Right-click
table(1)in the layout...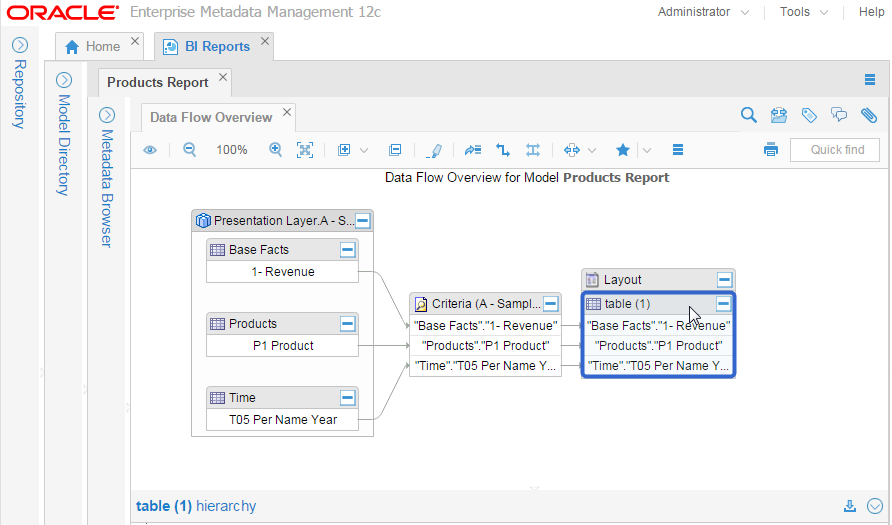
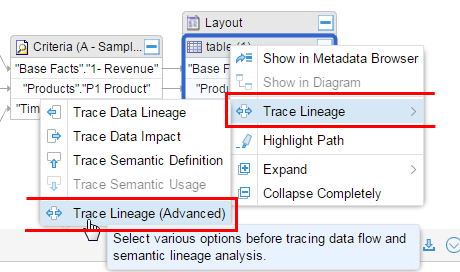
Description of this image ...and select Trace Lineage > Trace Lineage (Advanced).
Use Trace Lineage (Advanced) because it allows various options. "Trace Lineage" and "Trace Impact" are simplified actions and do not allow various options. It is best to always use the "Trace Lineage (Advanced)" action for lineage, impact and semantic analysis since it allows complete flexibility.
-
In Configuration field, click Search (
 ).
). 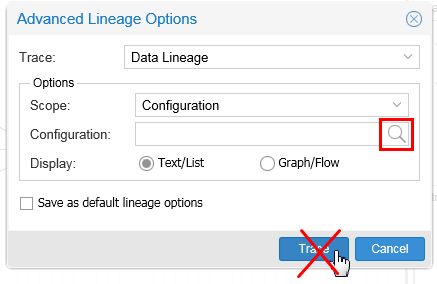
Description of this image Do not click Trace yet.
-
Select the configuration you created in the last OBE: Sales Reporting Application.
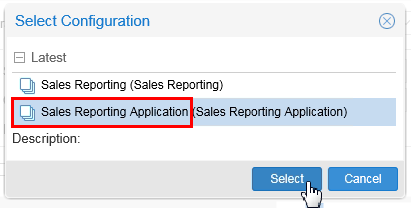
Description of this image Click .
-
Click .
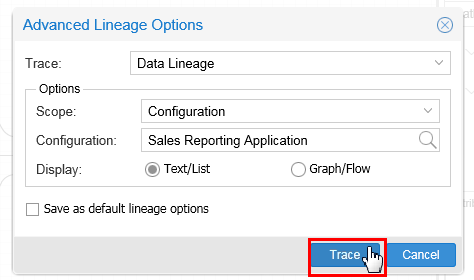
Description of this image -
OEMM finds the source model/table/columns for this report.
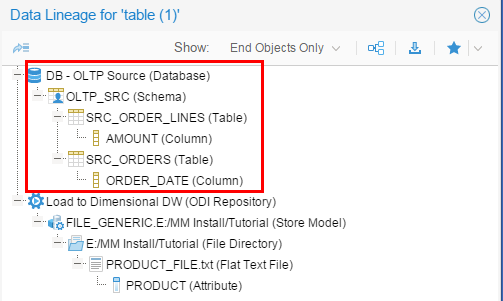
Description of this image Leave the report open after you have looked at it for the next topic.
This displays a simple lineage.
2.2 Intermediate Analysis
Currently you can only see the final objects that make up the lineage. To see the intermediate objects, perform the following tasks:
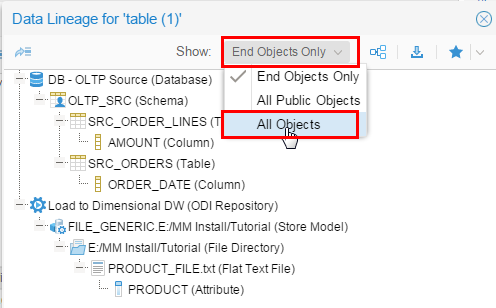
-
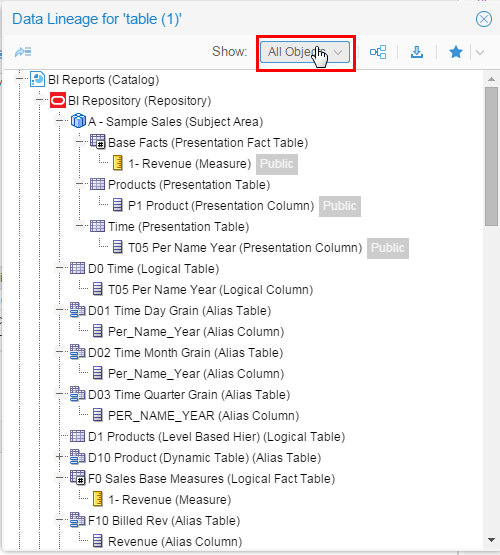
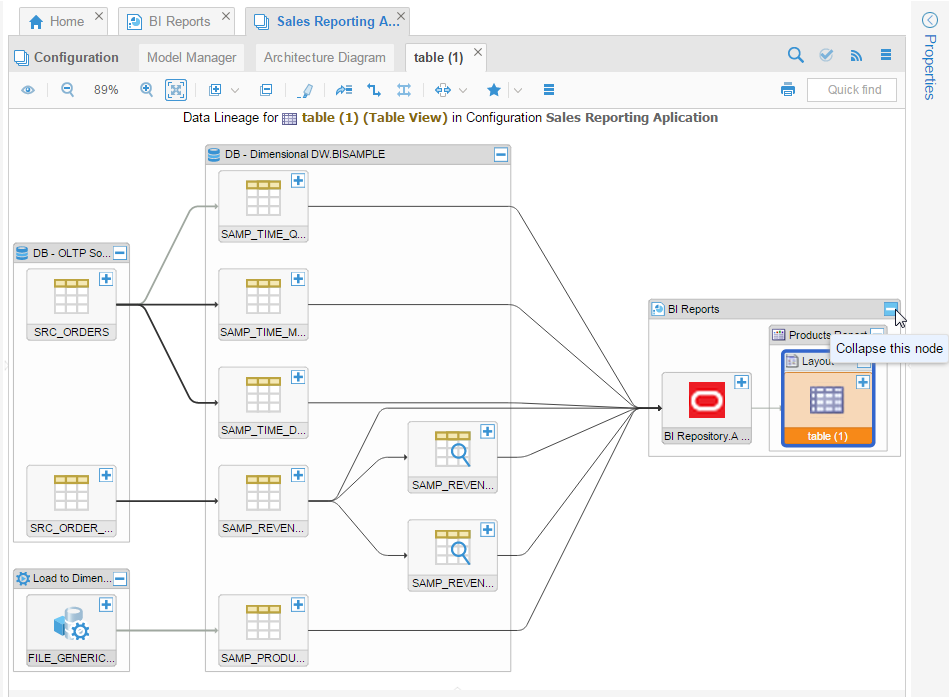
In the same Data Lineage for table(1) report from the last topic, click End Objects Only pull-down, and select All Objects.
Description of this image -
Quite a few more objects are now shown.
Description of this image Leave the report open after you have looked at it for the next topic.
You have expanded the scope of the analysis to include all objects.
2.3 Export the Analysis (to Excel)
-
In the same Data Lineage for table(1) report from the last topic, click Download Details.
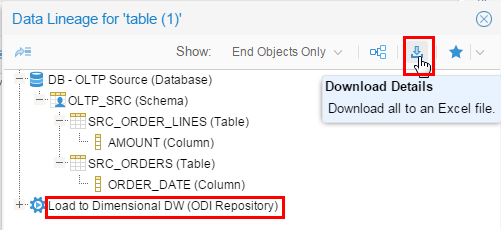
Description of this image Use whatever dialog your web browser uses to save the
.csvfile to a destination folder of your choice. -
Open the comma-separated variable (
.csv) file using a spreadsheet viewer such as Microsoft Excel or OpenOffice.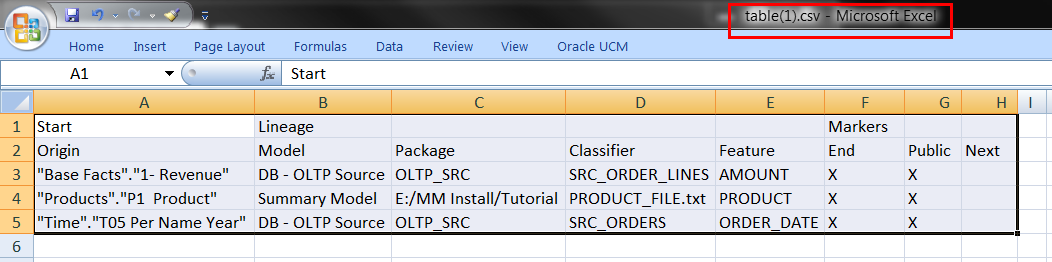
Description of this image Remember that as soon as you download it, there is a chance it will start to get out of sync! You can close the spreadsheet.
The columns Package/Classifier/Features are generic terms for object hierarchy in any model. For a database model, they correspond to Schema/Table/Columns. Leave the data lineage report open after you have looked at it for the next topic.
You exported the information to a .csv file which can externally be turned into an .xls spreadsheet which can be printed to a .pdf document.
You have completed basic data lineage analysis.
3. Interactive Lineage Graphs
Somewhere in between, show me only the last thing
and, show me all the objects,
is the ability to dynamically move around and selectively drill down just a few of the objects and return while browsing the configuration. To do this, perform the following steps:
3.1 Lineage Graphs
-
In the same Data Lineage for table(1) report from the last topic, click Show Lineage Graph.
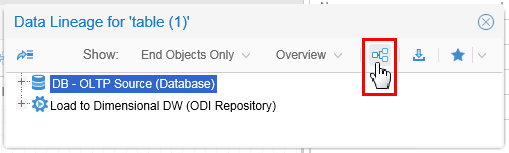
Description of this image It does not matter at this point what, if anything, is selected in the report.
-
Drill down into the detail by clicking expand
![[+]](icons/expand.png) and collapse
and collapse ![[-]](icons/collapse.png) in the upper-right corners of the boxes.
in the upper-right corners of the boxes. 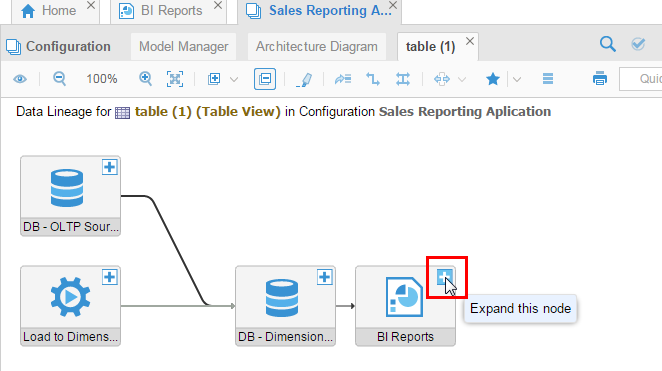
Description of this image This is what it looks like before you drill down (initially collapsed to only top-level showing).
-
This is the same diagram expanded down a few levels.
Description of this image You can drill deeper if you wish. Leave this graph open for the next topic.
This is the static version of the lineage graphs.
3.2 Tracing Data Flow
-
Expand
all of the objects down to their lowest level. You can do this manually, or by selecting the object and then on the toolbar is an icon that expands the entire object all at once. Then rezoom to Fit (). While expanding all nodes using
, you will be asked whether you want to expand at "Feature level" or at "Classifier level." In OEMM, model hierarchies are abstracted as Classifier/Feature. Usually the Feature level is the lowest level in any model. In a Database model, the Classifier level maps to Table and the Feature level maps to column. 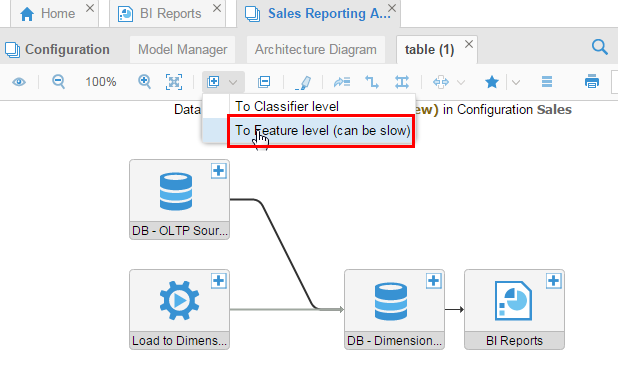
Click To Feature level to get the expanded view below, then rezoom to fit.
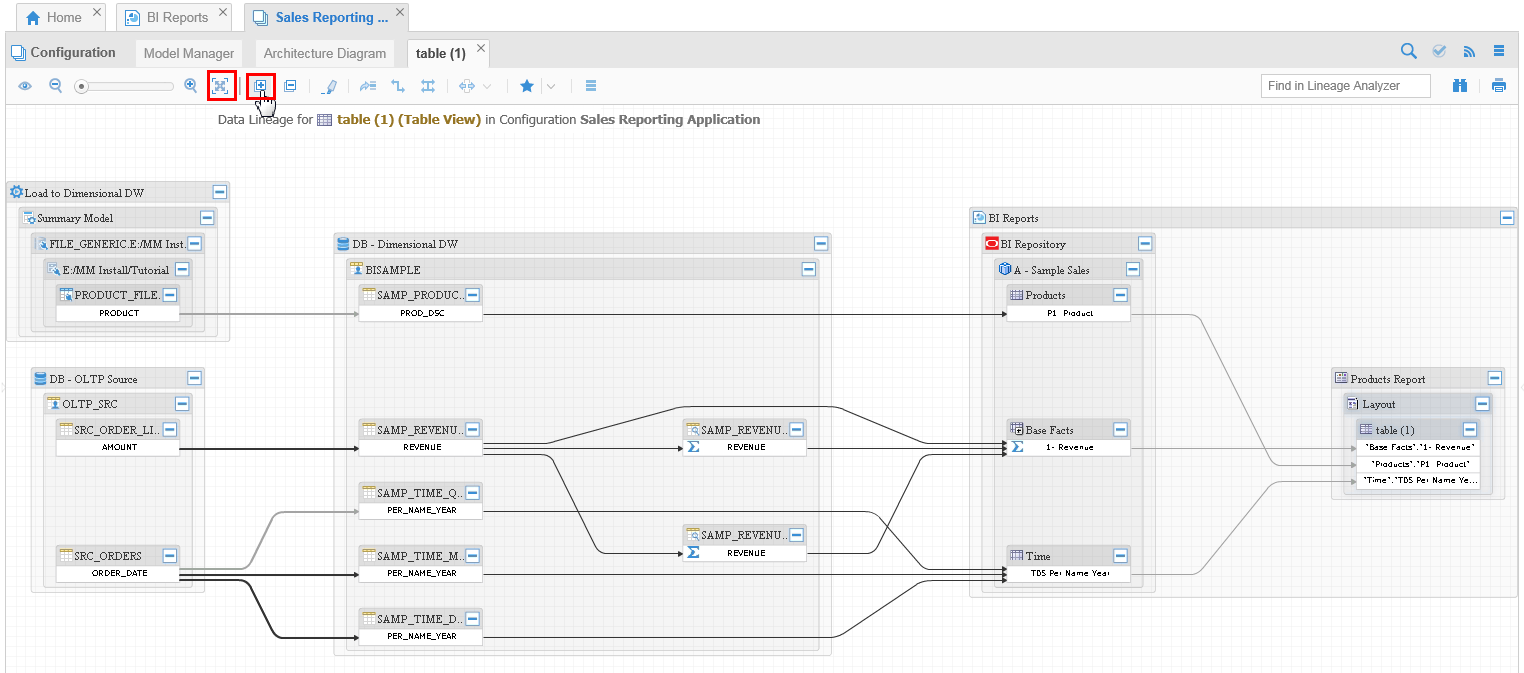
Description of this image -
Select
SAMP_REVENU(right in the middle of the page), and on the toolbar click Highlight. This highlights the path from start to finish going through this object.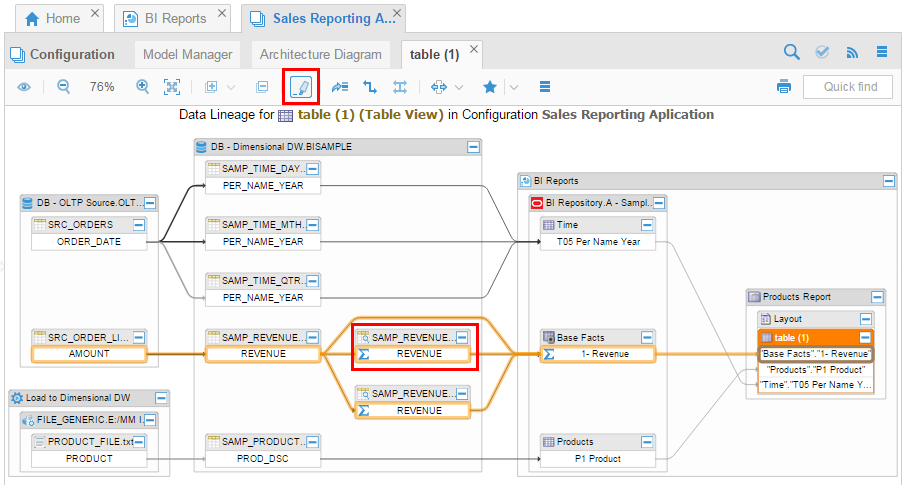
Description of this image Click on any empty space in the diagram to unhighlight the path. Try different objects.
-
Select an individual object, such as
SAMP_REVENU, and examine the Properties panel (which may need to be re-expanded).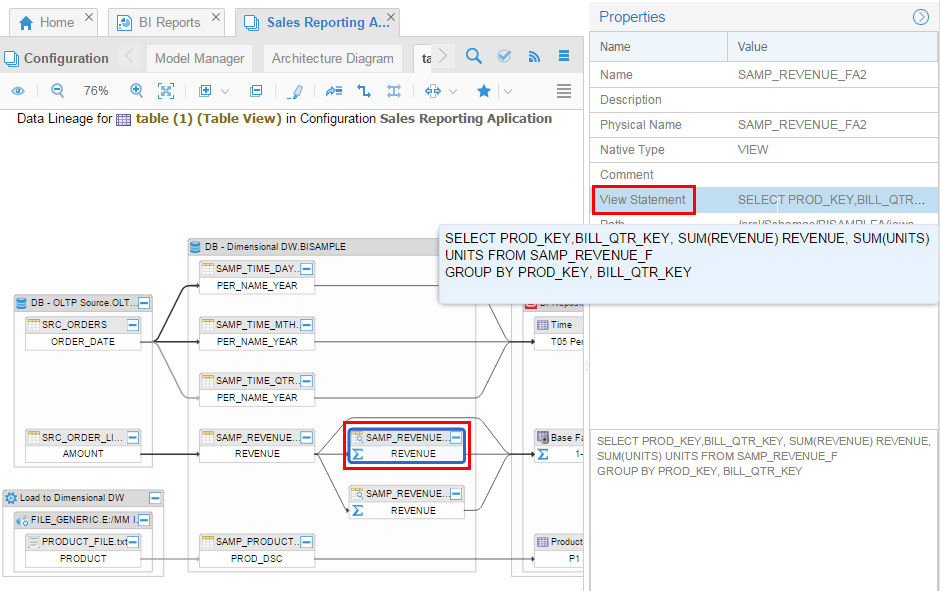
Description of this image In this case it is showing a view, and the
SELECTstatement that generated the view. Click on any empty space in the diagram to unhighlight the object. -
The thinner lines (shown here) are expression links. Select an individual link, such as from
REVENUEtoREVENUE, and the details are shown in the Operations box. It shows the operationSUM(REVENUE)taking place between source and target for this link. If there are more than one transformation taking place then they will all be displayed with different contexts. Here Context refers to an individual mechanism where the operation takes place. Double clicking on the context will take you the in model browser where the operation takes place. In this case, double clicking on the contextREVENUEwill open the DB model "DB - Dimensional DW" and point to the view/column where the operation is defined.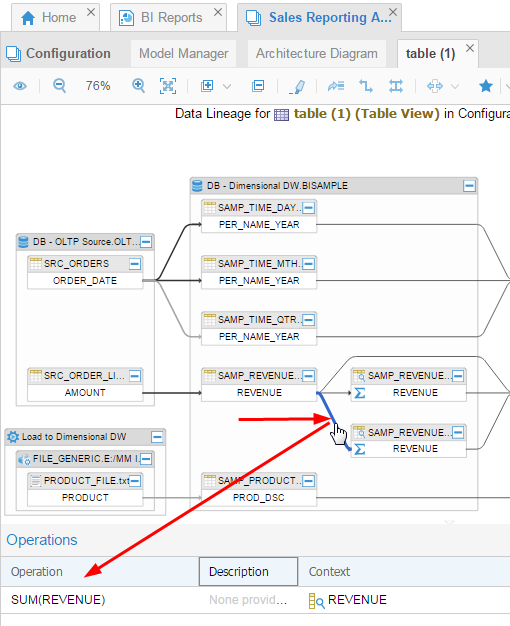
Description of this image -
Select another individual link, such as from
ORDER_DATEtoPER_NAME_YEAR, and it displays the Link Type. The thicker lines (shown here) are ETL processes. In this case, double clicking onMapping LD_TIME_DIMS_87will open the "Load to Dimensional DW" model and point to the ODI mapping where this operation is taking place.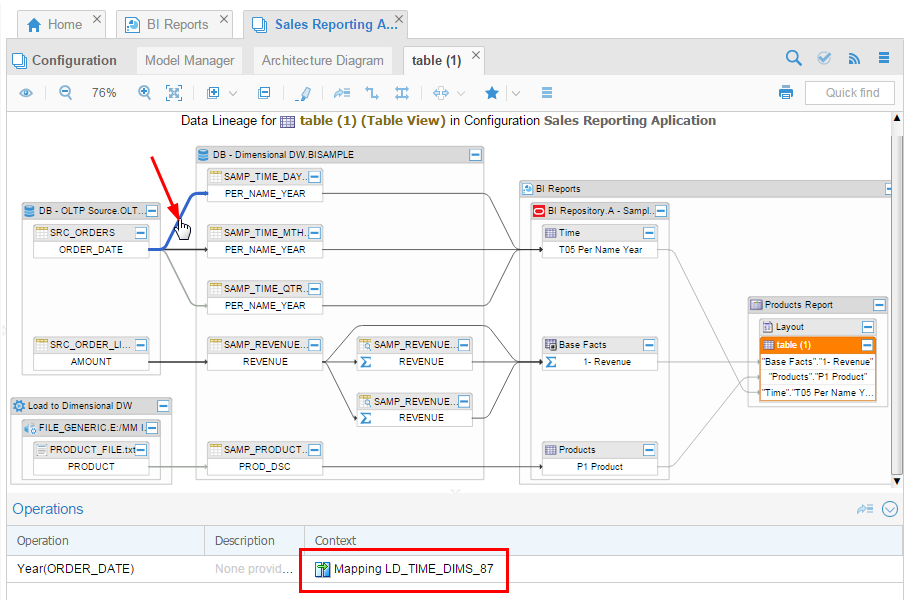
Description of this image You can get the same information in the hovering pop-up (transient), or in the Properties panel (permanent). Leave the graph open for the next Topic.
All of the objects are interactive with varying amounts of detail available and shown.
3.3 Drilling Down into ETL Processes
-
Using the highlighted link from the previous topic, from
ORDER_DATEtoPER_NAME_YEARlink, right-click on it to drill into the ETL mapping.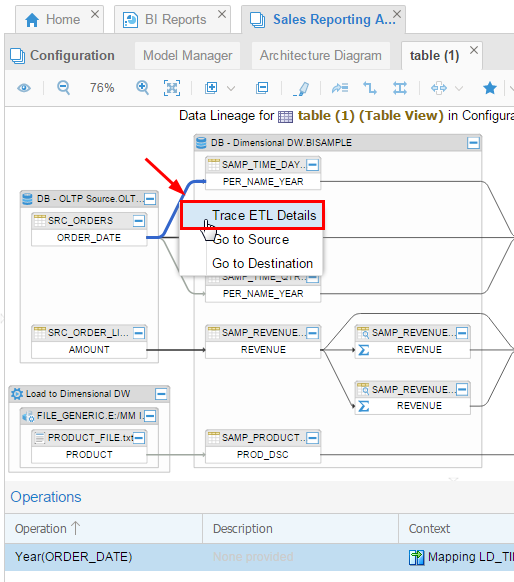
Description of this image Select Trace ETL Details.
-
Tracing data lineage into ETL only exposes the data flow relevant to earlier lineage graph. You can see then in the mapping
PER_NAME_YEAR, dates are calculated by summing the order date fields from the source.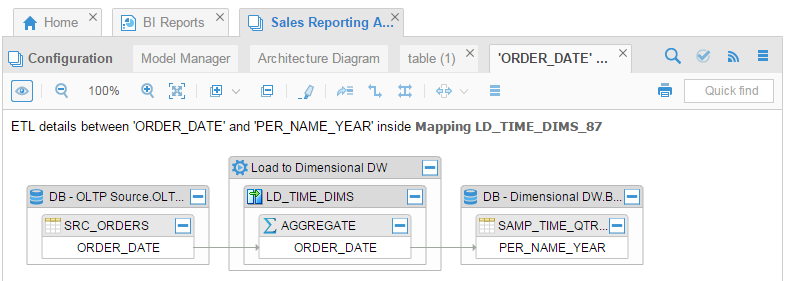
Description of this image -
If you want to browse the full mapping, right-click to Show in Metadata Browser (
LD_TIME_DIMSin this case).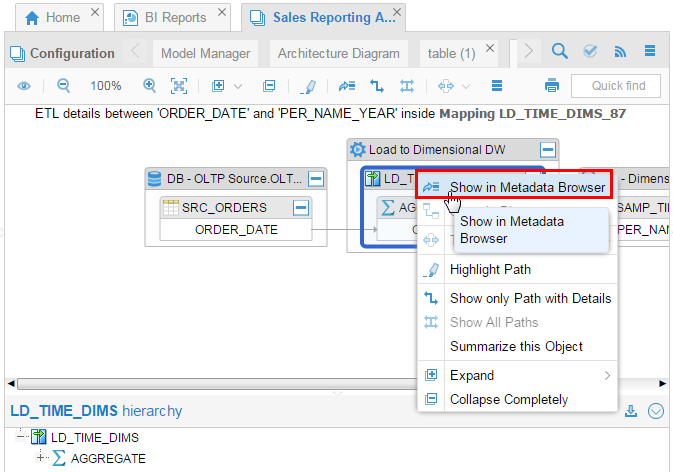
Description of this image Do not bother doing it, but you could if you wanted to.
This illustrates drilling down into the ETL processes.
You have explored the interactive lineage graphs.
Want to Learn More
You had a report that was generated using BI, and you wanted to see where all the data came from (its lineage). You wanted to see this information graphically as well as to export it to a Microsoft Excel (spreadsheet) format.
In this tutorial, you learned to:
- View a source report such as BI Reports
- Generate data lineage in static and comma-separated formats (suitable for exporting)
- Explore interactive lineage graphs
- Drill down to various levels exploring the details available for each kind of object and link
Resources
Following is a list of conceptual or procedural Help topics relevant to the topic of this tutorial:
- Product marketing information
- Product documentation in PDF format.
- Virtual Machine demo environment on OTN
- Internal (employee) resources:
- MetaIntegration, the owner of the OEM version of this product.
- To learn more about OEMM, refer to additional OBEs in the Oracle Learning Library <can link to a specific set of OBEs on the subject or product(s)>
Credits
- Lead Curriculum Developer: Jayant Mahto
- Other Contributors: Steve Friedberg