Before You Begin
Purpose
This tutorial covers using impact analysis. You could think of it as the opposite of data lineage analysis (covered in the preceding OBE). While data lineage shows you all fields that led up to a given report, impact analysis shows you all reports that are based on a given field.
Time to Complete
Approximately 10 minutes.
Introduction
This Oracle By Example (OBE) is fifth in a series of seven OBEs. The recommendation is to do them in order. The series is:
- Installing OEMM, on a Windows PC.
- Harvesting Metadata from Various Sources: DB, ODI, OBIEE, and others.
- Managing the Configuration and Metadata Stitching with OEMM, including backup and restore.
- Configuring Data Lineage Analysis, graphically and exporting to Excel.
- Using Impact Analysis, the "opposite" of data lineage (you are currently viewing this OBE).
- Creating a Business Glossary in OEMM, using the enterprise edition.
- Administering OEMM, creating users, roles, and scripts.
Scenario
You have two fields, QTY and AMOUNT, in a database table that is a source for many other reports. You are thinking of changing the precision of the two numbers, and wanted to see what reports might be affected by these changes.
Software and Hardware Requirements
The following is a list of software and hardware requirements used in this Oracle By Example (OBE):
- Software
- Oracle Database 11.2.0.4.0 or higher
- Oracle Business Intelligence Enterprise Edition (OBIEE) was installed at one time, but no longer is installed.
- Oracle Enterprise Metadata Manager (OEMM) 12.1.3.0.2 or higher. The OEMM Install and Setup Guide is available online and in the product itself.
- Oracle Data Integrator (ODI) 12.1.3 or higher. At least one copy of ODI for Windows must be on the same machine as OEMM. (ODI is not a requirement for OEMM, but is a requirement for parts of this OBE.)
- Alternatively, the VM contains Database, ODI, and OEMM sample repositories (but not OEMM software) pre-installed with Oracle Enterprise Linux (OEL) 6.4. The VM (approx 7 GB) requires Oracle VirtualBox to run. The VM is available in either of two places (both are the same VM):
- internally for employees only
- externally on OTN for all students and customers
- Hardware
- At least 2 GB RAM for each target (database or ODI)
- At least 5 GB RAM for the VM (if you are using that)
Prerequisites
Before starting this tutorial, you should:
- Have an account to download Oracle software.
- Have access to or have installed the sample lab artifacts
- Have attended ODI 12c training, [D82167GC10] Oracle Data Integrator 12c: Integration and Administration, or equivalent experience. (ODI is not a requirement for OEMM, but is a requirement for parts of this OBE.)
Typographic Conventions
These are the conventions used throughout this practice to indicate who types what.
-
Filenameor/path/subdirectory/. Often you can navigate to a destination without having to type it. - Command or value that you type, such as gedit .bashrc. Be mindful of periods at the end of sentences that are not part of the command.
- Click this such as or .
- Some variable or
<variable>as something you replace. Often prefixed with "my" such as<myName>or<myHost>. - A Menu Item or dialog Field Prompt or Tab name. For example, "click the Designer tab and select Models > New Model".
- Generally a red rectangle in the graphics is not part of the original image, but added to draw your attention to an item.
Impact Analysis
For purposes of this example, the two fields you want to examine, QTY and AMOUNT, are both in the Oracle database under schema OLTP_SRC, but in real life they could be anywhere. If you wanted to alter the characteristics and attributes of those fields, this is how you could determine the impact of the proposed change. Perform the following steps:
1.1 QTY
You are going to examine two fields, first QTY (Quantity).
-
In the left panel, OEMM Repository, expand [+] Repository > Oracle Tutorial > DB - OLTP Source.
In the middle panel, DB - OLTP Source tab, expand [+] orcl > Schemas > OLTP_SRC > Tables > SRC_ORDER_LINES > Columns.
Right-click
QTYand select Trace Lineage (Advanced).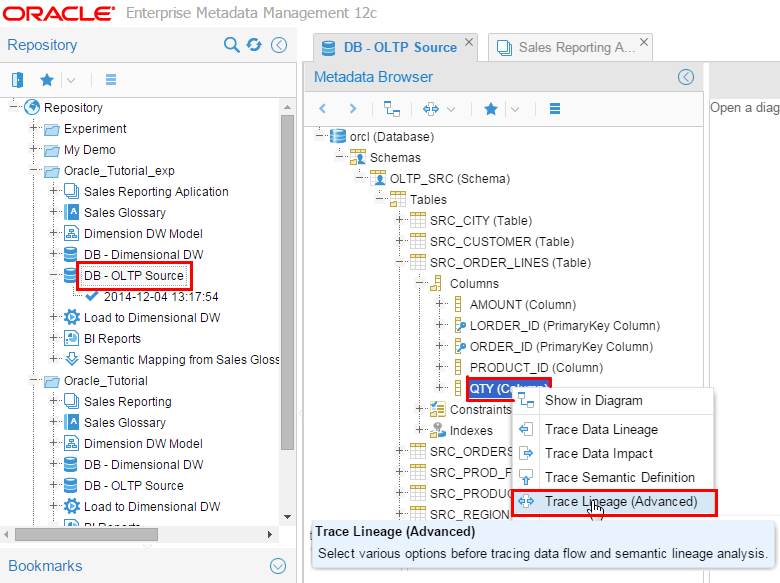
Description of this image Use Trace Lineage (Advanced) because it supports various options. "Trace Lineage" and "Trace Impact" are simplified actions and do not allow various options. It is best to always use the "Trace Lineage (Advanced)" action for lineage, impact and semantic analysis since it allows complete flexibility. Some of the advanced lineage options are shown below:
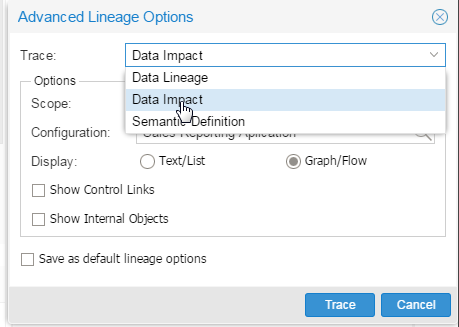
Select Data Impact. Do not click Trace yet.
-
In Configuration field, click Search (
 ).
). 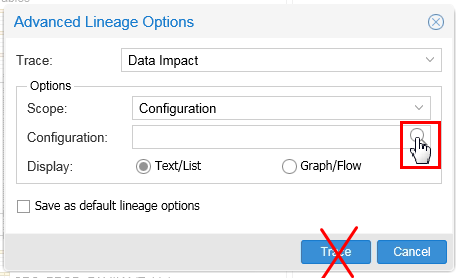
Description of this image Do not click Trace yet.
-
Select the configuration you created in the last OBE: Sales Reporting Application.
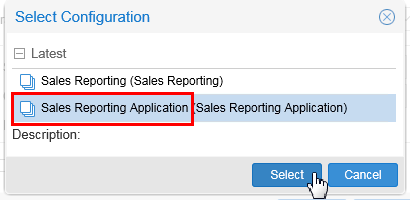
Description of this image Click .
-
Select Graph/Flow.
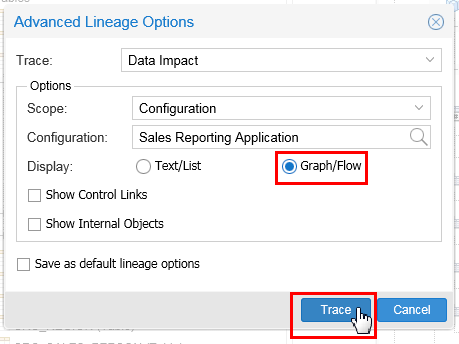
Description of this image Click .
-
This is the initial display of the impact of
QTY, collapsed to the highest level.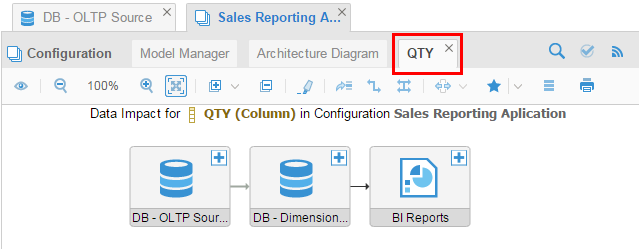
Description of this image You are interested in the BI Reports.
-
Expand all of the nodes to their lowest level (Feature level). You can do them all by clicking
 and selecting Feature level.
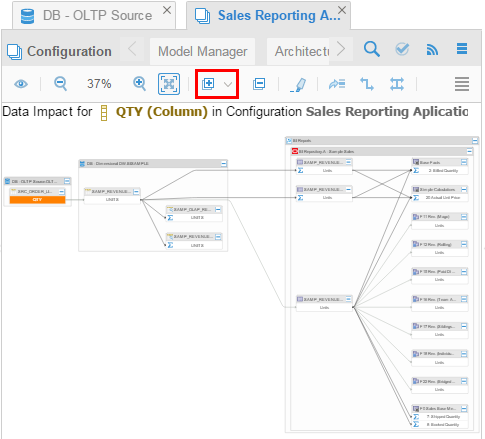
Description of this image Hmmm, a bit hard to read at this zoom level...
-
Fiddle with the browser size and zoom to get the BI Repository a bit bigger.
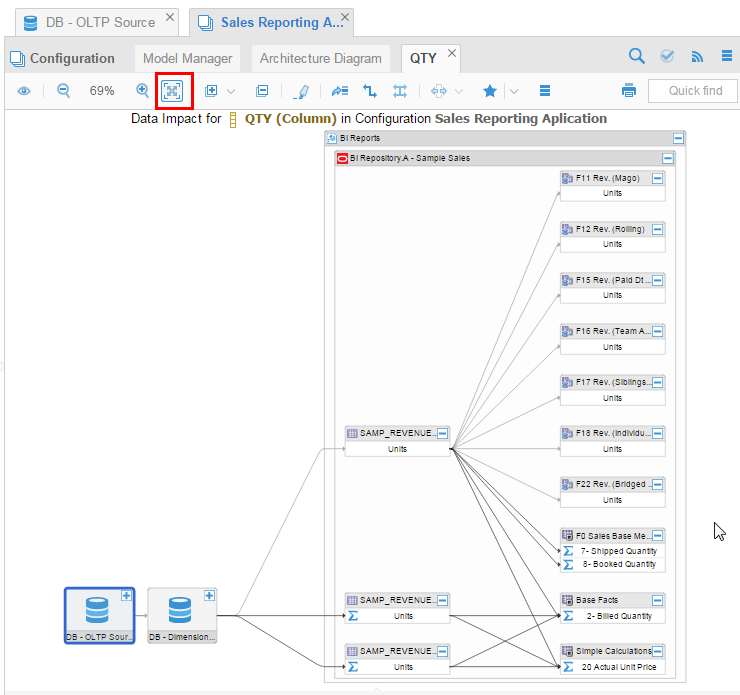
Description of this image You can see that
QTYimpacts many areas in BI rpd (right-most box) but there are no reports based on this column. Close the Sales Reporting tab.
While you were able to graphically display the impact of changing the QTY field, it did not impact any reports, and therefore was not as interesting as it could have been. Let's try a different field next.
1.2 AMOUNT
You are going to do basically the same steps for the field AMOUNT as you did for QTY.
-
In the left panel, OEMM Repository, expand [+] Repository > Oracle Tutorial > DB - OLTP Source.
In the middle panel, DB - OLTP Source tab, expand [+] orcl > Schemas > OLTP_SRC > Tables > SRC_ORDER_LINES > Columns.
Right-click
AMOUNTand select Trace Data Impact.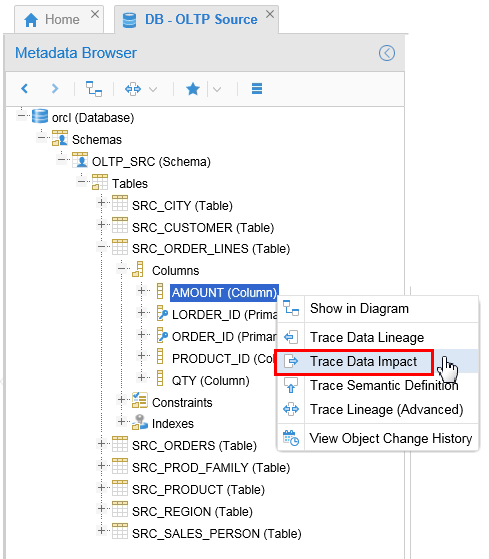
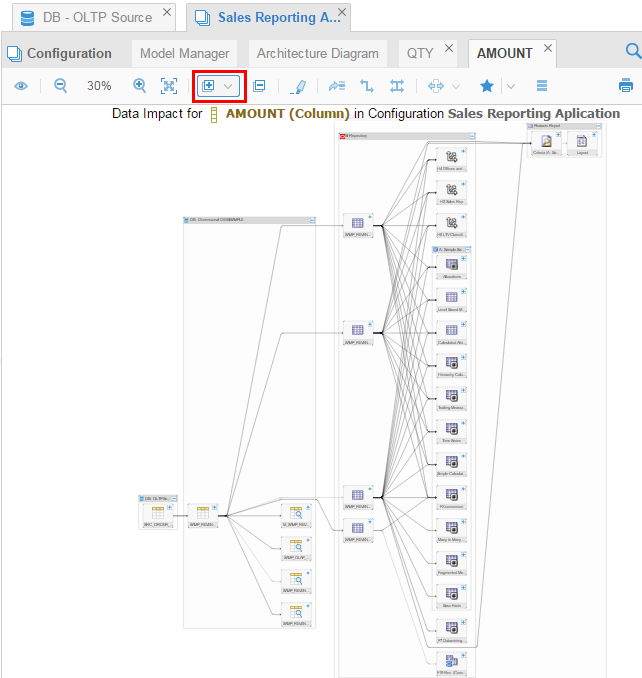
Description of this image -
At this initial high level, the graph for
AMOUNTis exactly the same as the graph forQTY.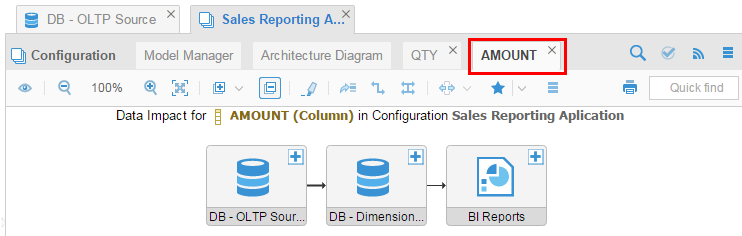
Description of this image You are still interested in the BI Reports.
-
Instead of expanding all of the nodes, just expand BI Reports, and only a level or two.
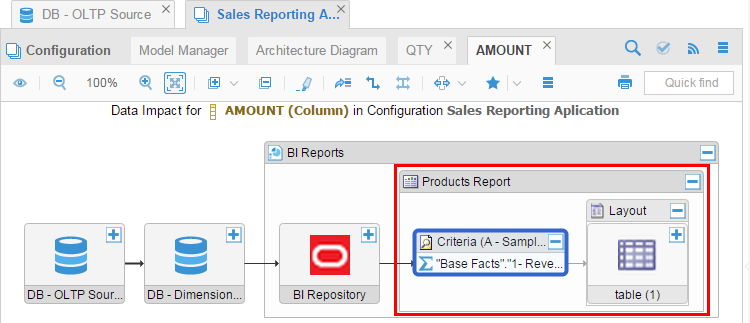
Description of this image Now the graph looks much better and is easier to understand. You can see easily which report is impacted by this source
AMOUNT. Stop here, do not do the next step... -
If you wanted to expand all of the nodes to the lowest level (Feature level) as you did before, you could try, it will work, but you won't like it!
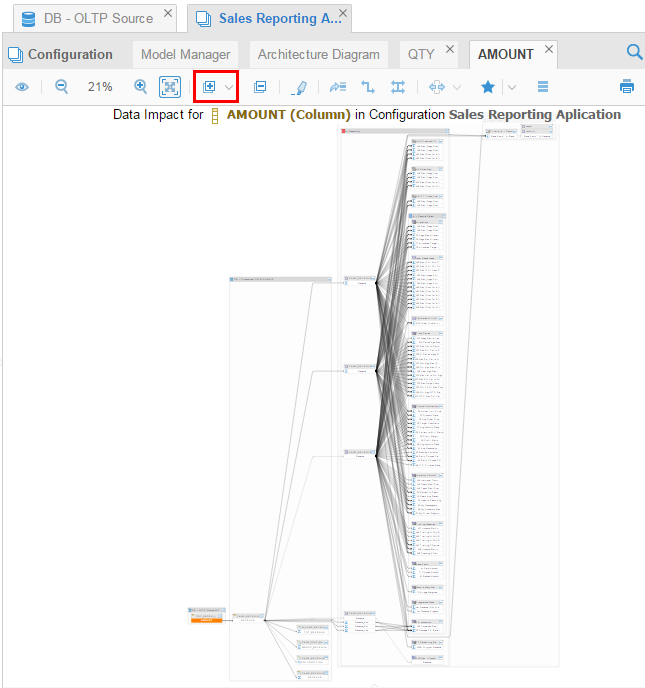
Description of this image I told you you wouldn't like it!
-
However, if you expand at the Classifier level then it is not that bad. This way you can limit the auto expansion.
Description of this image Close the AMOUNT Sales Reporting tab.
You have used data impact analysis to see graphically which objects (specifically which BI reports) would be affected by changing a source attribute.
You have performed data impact analysis on two fields.
Want to Learn More
Starting from a single field, you can display all of the objects that would be affected by potentially modifying that field. The affected objects can be collapsed into a summary graphic at many levels.
In this tutorial, you learned to:
- View graphical data impact analysis
- Expand and collapse pieces of the graph to focus on areas of interest
Resources
Following is a list of conceptual or procedural Help topics relevant to the topic of this tutorial:
- Product marketing information
- Product documentation in PDF format.
- Virtual Machine demo environment on OTN
- Internal (employee) resources:
- MetaIntegration, the owner of the OEM version of this product.
- To learn more about OEMM, refer to additional OBEs in the Oracle Learning Library <can link to a specific set of OBEs on the subject or product(s)>
Credits
- Lead Curriculum Developer: Jayant Mahto
- Other Contributors: Steve Friedberg