Manufacturing plant data consolidation

Optimize efficiency and lower risk with consolidated, real-time data
Today’s manufacturers must understand how efficiently all their lines are running across multiple plants—they need to know immediately when a problem occurs, not five or ten minutes after the fact. However, this is also one of their biggest challenges because their ability to do this relies on real-time access to data from multiple remote locations that may have limited or sporadic internet connectivity. To solve this problem, we need to push machine learning (ML) and data acquisition to the network edge.
Simplify decision-making at the edge
We can configure Oracle Data Platform to solve this challenge by including Oracle Roving Edge Devices (REDs). Each RED is designed to capture, store, run, manage, and gain insight from data, giving manufacturers the ability to automate the decision-making process and management of manufacturing equipment at the edge. Oracle Data Platform for manufacturing also includes anomaly detection capabilities, which can be used to address manufacturing line disruptions and provide maintenance-related insights to improve mitigation and remediation.
The following architecture demonstrates how Oracle Data Platform supports plant data consolidation by deploying advanced analytics and machine learning at the edge to identify anomalies, perform smart data collection, and provide real-time operational information.
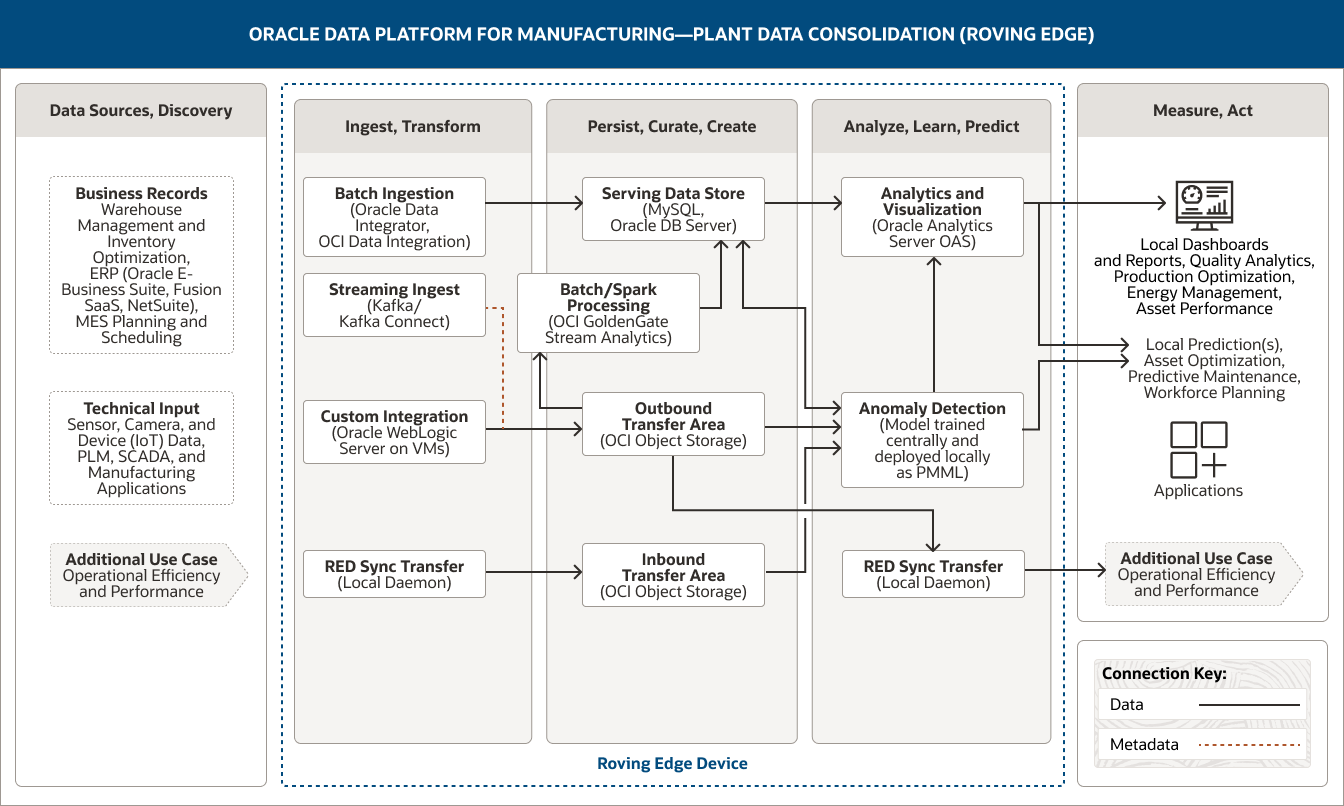
This image shows how Oracle Data Platform for manufacturing can be used to consolidate plant data. The platform includes the following five pillars:
- 1. Data Sources, Discovery
- 2. Ingest, Transform
- 3. Persist, Curate, Create
- 4. Analyze, Learn, Predict
- 5. Measure, Act
The Data Sources, Discovery pillar includes two categories of data.
- 1. Business records data comprises warehouse management and inventory optimization data, ERP (Oracle E-Business Suite, Fusion SaaS, NetSuite) data, and MES planning and scheduling data.
- 2. Technical input data includes sensor, camera, and device (IoT) data and data from PLM, SCADA, and manufacturing applications.
The Ingest, Transform pillar comprises four capabilities.
- 1. Batch ingestion uses Oracle Data Integrator and OCI Data Integration.
- 2. Streaming ingest uses Kafka Connect.
- 3. Custom integration uses Oracle WebLogic Server on VMs.
- 4. RED sync transfer uses a local daemon.
Batch ingestion connects unidirectionally to the serving data store.
Streaming ingest and custom integration connect unidirectionally to the outbound transfer area.
Additionally, RED sync transfer unidirectionally connects to the inbound transfer area.
The Persist, Curate, Create pillar comprises four capabilities.
- 1. The serving data store uses MySQL and Oracle DB server.
- 2. Batch processing/Spark processing uses OCI GoldenGate Stream Analytics.
- 3. The outbound transfer area uses OCI Object Storage.
- 4. The inbound transfer area uses OCI Object Storage.
These capabilities are connected within the pillar. Batch/Spark processing is unidirectionally connected to the serving data store.
The outbound transfer area is unidirectionally connected to batch/Spark processing.
Three capabilities connect into the Analyze, Learn, Predict pillar:
The serving data store connects unidirectionally to the analytics and visualization capability and bidirectionally to the anomaly detection capability. The outbound transfer area connects unidirectionally to the anomaly detection and RED sync transfer capabilities.
The inbound transfer area connects unidirectionally to the anomaly detection capability.
The Analyze, Learn, Predict pillar comprises three capabilities.
- 1. Analytics and visualization uses Oracle Analytics Server.
- 2. Anomaly detection uses a model trained centrally and deployed locally as PMML.
- 3. RED sync transfer uses a local daemon.
The anomaly detection capability is unidirectionally connected to the analytics and visualization capability within the pillar.
Three capabilities are connected to the Measure, Act pillar. The analytics and visualization capability is unidirectionally connected to local dashboards and reports and also local predictions. The anomaly detection capability is unidirectionally connected to local predictions, and the RED sync transfer capability is unidirectionally connected to an additional use case.
The Measure, Act pillar captures how the consolidated plant data can be used. These potential uses are divided into four groups.
- The first group includes local dashboards and reports.
- The second group includes local predictions.
- The third group includes applications.
- The fourth group contains an additional use case, which is operational efficiency and performance.
The three central pillars—Ingest, Transform; Persist, Curate, Create; and Analyze, Learn, Predict—are supported by Oracle Roving Edge Device(s).
There are four main ways to inject data into an architecture to enable manufacturers to easily understand operational efficiency and performance.
- A custom integration from Oracle Integration Repository lets us integrate data—both structured and unstructured—from various sources, allowing for interactions with devices, custom APIs, and so on. The data can be ingested from any application development type (for example, standalone Java or Python code, Oracle WebLogic Server–based applications, or Kubernetes-based applications). Data will be stored in object storage for further refinement, for outbound transfer, or to feed AI models.
- The RED data sync is an efficient and simple way to transfer ML models from a central location (for example, your object storage repository of trained models in Oracle Cloud Infrastructure (OCI)) to the edge. In this use case, the edge definition would have the RED colocated with other machinery within the plant itself. New versions of models are stored in “standalone” Predictive Model Markup Language (PMML) format. The local daemon will perform an update when a new model is discovered and automatically push it to the RED. The RED data sync is also a great way to transfer all the data collected by different REDs throughout the day (for example, relevant anomalies, signals, and so on) to your central location, most likely to object storage on OCI. This data will then be used for operational reporting and ML model training. The volume of data involved in these RED data sync processes will determine your requirements for edge-to-data center telco or satellite bandwidth.
- Batch ingestion uses Oracle Data Integrator, a comprehensive data integration solution that covers all data integration requirements from high-volume, high performance batch loads to event-driven, trickle-feed integration processes and SOA-enabled data services. While real-time needs are evolving, the most common extract from ERP, planning, warehouse management, and transportation management systems is a batch ingestion using an extract, transform, and load or extract, load, and transform process. These extracts could be frequent, as often as every 10 or 15 minutes, but they are still bulk in nature as transactions are extracted and processed in groups rather than individually. OCI offers different services to handle batch ingestion; these include the native OCI Data Integration service or Oracle Data Integrator running on an OCI Compute instance. Depending on the volumes and data types, data could be loaded into object storage or loaded directly into a structured relational database for persistent storage.
- Analyzing data in real-time from multiple sources can help provide manufacturing companies with valuable insights into their operational efficiency and overall performance. Oracle Data Platform uses streaming ingestion to ingest data streams from several ISA-95 Level 2 systems, such as supervisory control and data acquisition (SCADA) systems, programmable logic controls, and batch automation systems. Streaming data (events) will be ingested and some basic transformations/aggregations will occur before the data is stored in object storage. Streaming analytics can be used to identify correlating events, and identified patterns can be fed back (manually) for a data science examination of the raw data. While traditional analytics tools extract information from data at rest, streaming analytics assesses the value of data in motion, i.e., in real time.
Data persistence and processing is built on three components.
- In the serving data store, data will be managed by Oracle Database Server or MySQL for data processing. The serving data store provides a persistent relational tier often used to serve data directly to end users via SQL-based tools. It also functions as the serving layer for specialized analytics.
- All data retrieved from data sources in its raw form (as a native file or extract) is captured and loaded into object storage to be used in current or future ML model training. Cloud object storage is the most common data persistence layer for our data platform, and it serves as both the inbound transfer area and the outbound transfer area. It can be used for both structured and unstructured data.
- With object storage as the primary data persistence tier, OCI GoldenGate Stream Analytics is the primary processing engine. Batch processing involves several activities, including basic noise treatment, missing data management, and filtering based on defined outbound datasets. Results are written back to various layers of object storage or to a persistent relational repository based on the processing needed and the data types used.
The ability to analyze, learn, and predict is built on two technologies.
- Analytics and visualization services deliver descriptive analytics (describes current trends with histograms and charts), predictive analytics (predicts future events, identifies trends, and determines the probabilities of uncertain outcomes), and prescriptive analytics (proposes suitable actions, leading to optimal decision-making). Oracle Analytics Server provides the functionality to deliver descriptive analytics related to operational reporting and prescriptive analytics. Additionally, ML models can be embedded directly into the Oracle Analytics Server data flow. Oracle Analytics Server is designed to run on-premises and provides dashboards, reporting, alerting, self-service data preparation, and end user–driven machine learning algorithms. Oracle Data Platform for manufacturing is completely open and flexible, so, if desired, you could use third-party tools for this instead.
- Alongside the use of advanced analytics, ML models are developed, trained, and deployed to support anomaly detection. OCI Anomaly Detection is an AI service that makes it easier for developers to build business-specific anomaly detection models that flag critical incidents, speeding up detection and resolution. These models will be trained at the central location and deployed in PMML format to be executed locally as Java or Python code.
Automate decision-making to increase profitability
Oracle Data Platform lets manufacturers get the greatest value from all their available data while simplifying and streamlining data access and storage. The ability to push data collection and ML scoring to the edge through Oracle Roving Edge Devices helps manufacturers make better business decisions that are informed by accurate data that’s always available when they need it, allowing them to increase efficiency and production while lowering costs.
Related resources
-
Use case
Use Data to Improve Workplace Health and Safety
Learn how to make manufacturing operations safer using a data platform that helps you improve health and safety with advanced analytics.
-
Use case
Use Data to Improve Manufacturing Operational Efficiency and Performance
Learn how to manage manufacturing operations more efficiently using a data platform that helps improve performance with machine learning.
-
Use case
Use Your Data to Move from Reactive to Predictive Maintenance
Learn how to optimize assets with a data platform that enables predictive maintenance with machine learning.
Get started
Try 20+ Always Free cloud services, with a 30-day trial for even more
Oracle offers a Free Tier with no time limits on more than 20 services such as Autonomous AI Database, Arm Compute, and Storage, as well as US$300 in free credits to try additional cloud services. Get the details and sign up for your free account today.
-
What’s included with Oracle Cloud Free Tier?
- Two Autonomous AI Database instances, 20 GB each
- AMD and Arm Compute VMs
- 200 GB total block storage
- 10 GB object storage
- 10 TB outbound data transfer per month
- 10+ more Always Free services
- US$300 in free credits for 30 days for even more
Learn with step-by-step guidance
Experience a wide range of OCI services through tutorials and hands-on labs. Whether you're a developer, admin, or analyst, we can help you see how OCI works. Many labs run on the Oracle Cloud Free Tier or an Oracle-provided free lab environment.
-
Get started with OCI core services
The labs in this workshop cover an introduction to Oracle Cloud Infrastructure (OCI) core services including virtual cloud networks (VCN) and compute and storage services.
Start OCI core services lab now -
Autonomous AI Database quick start
In this workshop, you’ll go through the steps to get started using Oracle Autonomous AI Database.
Start Autonomous AI Database quick start lab now -
Build an app from a spreadsheet
This lab walks you through uploading a spreadsheet into an Oracle Database table, and then creating an application based on this new table.
Start this lab now
Explore over 150 best practice designs
See how our architects and other customers deploy a wide range of workloads, from enterprise apps to HPC, from microservices to data lakes. Understand the best practices, hear from other customer architects in our Built & Deployed series, and even deploy many workloads with our "click to deploy" capability or do it yourself from our GitHub repo.
Popular architectures
- Apache Tomcat with MySQL Database Service
- Oracle Weblogic on Kubernetes with Jenkins
- Machine-learning (ML) and AI environments
- Tomcat on Arm with Oracle Autonomous AI Database
- Log analysis with ELK Stack
- HPC with OpenFOAM
See how much you can save on OCI
Oracle Cloud pricing is simple, with consistent low pricing worldwide, supporting a wide range of use cases. To estimate your low rate, check out the cost estimator and configure the services to suit your needs.
Experience the difference:
- 1/4 the outbound bandwidth costs
- 3X the compute price-performance
- Same low price in every region
- Low pricing without long-term commitments
Contact sales
Interested in learning more about Oracle Cloud Infrastructure? Let one of our experts help.
-
They can answer questions like:
- What workloads run best on OCI?
- How do I get the most out of my overall Oracle investments?
- How does OCI compare to other cloud computing providers?
- How can OCI support your IaaS and PaaS goals?