What Is a Graph Database?
Jeffrey Erickson | Senior Writer | January 9, 2026

The way graph databases help uncover relationships among people, places, and events makes them a valuable resource for a range of use cases, including mapping, product recommendations, and fraud detection. More recently, AI systems use graphs to add new levels of context and nuance to outputs. Let’s look at how graph databases work and explore how best to take advantage of their unique capabilities.
What Is a Graph Database?
A graph database is a database designed to store and query complex, interconnected data. It works by storing and representing entities as nodes, and relationships as edges. This graph representation allows database users to run graph analytics, which help them find and explore complex relationships among data entities.
There are a number of graph databases on the market. Some, such as Neo4j, are dedicated graph databases that handle only graph data, while others, including Oracle AI Database, are multimodal enterprise databases that support many data models, including but not limited to graphs. In contrast to traditional relational databases, which store data in tables and use joins to establish relationships, graph databases store these relationships as a fundamental element in the database, making them directly available for querying and exploration using languages such as Cypher, Gremlin, PGQL, and SQL.
A graph database is ideal when you want to uncover complex, dynamic relationships among data entities. That explains their popularity on use cases like routing and logistics systems, where multiple factors go into mapping an ideal route, or social media networks, where a view of the intricate web of connections between users, groups, and interests is needed for recommendations. In addition, AI systems are taking advantage of graph databases to help them deliver more timely, relevant, and nuanced outputs through the growing use of Graph RAG architectures.
Key Takeaways
- Graph databases offer a way to explore relationships and dependencies between points in a data set.
- By storing data as nodes and edges, graph databases allow for quick navigation between connected entities and fast retrieval of related data.
- Graph databases are popular for many use cases, including semantic web applications, fraud detection, social networking, and retail or entertainment recommendation systems.
- Increasingly popular AI systems that use Graph RAG architectures to derive more nuanced and accurate outputs depend on graph databases.
Graph Databases Explained
Graph databases use graph models to represent relationships in data. They allow users to perform what are called “traversal queries” that, essentially, traverse a data set along existing connections to find (indirect) relationships between data points. The database then applies graph algorithms to identify patterns, paths, communities, influencers, single points of failure, and other relationships. The power of graphs is their ability to link disparate data sources to find new insights, even in very large and diverse data sets.
Graph algorithms are specifically designed to analyze relationships and behaviors among data in graphs, making it possible to tease out connections that are difficult or impossible to see with other methods. For example, graph algorithms can identify which individual or item is most connected to others in social networks or business processes, and they can tease out communities, anomalies, common patterns, and paths that connect individuals or related transactions.
To arrive at these insights, algorithms explore the paths and distances between vertices—that is, data points that represent entities in a data set—and their importance and clustering. To determine the significance, algorithms often look at incoming edges, the importance of neighboring vertices, and other indicators. Graph databases store these relationships as data alongside the nodes themselves, allowing for quick navigation and retrieval of connected data. Graph databases also tend to be flexible with their schema, allowing for evolution of the data model as relationships change.
How Do Graph Databases Work?
Graph databases store information as a network of nodes representing entities, like accounts or transactions, and edges that represent the relationships that connect nodes. When the database is queried, it works by traversing these predefined edges from one node to another to find patterns and pathways within the data.
The image below is a simple example of a graph database in action. It visually represents the popular party game “Six Degrees of Kevin Bacon,” which involves making connections between Bacon and another actor based on a chain of mutual films. This emphasis on relationships makes the game the ideal way to demonstrate graph analytics.
Imagine a data set with two categories of nodes: every film made during Bacon’s career and every actor in those films. Then, using graph technology, we run a query asking to connect Bacon to Muppet icon Miss Piggy. The result would be as follows:
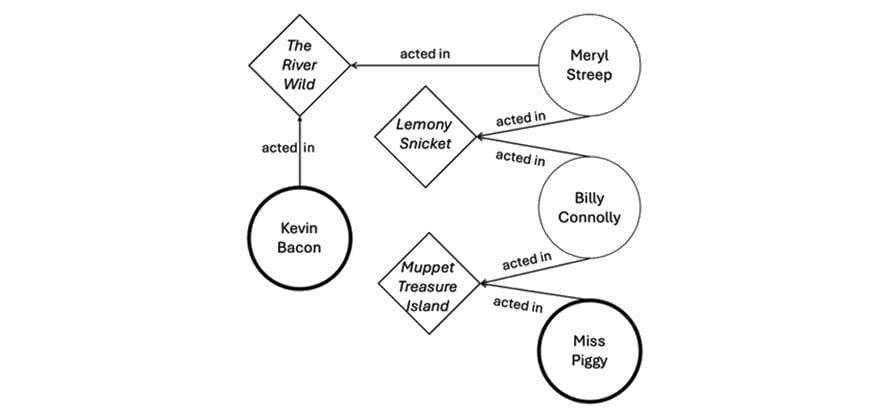
In this example, the available nodes (vertices) are both actors and films, and the relationships (edges) have the status of “acted in.” From here, the query returns the following results:
- Bacon acted in “The River Wild” with Meryl Streep.
- Streep acted in Lemony Snicket’s “A Series of Unfortunate Events” with Billy Connolly.
- Connolly acted in “Muppet Treasure Island” with Miss Piggy.
Graph databases can query many different relationships for this example, such as:
- “What is the shortest chain to connect Kevin Bacon to Miss Piggy?”
A: Shortest path analysis, as used in the Six Degrees game above. - “Who has worked with the largest number of actors?”
A: Degree centrality would find the actor with the highest number of costarring credits. - “What is the average distance between Kevin Bacon and all other actors?”
A: Closeness centrality can be used to show the high degree of interconnectedness between actors in the film industry.
Of course, this is a more amusing example than most uses of graph analytics. But this approach works for nearly all data—any situation where large numbers of records show a natural connectivity. Some of the most popular ways to use graph analytics are for analyzing social and communication networks, website traffic and use, and financial transactions and accounts.
Graph Databases with Graphs
To create a graph, you define the data model, identifying nodes and edges, and then insert data into the graph database using a query language, such as SQL or Oracle’s PGQL, or open source tools, like Cypher or Gremlin.
Graph Databases and Graph Analytics
Databases enable graph analytics by supporting algorithms that traverse graph data to identify patterns and relationships, such as breadth-first search (BFS) and depth-first search (DFS). In addition, graph databases often include built-in functions for graph analytics, like centrality measures and community detection. Some databases enable users to quickly perform actions such as dropping, grouping, expanding, and focusing on vertices and edges to modify a visualization and explore relationships in complex graph data.
Advantages of Graph Databases
Because graph databases emphasize relationships among data points, they promote efficient analysis of complex relationships and can drive deeper, more profound insights with much less effort. Benefits include the following:
- Better analysis of networks: Graphs can quickly pinpoint the nodes that create the most activity or influence or identify the weakest points of a network, helping to analyze the state of the network or community.
- Subsecond analysis: Graph databases explicitly store relationships, so queries and algorithms use this connectivity between vertices to run in subseconds rather than the hours or days it might take in a traditional relational database, which would need to execute countless joins to achieve the same ends.
- Wide array of use cases: Graphs let you explore and discover connections and patterns in, for example, social networks, IoT sensor outputs, data lakes, and data warehouses. They can quickly analyze complex transaction data for multiple business use cases, including fraud detection in banking, discovering dependencies in manufacturing processes, and offering recommendations in retail systems.
When to Use Graph Databases
The ability to quickly understand relationships and connections among people, places, events, funds, and many other possible data points is vitally important to a wide range of business and government activities. To see why, let’s look at a few examples.
Graph Database Use Cases
Graph databases are used in a wide range of industries, with the importance of relationships between data points as a common thread. Use cases include the following:
-
Analyzing social media: Social networks make an ideal use case as they involve many nodes (user accounts) and multidimensional connections (engagements in many different directions). A graph analysis for a social network can determine factors such as, How active are users? (number of nodes). Which users have the most influence? (density of connections). Who has the most two-way engagement? (direction and density of connections). However, this information is useless if bots have unnaturally skewed it.
Social media networks do their best to eliminate bot accounts, as they impact the overall user experience. Fortunately, graph analytics can provide an excellent means for identifying and filtering out bots. In a real-world use case, the Oracle team used Oracle Marketing Cloud to evaluate social media advertising and traction, specifically to identify bots. The most common behavior by these bots involved reposting content from target accounts, thus artificially inflating their popularity. A simple pattern analysis revealed repost count and density of connections to neighbors. Naturally popular accounts showed different relationships with neighbors compared with bot-driven accounts.
This image shows naturally popular accounts.
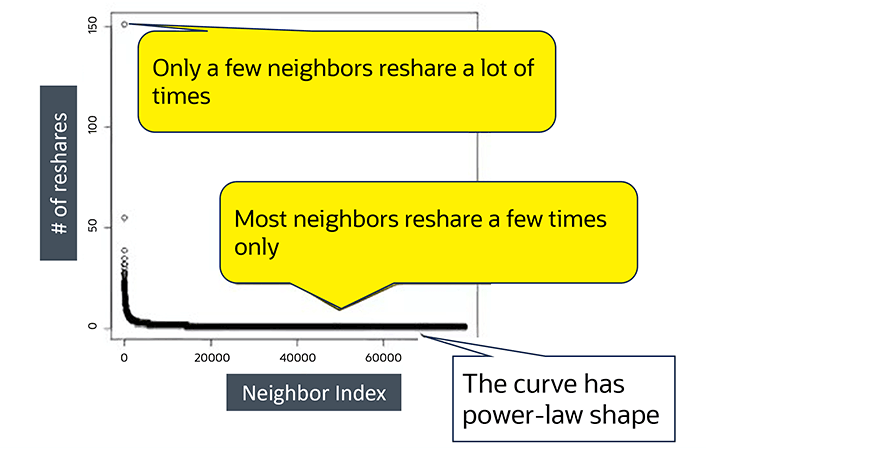 In a simple curve chart viewing real social media accounts, most neighbors will reshare content a few times, following the power-law distribution shape.
And this image shows the behavior of a bot-driven account.
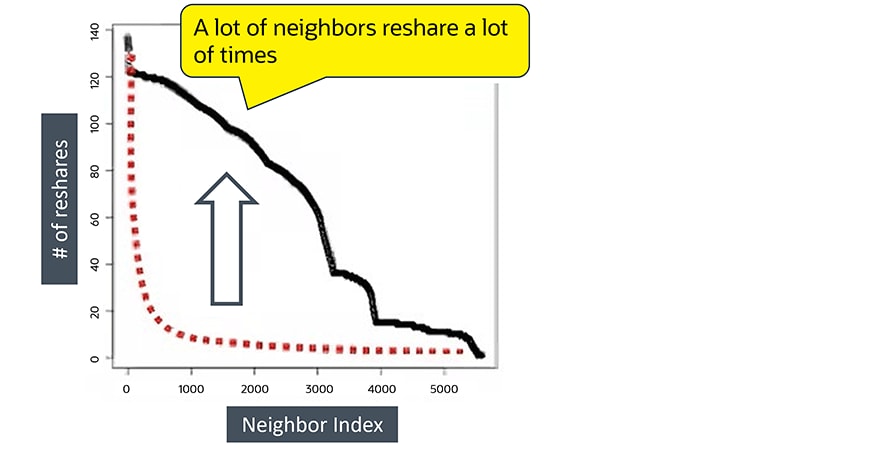 In a simple curve chart depicting bot account activity, a bot account can be spotted by the larger number of neighbors who will reshare several times.
Once graph analytics identified a natural pattern versus a bot pattern, it was as simple as filtering out those accounts, though it’s also possible to dig deeper to examine the relationships between bots and reposted accounts. To verify that this process of bot detection was accurate, flagged accounts were checked after a month. The results were as follows:
- Suspended: 89%
- Deleted: 2.2%
- Still active: 8.8%
This extremely high percentage of punished accounts—91.2%—showed the accuracy of pattern identification. Identifying complex patterns would have taken significantly longer in a standard tabular database, but with graph analytics, it’s possible to do so quickly.
Tracking credit card fraud: Graph databases have become a powerful tool in the finance industry for detecting fraud. Despite advances in technology, such as using embedded chips in cards, fraud can still occur in several ways. Skimming devices can steal details from magnetic strips—a technique commonly used in locations that haven’t yet installed chip readers. Once those details are stored, they can be loaded onto a counterfeit card to make purchases or withdraw money.
Pattern identification is often the first line of defense in fraud detection. Expected purchase patterns are based on location, frequency, types of stores, and other things that fit a user profile. When something appears anomalous—for example, a person who stays within the San Francisco Bay Area most of the time suddenly making a late-night purchase in Florida—the system flags it as potentially fraudulent. The computing power needed for this is simplified significantly with graph analytics, which excels at establishing patterns between nodes. In this case, the categories of nodes are defined as accounts (cardholders), purchase locations, purchase categories, transactions, and terminals. It’s easy to identify natural behavior patterns; for example, in a given month, a person could do the following:
- Buy pet food (purchase category) at different pet stores (terminals)
- Pay for restaurants on weekends (transaction metadata) in a specific region (purchase locations)
- Buy repair hardware (purchase category) at a local hardware store (account location, purchase location)
Fraud detection is typically handled with machine learning, but graph analytics can supplement this effort to create a more accurate, more efficient process. The results have become effective predictors in determining and flagging fraudulent records thanks to the focus on relationships.
Tracking money laundering: Graph databases can help with more advanced fraud as well. For example, conceptually, money laundering is simple: Illegally obtained cash is passed around to blend with legitimate funds and then turned into hard assets. More specifically, a circular money transfer involves a criminal who sends large amounts of fraudulently obtained money to himself but hides it through a long, complex series of valid transfers between “normal” accounts that were created with synthetic identities that typically share similar information. This makes graph analysis an excellent fit to reveal their fraudulent origins. To simplify fraud detection, a financial firm could create a graph from transactions between accounts. Once a graph is created, running a simple query will find all customers with accounts that are sending money to one another and who have similar information, such as emails, addresses, and phone numbers.
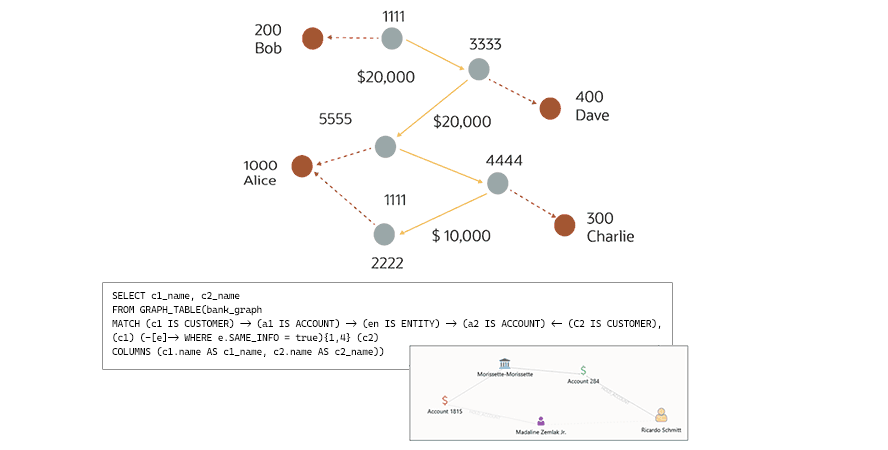 A diagram illustrating a graph database query for money laundering detection, showing a visual map of customers and accounts linked by financial transfers and the corresponding SQL code.
This example shows how a simple query using a graph database could help discover money laundering by finding all customers with accounts that are sending funds to one another and who have similar information.
To learn about other graph database use cases, download the free ebook (PDF)
The Future of Graph Databases
Graph databases and graph techniques have evolved as computing power and data volume requirements have increased over the past decade. It’s become increasingly clear that they will become an important tool for analyzing a brave new world of complex data relationships. As businesses and organizations continue pushing data and analysis capabilities, the ability to derive insights in increasingly complex ways makes graph databases a must-have for today’s needs and tomorrow’s successes.
How to Choose the Right Graph Database
There are two popular models of graph databases: property graphs and RDF graphs, also commonly referred to as knowledge graphs. When selecting the right one for your needs, it’s helpful to remember that the property graph focuses on analytics and querying, while the RDF graph emphasizes data integration and semantic search. Both types of graphs consist of a collection of points (vertices) and the connections between those points (edges). Knowledge graphs, which represent the meaning and context of the relationships identified in the graph data, are increasingly relevant for artificial intelligence.
Property graphs: Property graphs are used to model relationships among data, enabling querying and data analytics based on these relationships. A property graph has vertices containing detailed information about a subject and edges denoting relationships between the vertices. Vertices and edges can have attributes, called properties, with which they are associated.
This example represents a set of colleagues and their relationships as a property graph. We’re showing how colleagues collaborate with and, unfortunately, feud with one another. We could also indicate the properties of these colleagues, such as their roles, what cities they live in, if they’re remote workers, and department information.

Because they’re so versatile, property graphs are used in various industries and sectors, such as finance, manufacturing, public safety, and retail.
RDF graphs: Resource Description Framework, or RDF, graphs conform to a set of Worldwide Web Consortium (W3C) standards designed to represent statements and are best for representing complex metadata and master data. They are often used for linked data, data integration, and increasingly, knowledge graphs. They can represent complex concepts in a domain or provide rich semantics and inferencing on data.
In the RDF model, a statement is represented by three elements: two vertices connected by an edge reflecting the subject, a predicate, and the object of a sentence—this is known as an RDF triple. A Uniform Resource Identifier (URI) identifies every vertex and edge. The RDF model provides a way to publish data in a standard format with well-defined semantics, enabling information exchange. Government statistics agencies, pharmaceutical companies, and healthcare organizations have adopted RDF graphs widely.
Increasingly, RDF graphs are gaining popularity as a way to underpin intelligent applications; many LLMs are already trained on RDF graph representations of public data sets, such as the DBpedia open knowledge graph.
Get Started with Graph Database and Graph Analytics
Oracle makes it easy to adopt graph technologies. Oracle AI Database and Oracle Autonomous AI Database include an integrated graph database and graph analytics engine so users can discover more insights into their data using graph algorithms, pattern-matching queries, and visualization. Graphs are part of Oracle’s converged database, which supports multimodal, multiworkload, and multitenant requirements—all in a single database engine. Oracle Graph supports both Property Graph and RDF Graph models within a single database and supports graph analytics using SQL.
Although all graph databases claim to be high performance, Oracle’s graph offerings are performant in query performance and algorithms and also tightly integrated with Oracle AI Database. This makes it easy for developers to add graph analytics to existing applications and use the scalability, consistency, recovery, access control, and security that the database provides by default. Oracle AI Database is the graph database for the enterprise.
When you want to understand the relationships between the people, places, events, and objects in your data set, there’s no better tool than a graph database. Nowhere is this more evident than the uptake of these databases for the latest AI systems. By viewing data as nodes and edges, graph databases enable AI systems to traverse and analyze these relationships more effectively, leading to deeper insights and more accurate decision-making. Look for graph databases to continue to shine as AI and AI agents take center stage in more enterprise and government implementations in coming years.

The best place to run resource-intensive queries? A hyperscale cloud with the performance and AI capabilities you need to make the most of complex, interconnected data.
Graph Database FAQs
What are graph databases good for?
Graph databases are designed to store and query datapoints by representing it as nodes and edges, which enables them to reveal insights about the patterns and relationships within the data. For this reason, they excel at handling highly connected data in applications such as social networks, recommendation systems, and fraud detection.
Are graph databases used for AI?
Graph databases are commonly used for AI applications, which take advantage of these databases’ ability to efficiently query relationships in complex, interconnected data. This helps the AI power recommendation systems and produce knowledge graphs, which can lead to semantic insights that enhance the AI model’s understanding of text or other content.
Are graph databases the same as relational databases?
Graph and relational databases differ in their approaches to storing and managing data relationships. Relational databases use tables and foreign keys to establish connections between data entities, which can lead to complex joins when dealing with deeply interconnected data. By contrast, graph databases view data as nodes and edges, allowing for more efficient traversal and querying of relationships, making them well suited for applications that involve complex, highly connected data, such as social media sites, retail recommendation engines, or fraud detection systems.