統合されたリアルタイム・データで効率性を高め、リスクを低減する
現在の製造業では、複数のプラントですべてのラインがどれだけ効率的に稼働しているかを把握する必要があります。問題が発生した際には、5分後や10分後ではなく、即座に知る必要があります。しかし、このことは、インターネット接続が限られていたり、散発的であったりする複数の遠隔地からのデータへのリアルタイム・アクセスに依存しているため、最大の課題の1つとなっています。この問題を解決するためには、機械学習(ML)とデータ取得をネットワーク・エッジに使用する必要があります。
エッジでの意思決定を簡素化する
Oracle Data Platformを構成して、Oracle Roving Edge Devices(RED)を使用することで、この課題を解決することができます。各REDは、データの取得、保存、実行、管理、およびデータからのインサイトを得るように設計されており、製造業者はエッジでの意思決定プロセスや製造設備の管理を自動化できるようになります。製造向けOracle Data Platformには異常検知機能も含まれており、これを利用して製造ラインの中断に対処したり、メンテナンス関連のインサイトを提供して問題の軽減と修復を改善したりすることができます。
以下のアーキテクチャは、Oracle Data Platformがエッジに高度な分析と機械学習を導入して異常を特定し、スマートなデータ収集を実行し、リアルタイムの運用情報を提供することにより、プラント・データ統合をどのようにサポートしているかを示しています。
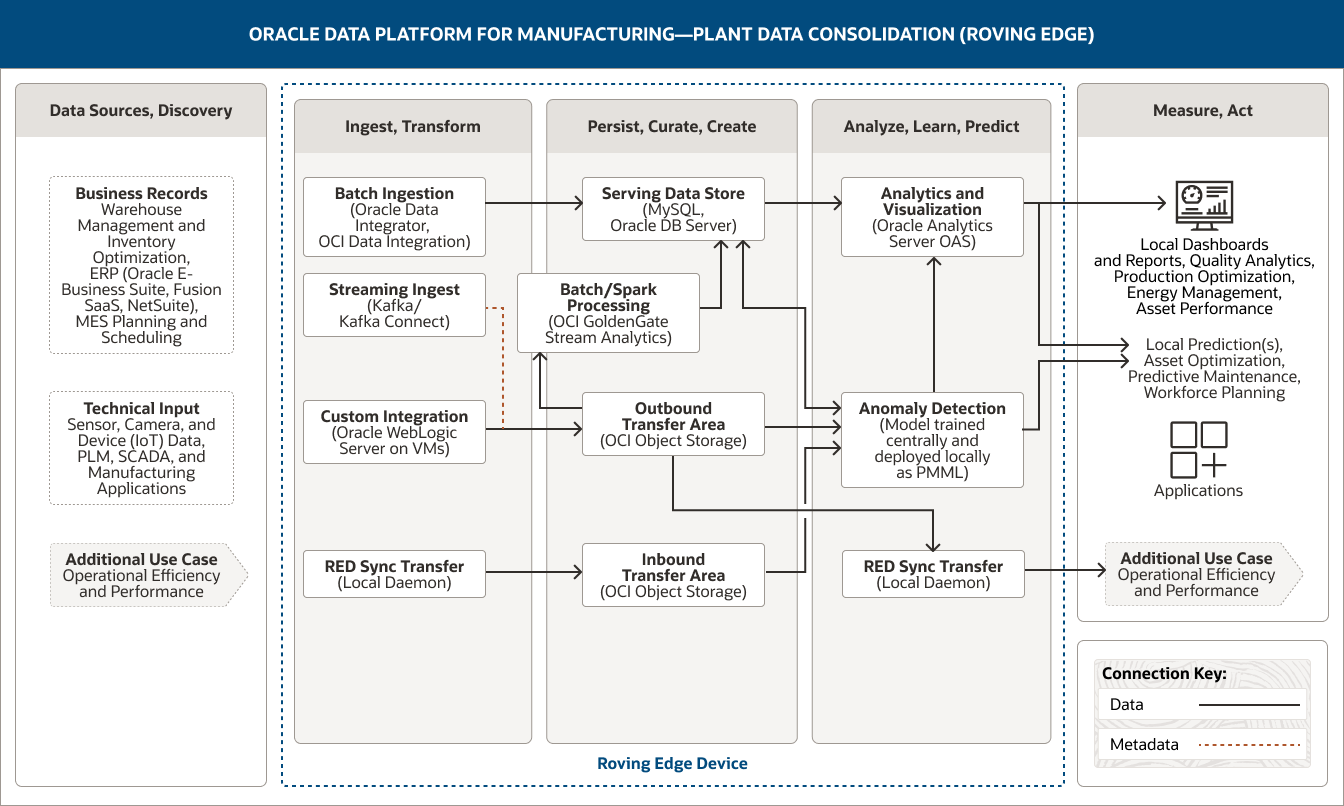
この図は、製造向けOracle Data Platformを使用して、プラント・データを統合する方法を示しています。このプラットフォームは、以下の5つの柱を掲げています。
- 1 データソース、検出
- 2 取込み、変換
- 3 永続化、キュレーション、構築
- 4 分析、学習、予測
- 5 測定、実行
データソース、検出の柱には、2つのカテゴリーのデータが含まれます。
- 1. ビジネス・レコード・データは、倉庫管理・在庫最適化データ、ERP(Oracle E-Business Suite、Fusion SaaS、NetSuite)データ、MES計画・スケジューリング・データで構成されています。
- 2. 技術的な入力データは、センサー、カメラ、デバイス(IoT)データ、およびPLM、SCADA、製造アプリケーションからのデータで構成されます。
取込み、変換の柱は、4つの機能で構成されます。
- 1. バッチ取り込みには、Oracle Data IntegratorとOCI Data Integrationを使用します。
- 2 ストリーミング取り込みにはKafka Connectを使用します。
- 3. カスタム統合には、VM上のOracle WebLogic Serverを使用します。
- 4. RED同期転送には、ローカル・デーモンを使用します。
バッチ取り込みでは、サービング・データストアに一方向に接続されています。
ストリーミング取り込みとカスタム統合では、アウトバウンド転送領域に一方向に接続されています。
また、RED同期転送では、インバウンド転送領域に一方向に接続されています。
永続化、キュレーション、構築の柱は、4つの機能で構成されます。
- 1. サービング・データストアは、MySQLとOracle DBサーバーを使用します。
- 2. バッチ処理/Spark処理には、OCI GoldenGate Stream Analyticsを使用します。
- 3. アウトバウンド転送領域は、OCI Object Storageを使用します。
- 4. インバウンド転送領域は、OCI Object Storageを使用します。
こうした機能は、柱の中で接続されています。バッチ処理/Spark処理では、サービング・データストアに一方向に接続されています。
アウトバウンド転送領域は、バッチ/Spark処理に一方向に接続されています。
3つの機能は、分析、学習、予測のピラーにつながります。
サービング・データストアは、分析と可視化機能には一方向に接続され、異常検知機能には双方向に接続されています。アウトバウンド転送領域は、異常検知機能およびRED同期転送機能に一方向に接続されています。
インバウンド転送領域は、異常検知機能に一方向に接続されています。
分析、学習、予測のピラーは、3つの機能で構成されています。
- 1. 分析・可視化にはOracle Analytics Serverを使用します。
- 2. 異常検知では、一元的に学習され、ローカル導入されたモデルをPMMLとして使用します。
- 3. REDの同期転送には、ローカル・デーモンを使用します。
異常検知機能は、ピラー内の分析・可視化機能と一方向に接続されています。
3つの機能は測定、実行のピラーに接続されています。分析・可視化機能は、ローカルのダッシュボードやレポート、またローカルの予測に一方向に接続されています。異常検知機能はローカル予測に、RED同期転送機能は追加のユースケースに、それぞれ一方向に接続されています。
測定、実行のピラーは、統合されたプラント・データをどのように使用できるかを示します。これらの潜在的な利用方法は、4つのグループに分けられます。
- 第1のグループには、ローカル・ダッシュボードとレポートが含まれています。
- 第2のグループには、ローカル予測が含まれています。
- 第3のグループには、アプリケーションが含まれています。
- 第4のグループには、追加のユースケース(運用効率とパフォーマンス)が含まれています。
Oracle Roving Edge Deviceは、3つの中心的なピラーである「取り込み、変換」、「永続化、キュレーション、構築」、「分析、学習、予測」をサポートしてます。
メーカーが業務効率やパフォーマンスを容易に把握できるようにするために、データをアーキテクチャに取り込む方法は主に4つあります。
- Oracle Integration Repositoryからのカスタム統合では、さまざまなソースから構造化および非構造化の両方のデータを統合し、デバイスやカスタムAPIなどとのやり取りを可能にします。データは、あらゆるアプリケーション開発タイプ(例えば、スタンドアロンのJavaまたはPythonコード、Oracle WebLogic Serverベースのアプリケーション、Kubernetesベースのアプリケーション)から取り込むことができます。データはオブジェク・トストレージに保存され、さらなる絞込み、アウトバウンド転送、またはAIモデルへのフィードに使用されます。
- REDデータ同期は、MLモデルを中央の場所(たとえば、Oracle Cloud Infrastructure(OCI)内の学習済みモデルのオブジェクト・ストレージ・リポジトリ)からエッジに転送する効率的で簡単な方法です。このユースケースのエッジの定義では、REDがプラント内で他の機械と一緒に配置されることになります。モデルの新しいバージョンは、「スタンドアロン」のPredictive Model Markup Language(PMML)形式で保存されます。新しいモデルが発見されると、ローカル・デーモンが更新を実行し、自動的にREDにプッシュします。また、REDのデータ同期は、1日を通して異なるREDが収集したすべてのデータ(例えば、関連する異常やシグナルなど)を、中央の場所(最も多いのはOCI上のオブジェクト・ストレージ)に転送するのに最適な手段です。このデータは、運用レポートやMLモデルのトレーニングに使用されます。これらのREDデータ同期プロセスに関わるデータ量によって、エッジからデータセンターまでの電話回線や衛星通信の帯域幅に対する要件が決まります。
- バッチ取り込みには、包括的なデータ統合ソリューションであるOracle Data Integratorを使用します。これは、大量かつハイパフォーマンスなバッチロードからイベントドリブンのトリクルフィード統合プロセス、SOA対応のデータサービスまで、あらゆるデータ統合要件をカバーします。リアルタイムのニーズは進化していますが、ERP、プランニング、倉庫管理、輸送管理システムからの最も一般的な抽出は、抽出、変換、ロード/抽出、ロード、変換プロセスを使用したバッチ取り込みです。これらの抽出は、10分や15分といった頻度で行われることもありますが、それでもデータを個別のトランザクションではなく、グループでまとめて処理することになります。OCIは、ネイティブのOCI Data Integrationサービスや、OCI Computeインスタンス上で動作するOracle Data Integratorなど、バッチ取り込みを処理するさまざまなサービスを提供しています。データの量や種類によっては、オブジェクト・ストレージにロードしたり、構造化されたリレーショナル・データベースに直接ロードして永続的に保存することが可能です。
- 複数のソースからのリアルタイムでデータ分析を行うことは、業務効率や全体的なパフォーマンスに関する貴重なインサイトの提供につながります。Oracle Data Platformは、ストリーミング取り込みを使用して、監視制御およびデータ取得(SCADA)システム、プログラマブル・ロジック制御、バッチ自動化システムなどの複数のISA-95 Level 2システムからデータ・ストリームを取り込みます。ストリーミングデータ(イベント)が取り込まれ、データがオブジェクト・ストレージに保存される前に、いくつかの基本的な変換/集約が行われます。ストリーミング分析を、相関するイベントを特定するために使用することができます。特定されたパターンは、生データのデータサイエンス調査のために(手動で)フィードバックすることができます。従来の分析ツールが保存されているデータから情報を抽出する一方で、ストリーミング分析は稼働中つまりリアルタイムのデータの価値を評価します。
データの永続化と処理は、3つのコンポーネントで構築されています。
- サービング・データストアでは、データはOracle Database ServerまたはMySQLによって管理され、データ処理が行われます。サービング・データストアは、SQLベースのツールでエンドユーザーに直接データを提供するために一般的に使用される、永続的なリレーショナル層です。また、特殊な分析のためのサービス層としても機能します。
- データソースから生データ(ネイティブ・ファイルまたは抽出データ)で取得したすべてのデータは、オブジェクト・ストレージに取り込まれ、現在または将来のMLモデルのトレーニングで使用されます。クラウド・オブジェクト・ストレージは、オラクルのデータ・プラットフォームの最も一般的なデータ永続性レイヤーであり、インバウンド転送領域とアウトバウンド転送領域の両方の役割を果たします。構造化データと非構造化データの両方に使用することができます。
- オブジェクト・ストレージを主要なデータ永続性レイヤーとし、OCI GoldenGate Stream Analyticsを主要な処理エンジンとします。バッチ処理には、基本的なノイズ処理、欠損データ管理、定義されたアウトバウンド・データセットに基づくフィルタリングなど、複数の作業が含まれます。結果は、必要な処理と使用されたデータ・タイプに基づいて、さまざまな層のオブジェクト・ストレージまたは永続的なリレーショナル・リポジトリに書き戻されます。
分析、学習、予測機能は、2つのテクノロジーで構築されています。
- 分析と可視化サービスは、記述的分析(ヒストグラムやチャートで現在の傾向を説明)、予測分析(将来の出来事を予測し、傾向を特定し、不確実な結果の確率を決定)、処方的分析(最適な意思決定を導く、適切な行動を提案)を提供します。Oracle Analytics Serverは、業務報告や処方的分析に関連する記述的分析を提供する機能を備えています。さらに、MLモデルをOracle Analytics Serverのデータフローに直接組み込むことができます。Oracle Analytics Serverはオンプレミスで動作するように設計されており、ダッシュボード、レポート作成、アラート、セルフサービスによるデータ準備、およびエンドユーザー主導の機械学習アルゴリズムを提供します。製造向けOracle Data Platformは完全にオープンで柔軟性があるため、必要であれば、代わりにサードパーティのツールを使用することができます。
- 高度な分析の使用に加えて、MLモデルは異常検出をサポートするために開発、トレーニングおよびデプロイされます。OCI Anomaly Detectionは、開発者がビジネスに特化した異常検知モデルを簡単に構築できるAIサービスで、重要なインシデントにフラグを立て、迅速な検知と解決を可能にします。これらのモデルは中央の拠点で学習され、JavaまたはPythonコードとしてローカルで実行できるようにPMML形式でデプロイされます。
意思決定を自動化し、収益性を向上させる
Oracle Data Platformにより、製造業者は、データへのアクセスと保存を簡素化および効率化しながら、利用可能なすべてのデータから最大の価値を得ることができます。Oracle Roving Edge Devicesを通じてデータ収集とMLスコアリングをエッジにプッシュする機能により、製造業者は、必要なときにいつでも利用できる正確なデータに基づいて、より良いビジネス上の意思決定を行うことができます。これにより、コストを削減しながら効率性と生産性を向上させることができます。
関連リソース
-
ユース・ケース
データ活用による職場の安全衛生の改善
高度な分析で安全衛生の向上を支援するデータ・プラットフォームを使用して、製造業務の安全性を高める方法をご紹介します。
-
ユース・ケース
データ活用による製造運用の効率化とパフォーマンス向上
機械学習によるパフォーマンス向上を支援するデータ・プラットフォームを使用して、製造業務の管理を効率化する方法をご紹介します。
-
ユース・ケース
データを用いた予防メンテナンスから予測メンテナンスへの移行
機械学習による予測メンテナンスを可能にするデータ・プラットフォームで、資産を最適化する方法をご紹介します。
ここから始めよう
20以上のAlways Freeクラウド・サービスを30日間の試用版で試す
オラクルは、Autonomous AI Database、Arm Compute、Storageなどの一部のサービスについて時間制限のないFree Tier(無償枠)を設けています。また、その他のクラウド・サービスをお試しいただけるよう、300米ドル分の無償クレジットもご用意しています。詳細をご確認のうえ、今すぐ無料アカウントにご登録ください。
-
Oracle Cloud Free Tierの内容
- 2つのAutonomous AI Databaseインスタンス、各20GB
- AMDおよびArm Compute VM
- 200GBの合計ブロック・ストレージ
- 10GBのオブジェクト・ストレージ
- 10TBのアウトバウンド・データ転送/月
- 10以上のAlways Freeサービス
- 300ドルの無料クレジットが30日間提供
段階的なガイダンスで学ぶ
チュートリアルとハンズオン・ラボを介して、幅広いOCIサービスを体験してください。開発者、管理者、アナリストのいずれであっても、OCIの仕組みを把握できるよう支援します。多くのラボは、Oracle Cloud Free TierまたはOracle提供の無料ラボ環境で実行されます。
-
OCIコア・サービスを使い始める
このワークショップのラボでは、仮想クラウド・ネットワーク(VCN)やコンピュートおよびストレージ・サービスを含むOracle Cloud Infrastructure(OCI)コア・サービスの概要を説明します。
OCIのコア・サービス・ラボを今すぐ始める -
Autonomous AI Databaseのクイック・スタート
このワークショップでは、Oracle Autonomous AI Databaseを使い始めるための手順について説明します。
Autonomous AI Databaseのクイック・スタート・ラボを今すぐ始める -
スプレッドシートからアプリを構築
この演習では、スプレッドシートをOracle Database表にアップロードし、この新しい表に基づいてアプリケーションを作成します。
このラボを今すぐ始める
150以上のベストプラクティス設計の詳細
アーキテクトなどのお客様が、エンタープライズ・アプリケーションからHPCまで、マイクロサービスからデータレイクまで、さまざまなワークロードをどのように導入しているかを参照してください。ベストプラクティスを理解し、当社のBuilt &Deployedシリーズで他のお客様のアーキテクトから話を聞くとともに、「Click to deploy」機能を使用して多くのワークロードをデプロイしたり、GitHubリポジトリから自分でデプロイすることができます。
一般的なアーキテクチャ
- Apache TomcatとMySQL HeatWave Database Service
- Oracle Weblogic on KubernetesとJenkins
- 機械学習(ML)およびAI環境
- Tomcat on ArmとOracle Autonomous AI Database
- ELKスタックによるログ分析
- OpenFOAMを使用したHPC
OCIのコスト削減効果をご覧ください
Oracle Cloudの価格は、わかりやすく、世界中で一貫性のある低価格であり、さまざまなお客様事例をサポートしています。コストを試算するには、コスト見積ツールをチェックし、ニーズに応じて、サービスを設定します。
違いを体感してください。
- 1/4のアウトバウンド帯域幅コスト
- コンピューティングのコストパフォーマンスが3倍向上
- すべてのリージョンで同じ低価格
- 長期的なコミットメントのない低価格
-
次のような質問に回答します。
- OCIで最適に動作するワークロードは何ですか?
- オラクルへの投資全体を最大限に活用するには、どうすればよいですか?
- OCIは、他のクラウド・コンピューティング・プロバイダーと比較して、どうですか?
- OCIはIaaSとPaaSの目標をどのようにサポートできますか?