Web Analytics Using Oracle Application Server Discoverer
by Timothy Cambier and Brian Carr
Learn how to create your own website reporting system using the reporting capabilities of Discoverer and log files generated from Apache web server.
If you are responsible for managing your company's website or administrating the web servers on which it reside, then you are most likely reporting site usage statistics to management. Analyzing the information found in the log files generated from your web server can be an effective way to optimize the site for business value, improve user experience, and enhance site performance.
Many companies rely on costly, off-the-shelf analytic tools for this purpose. While some companies require general reports such as Total Hits, Visitor Sessions, Unique Visitors, and Page Views to measure the effectiveness of their websites, some look more deeply into the information captured in the log files. More detailed reports provide information such as Most Requested Pages, Top Referrals, Most Used Browsers, Bandwidth Usage, Search Engines, and so on. The majority of the vendor-supplied tools require licensing support costs, and some packages can increase your costs based on the amount of traffic or websites you wish to report on.
However, getting access to the generated trace file is sometimes a little bit more difficult; you have to ensure that you have access to the USER_DUMP_DIRECTORY on the server where the database lives. When connections to the database are generally client based, this database server may not always be readily accessible. If you also want to issue a
TKPROF instruction to convert your raw trace file into something more readable, you generally have to secure command line access to the database server. If you are a DBA supporting lots of different databases on lots of different servers, the job of accessing generated trace files and using
TKPROF to format them becomes even more difficult.
In this article, we will offer an overview of an alternative that is available to companies running Oracle Application Server 10g Enterprise Edition . Instead of investing in another expensive information silo, these companies can apply the reporting power and flexibility of the Oracle Application Server Discoverer query and analysis tool to information-rich web server log files to produce reports comparable to those available from standalone solutions. (This article assumes baseline knowledge of Discoverer; consult the Oracle documentation for more details.
This low-cost alternative to pricey web analytic software can be achieved in four steps:
- Build your data structure for Apache combined log files.
- Create ETL triggers and SQL Loader scripts for the decomposition of the data.
- Build the Business Area (items classes, date hierarchies, and summaries).
- Create the Discoverer Workbook for Web Analytic Reporting with any predefined filters, parameters, or conditions.
For maximum benefit, Discoverer worksheets can then be placed into a single Oracle Portal page using Discoverer's portlet technology. This approach will let users access multiple reports in one page and to visualize the information in graphs with summary or detailed data. (This process however, which would require an article in itself, lies outside our discussion here.)
The following sections cover the steps required to set up your own web analytic reporting workbook.
Step 1: Build Your Data Structure for Apache Combined Log Files
In our example we will use combined log files created from our Apache web server. These delimited log files can easily be imported into a spreadsheet or database, but a difficulty arises when you want to report on data that is part of a larger collection of information#USER_AGENT, for example. In this case, the use of an ETL script (see the source code for this article) is helpful for parsing the information into separate, more meaningful fields. By using the ETL script to parse our data up front, we obviate the need for complex calculations and summaries in our workbook.
A single entry in an Apache combined log file is shown below.
127.0.0.1 - username [09/Sept/2004:13:55:36 -0600] "GET /someimage.gif HTTP/1.0"
  200 1234 "http://www.mywebsite.com/index.asp" "Mozilla/4.08 [en] (OS; Version ;Browser)"
The table below displays the individual arguments from our log file example, with the corresponding definition as defined by the Apache Software Foundation.
| Field | Definition |
|---|---|
127.0.0.1
|
The IP address of the client (remote host) that made the request to the server. |
| - | The "hyphen" in the output indicates that the requested piece of information is not available. |
username
|
The userid of the person requesting the document as determined by HTTP authentication. |
[09/Sept/2004:13:55:36 -0600]
|
The time that the server finished processing the request. The format is:
[day/month/year:hour:minute:second zone]
|
"GET /someimage.gif HTTP/1.0"
|
The request line from the client is given in double quotes. The request line contains a great deal of useful information. First, the method used by the client is GET; second, the client requested the resource /apache_pb.gif; and third, the client used the protocol HTTP/1.0. |
200
|
This is the status code that the server sends back to the client. This information is very valuable, because it reveals whether the request resulted in a successful response (codes beginning in 2), a redirection (codes beginning in 3), an error caused by the client (codes beginning in 4), or an error in the server (codes beginning in 5). The full list of possible status codes can be found in Section 10 of the HTTP specification. |
1234
|
The last entry indicates the size of the object returned to the client, not including the response headers. |
"http://www.mywebsite.com/index.asp"
|
The "Referer" (sic) HTTP request header; indicates the site from which the client reports having been referred. |
"Mozilla/4.08 [en] (OS; Version ;Browser)"
|
The User-Agent HTTP request header. This is the identifying information that the client browser reports about itself. |
For the purpose of understanding how a log file record is parsed, Figure 1 shows the data mappings that were created to import the file into our database structure.
Figure 1: Data mappings
TIMESTAMP is divided into two fields: one for the time and date, the other for the time zone. When this log file is parsed, you can create an entry in your business area that makes it possible to drill into and out of multiple levels of time and date#such as YEAR, QUARTER, WEEK, DAY, and HOUR.
The USER_AGENT field contains multiple types and levels of information about the visitors to your website. By dividing this information into separate fields you will be able to call out the type of browser, the version of the browser, and what platform and platform version your visitors are using to access your website.
SUCCESS_CODE will be important when you want to track erroneous and successful hits on your website. This structure is a key for determining visitor sessions, which report on successful hits to your web pages. Including it as a Page Item on your workbook allows you to toggle between success and error codes.
In the next section we describe the ETL trigger and SQL Loader scripts that you can use for the decomposition of the combined log file. (The database creation script, SQL Loader file, Discoverer export file, and the Discoverer workbook file are all available in the source code download.)
Step 2: Create ETL Triggers and SQL Loader Scripts
The insert trigger, shown in Listing 1, performs decomposition of the Apache log files into meaningful data that can be used for subsequent queries. You can tweak this trigger to meet your specific needs.
The first element of data you transform (Section 1 of the script) is taking your root documents, such as index.htm and the site name (e.g. www.mywebsite.com), which are synonymous, and making them the same entry. Apache stores them as two distinct entries in your log files. For analysis purposes, they are one in the same to us.
In Section 2 through 5 of our trigger you are extracting various pieces of data from the Apache User Agent field. The User Agent field from Apache has several important pieces of data wrapped inside it. Due to the different operating systems and browsers that visit your websites, this field can be very difficult to decipher and transform into individual meaningful data elements.
In Section 2 you are obtaining the browser that visited our site.
In Section 3 you are grabbing the platform/operating system used to visit our site.
In Section 4 you are populating our BROWSER_AGGREGATE column of our WEB_DETAIL table. This is where you group all Microsoft browsers (5.1, 5.2, 6.0, etc) into one entry for "Microsoft Internet Explorer."
Section 5 is used to extract the version of the browser used.
Section 6 simply converts the Request Size to kilobytes, thus saving time later on calculations.
Step 3: Build the Business Area
Our source code contains a file, WebAnalytic.eex, that will allow you to import the business area into Discoverer. The business area has a date hierarchy and several item classes created for you, including Status Description, User Agent, Browser, Platform, Browser Aggregate, and Version.
We recommend that you import this business area into your development systems. To do so, open Discoverer Administrator, choose File , select Import , and then browse to WebAnalytic.eex.
Create the Discoverer Workbook
To determine the reports that best suite the needs of your business or web server administrators, you should define the requirements up front so that you do not waste time creating irrelevant reports. If you are publishing content for end users with no expectation of revenue tracking or product sales, then reports such as 10 Top Pages Viewed, Top Visitors, Referrers, Entry & Exit Pages, Bandwidth Usage, Browsers, and Platforms may be sufficient. As a rule of thumb, you may want to include a Summary page that shows high-level numbers for a date range (one month in most cases). This summary allows for easy visualization of traffic patterns such as Hits, Visitor Sessions, Page Views, and Bandwidth Usage.
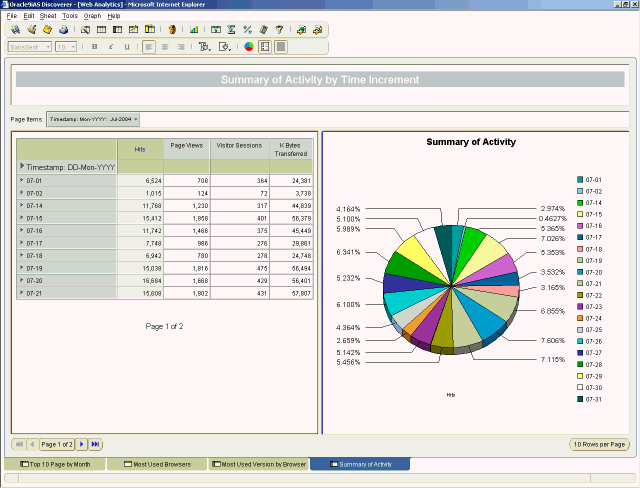
Figure 2: Summary page
For e-commerce sites, you may choose to create the reports mentioned above along with Visitor Geographics, Purchase History, Sales Patterns, Top Products, Billing Preferences and Payment Types, Referrals, and Search Engines.
All these items are available in the information found in the log files created from your web server, although some configuration to the ETL and web server may need to take place to generate some of the fields mentioned above.
When you have defined what you would like to measure, you can begin creating your table view and cross-tab Discoverer reports. You may find the cross-tab reporting abilities better suite your needs for comparing data across date ranges and categories. Creating a RANKING condition and applying it to the Count of IPs will allow you to view the "top X" number of records (Top 10 being the most common).
Figure 3: Top 10 Pages report
Be sure to take advantage of assigning Page Items to your reports to add the capability of quick filtering. TIMESTAMP can be used as a Page Item for reports such as Top 10 Pages, Visitor Sessions, and Hits. You may also choose to assign BROWSER as a Page Item to drill into VERSION.
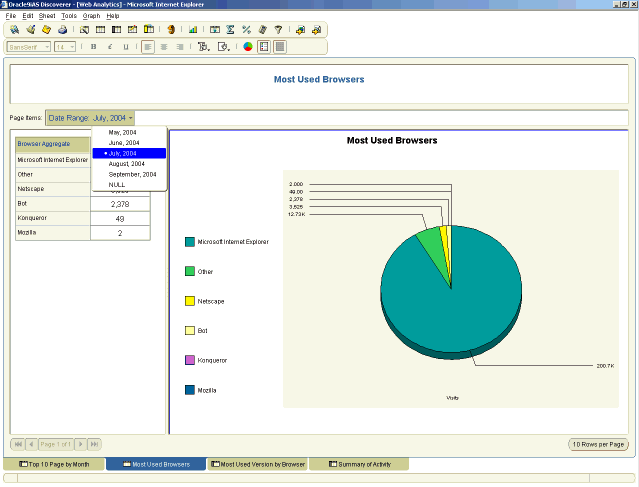
Figure 4: Most Used Browsers report (detail)
In addition to displaying the details and summaries for particular categories, Discoverer also offers an easy to use graphing feature. 2D and 3D graphs can be added to your reports in the form of Pie Charts and Bar, Area, and Line graphs, to name a few. Each graph can be customized to report on row or column data, totals or detail. Discoverer graphs allow the designer to add custom titles and labels for the X and Y axes.
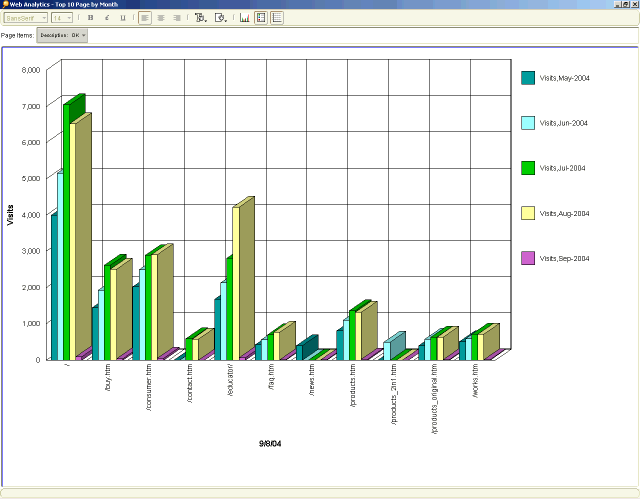
Figure 5: Most Used Browsers report (graph)
Another feature you may find helpful is the Workbook Scheduler, which allows your workbook to be processed outside of non-core business hours. For complex and time-intensive reports this approach may decrease the amount of time a user has to wait for a report.
When you have the completed workbook you can offer the Web Analytic reporting workbook to end users via Discoverer Plus or Discoverer Viewer. Users can then view the reports and graphs by choosing the worksheet they want to work with.
Conclusion
You should now have a good understanding of the Apache log file and how you can use Oracle Application Server Discoverer to turn it into powerful and actionable business intelligence.
Due to the large number of records in many Apache log files, you may consider using partitions or other functionality to improve performance. With these steps, you have done all the necessary work to begin performing your own ad-hoc analysis of traffic hitting your corporate sites.
Timothy Cambier (admin@webportal101.com) is an Oracle Portal Administrator living in Green, Ohio. His Web site, www.webportal101.com, contains information on planning, designing, and deploying corporate Web portals.
Brian Carr ( editor@oraclegiants.com) a founding member of Oracle Giants, is an Oracle Certified Professional and Oracle ACE.